Experiment Diagnostics
Monitor the health of experiments
After you turn on your experiment, you can monitor its health and view the exposures for the control and variant groups.
Monitoring experiment health
To monitor the status of your experiment,
Navigate to Experiments in the left-hand navigation panel in the Statsig console.
Select the experiment you want to monitor.
Experiment Health Checks show alerts for problems with the experiment setup. Hover over the icon and click on a check for more details.
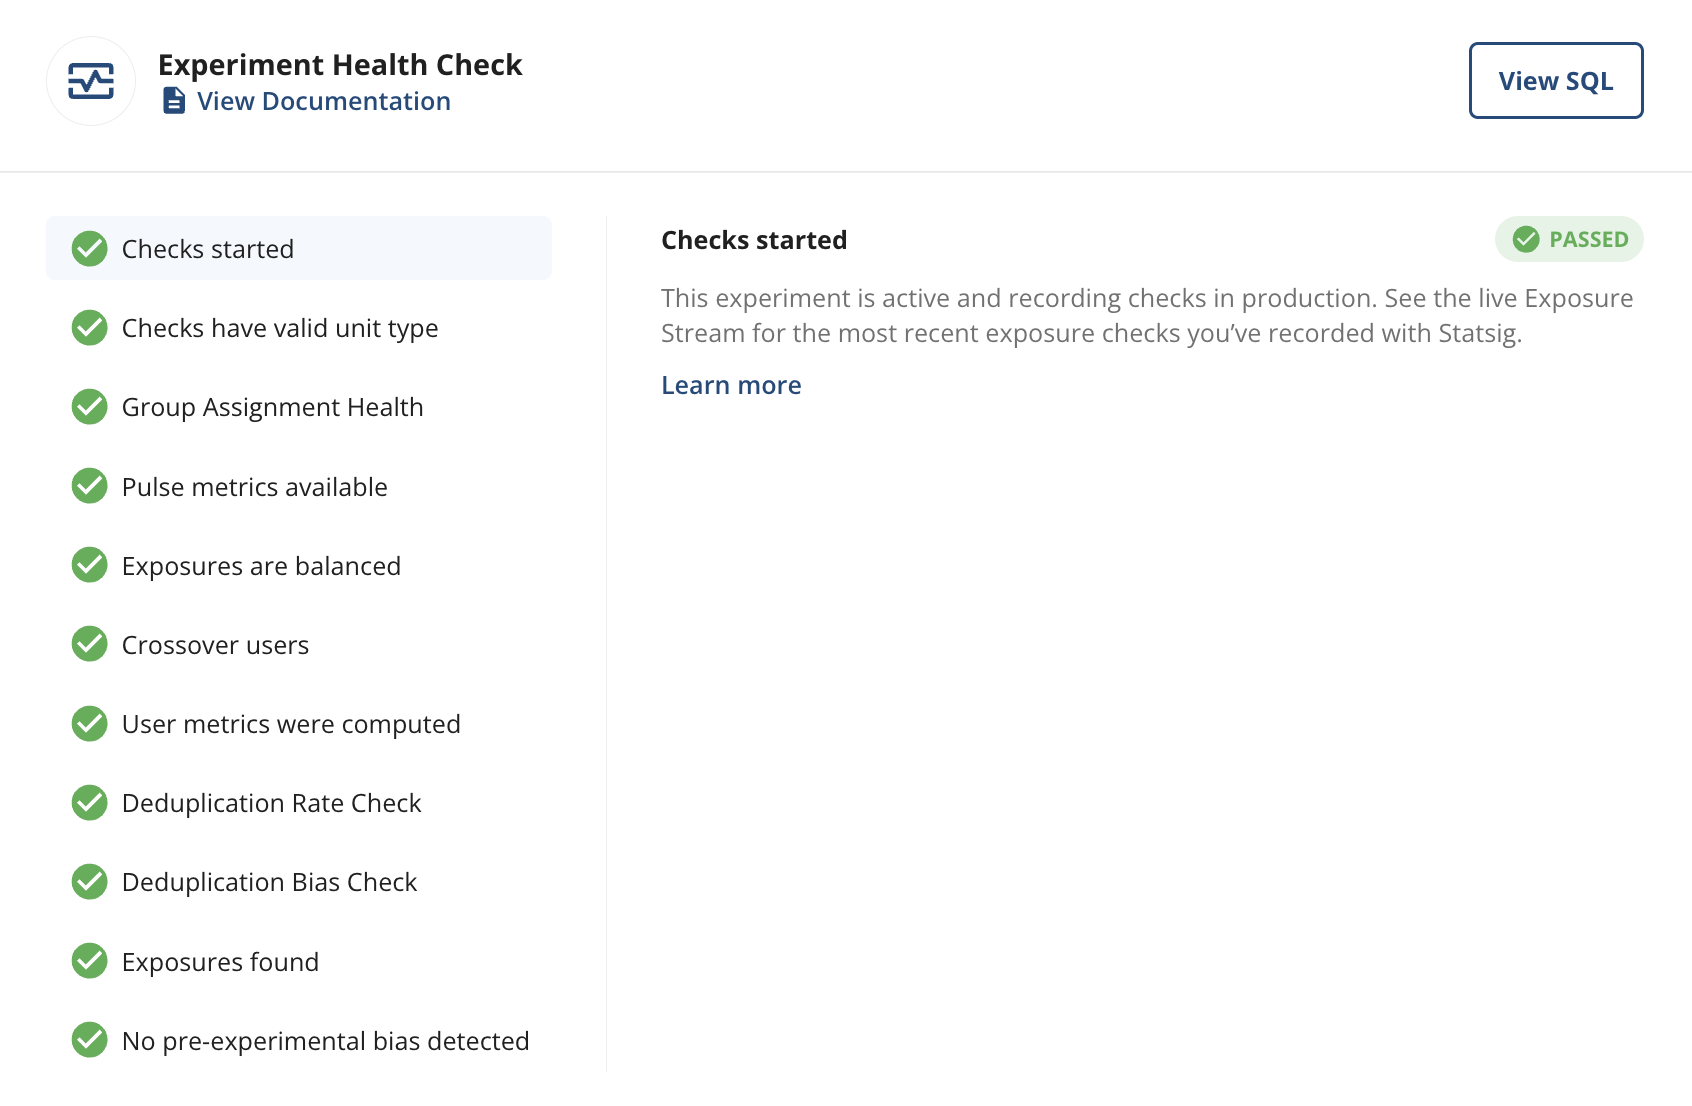
- Pulse metrics available monitors availability of Pulse results, which Statsig expects the day after the experiment starts if your metrics have landed.
- Exposures are balanced checks that the number of units exposed in each group matches the expected allocation. The Sample Ratio Mismatch (SRM) check uses a Chi-Squared test of independence. Experiments can temporarily show small imbalances due to the randomness of user assignment; these typically resolve after a couple of days. True SRM imbalances that originate from systematic assignment or logging problems tend to persist over time. The following thresholds apply to SRM alerts:
- p-value between 0.001 and 0.01: Warning (yellow) for possible imbalance. The p-value isn't low enough to confirm a real imbalance. Wait and check again the next day.
- p-value < 0.01 and group size differs from expected size by less than 0.1% absolute: Warning (yellow) indicating that an imbalance is possible, but the impact to the experiment is likely small. This scenario typically occurs in large web experiments (1M+ users). In these experiments, small variations in performance across groups can cause Statsig to drop a small fraction of exposures for certain groups more than others.
- p-value < 0.001 and more than 0.1% absolute deviation from expected group size: Alert (red) meaning there is likely a problem with the experiment exposures and experiment results may not be trustworthy.
- Crossover users monitors the percentage of units exposed to more than one experiment group. Statsig discards crossover users from the experiment analysis, which may reduce your sample size and statistical power. The following alerts apply based on the threshold for that experiment type:
- Warning (yellow): Statsig detected several crossover users, but the impact on the experiment is likely relatively small.
- Assign & Analyze: 0.1% to 1%
- Analyze Only: 1% to 10%
- Alert (red): There are a substantial number of crossover users, which can indicate a problem with your experiment setup.
- Assign & Analyze: Over 1%
- Analyze Only: Over 10%
- Warning (yellow): Statsig detected several crossover users, but the impact on the experiment is likely relatively small.
- User metrics were computed confirms that Statsig joined exposure data to metric data and produced experiment results.
- Metrics Available for Topline Impact checks whether there is sufficient metric data to calculate topline impacts. Go to topline impact for details.
- Differential Impact Detection completed checks whether the differential impact detection has finished and flags extreme differential impacts for any sub-population according to your configuration. Go to differential impact detection for details.
Some health checks apply only to end-to-end Statsig experiments where the Statsig SDK handles assignment; others apply only to analysis experiments where assignment happens outside of Statsig.
- Checks started (end-to-end only) verifies that config checks are occurring. Available shortly after the experiment starts.
- Checks have valid unit type (end-to-end only) ensures that config checks contain the unit ID type selected for this experiment (user ID by default). Available when checks begin.
- Exposures found (analysis only) verifies that you provide exposures for this experiment, and Statsig populates it after pulse loads.
Some health checks apply to experiments where Statsig stitches ID types. For example, in a sign-up flow experiment, stitching Stable ID to User ID enables analysis before and after a user logs in.
Duplicate mapped IDs occur when the same primary ID maps to multiple secondary IDs or vice versa. This happens when you reset the primary identifier, or when there are multiple conversions from the same primary identifier. Deduplication can reduce your sample size and may affect the overall magnitude of your results.
Deduplication Rate Check reports the percentage of exposures which have duplicate mapped ids across primary and secondary IDs. Statsig uses the following thresholds to display deduplication rate alerts:
- Deduplication rate between 1% and 5% Warning (yellow) indicating that Statsig applied deduplications; Statsig excludes affected units from analysis, which reduces the sample size and may affect the overall magnitude of results.
- Deduplication rate greater than 5% Alert (red) indicating that Statsig applied and excluded a substantial number of deduplications from analysis. This can indicate a problem with the experiment setup or a 1-many mapping between the two IDs.
Deduplication Bias Check reports the percentage of exposures which have duplicate mapped ids across primary and secondary IDs in each group and performs a Chi-Squared test of independence. Statsig uses the following thresholds to display deduplication bias alerts:
- p-value between 0.001 and 0.01: Warning (yellow) indicating possible bias. The p-value isn't low enough to confirm a real imbalance in deduplication rate between groups. Wait and check again the next day.
- p-value < 0.001: Alert (red) indicating that Statsig is likely applying deduplication more to one treatment group, and experiment results may not be trustworthy.
- Pre-experimental Bias Check In some cases, users in two experiment groups have meaningfully different average behaviors before the experiment applies any intervention. If this difference persists after the experiment starts, the analysis may attribute that pre-existing difference to the intervention. CUPED helps address this bias but can't fully account for it. Learn more.
Outlier Check In some cases, a few outliers can materially influence metrics. This check alerts you so you can evaluate whether tools like Winsorization or Capping are appropriate. It also verifies that capping isn't unduly influencing results if already applied.
Was this helpful?