Dimension Analysis
A powerful way to understand who or what is causing a metric movement, dimension analysis lets you break down an experiment result by unit or action.
Dimension analysis breaks down an experiment result by unit or action so you can see who or what drives a metric movement. Statsig groups results either by unit-level attributes (unit dimensions) or by values within a metric (metric dimensions), so you can filter or split any Pulse result. To view the Pulse result breakdowns for all categories within a metric, select the (+) sign next to the metric.
You can also configure Differential Impact Detection to help Statsig automatically flag when different classes of users are responding differently to your experiments.Unit dimensions
Unit dimensions are unit-level attributes from one of three sources: the user object you log to Statsig, your assignment data, or an Entity Property. Examples of these attributes are operating system, country, region, or user segments.Using explore queries, you can filter to specific unit dimensions or group results by a dimension. For example, you can view results for users in the US, or view results for users on iOS grouped by their country.Statsig chooses the dimension based on the last available record at or before exposure. Statsig doesn't use information from after the unit is exposed to a given experiment in the experiment analysis. Using post-exposure data can lead to data leakage and imbalanced comparisons.
Metric dimensions
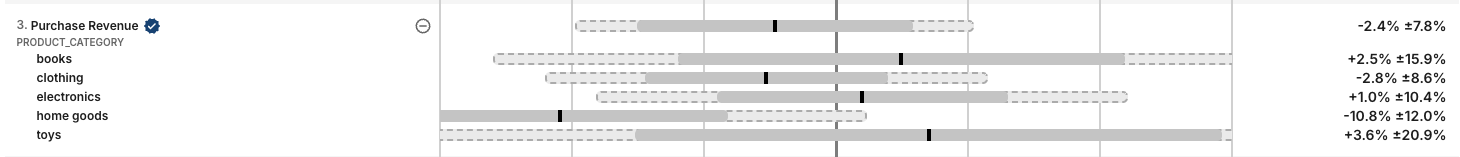
Metric dimensions break down a metric's results based on the values in columns from your metric source for a given metric. You configure these breakdowns per-metric, after which Statsig calculates them for that metric across all pulse results.Unlike Unit Dimensions, Metric Dimensions aren't mutually exclusive. For example, with a unit dimension, a user can only be from one country for the purpose of pulse analysis. But with a metric dimension, a user on an e-commerce website could buy "clothes", "books", and "snacks" within a "total purchases" metric. That user contributes to each of those dimensions as well as the overall value.
Default behavior
By default, dimensional analysis:
- only considers dimensions with at least 100 units in the experiment that participated (had a non-zero value).
- chooses the top 10 dimensions by total value, and puts all others into an "OTHER" bucket.
These defaults serve three purposes:
- prevent extreme results
- avoid cases where centrality assumptions fail due to low sample sizes on a specific dimension
- limit excessive multiple comparisons on the tail end of dimensional breakdowns
These defaults are configurable. Contact Statsig support to evaluate whether your use case warrants a change.
Precomputed dimension loading timing
For precomputed user dimensions that you configure and run on a schedule, Statsig processes dimension data asynchronously. The dimension data may take a few minutes to become available after the main experiment results load. You may temporarily see "No dimensions available for this time range" messages while Statsig processes the data, especially after the first reload of the day. This delay is expected. Wait a few minutes and refresh the page to see the dimensional breakdowns.
This timing behavior only affects precomputed user dimensions. User-triggered dimensional analysis doesn't experience this delay.
Was this helpful?