Warehouse Costs
How you can manage costs with statsig
Statsig Warehouse Native runs experiment analyses and analytics queries on the compute and storage you provide, which adds to your warehouse bill. This page explains how to estimate total cost of ownership, benchmark it against typical usage, and keep it under control.
There is some overlap with the best practices page; treat that page as an implementation guide and this page as a high-level overview.Why do costs matter?
Warehouse Native platforms require you to provide compute and storage to run data jobs like experiment analyses and analytics queries. This requirement is a cost center, and can meaningfully drive up your warehouse bill if queries are unoptimized or poorly integrated with your databases.
Cost is a major concern for many customers considering a Warehouse Native solution for Experimentation or Analytics. Warehouse Native platforms are very flexible, but that flexibility can lead to unexpected data costs. Understanding total cost of ownership is important when evaluating a platform, as many platforms don't treat it as a primary focus.
Statsig started as a cloud-only platform with a strong focus on cost efficiency. By continuously optimizing pipelines on the cloud side of its business, Statsig has developed expertise in cost-saving strategies that it passes on to Warehouse Native customers.
Benchmarks
Total cost of ownership
Warehouse costs typically hover between 5% and 20% of customers' platform spend with Statsig. There are exceptions depending on usage, but these tend to be on the low end. To avoid selective reporting, the examples below are an anonymized list of the top 5 Statsig Warehouse Native customers on Snowflake, by total warehouse spend:
| Company Profile | Experiments Run, 12 Months | Estimated % Contract Value Spent on Compute |
|---|---|---|
| Multi-sided marketplace (e.g. job search / contracts), 100M-1B in Revenue | 120 | 12% |
| Multinational B2C business, 5B-20B in revenue | 210 | 9% |
| B2B SaaS, 100M-1B in Revenue | 250 | 11% |
| Online Entertainment, 100M-1B in Revenue | 180 | 6% |
| Online Services, 50-100M in Revenue | 130 | 20% |
These figures are fairly representative of what you can expect using Statsig at scale with reasonable adherence to best practices. Costs do scale with number of experiments; companies running fewer experiments generally see a smaller relative TCO.
Relative to experiment size, there is significant variation in spend depending on how many metrics you use, what kind of metrics, and how "dense" your metrics are. The table below shows typical costs when teams follow best practices:
| Experiment Size | Cost per Experiment Load | Lifetime Cost per Experiment (4 Weeks with Daily Refreshes & Drilldowns) | Lifetime Cost Using Turbo Mode |
|---|---|---|---|
| Small (50k or less units) | < $0.05 | $0.25 - $2.00 | $0.25 - $1.00 |
| Medium | < $0.25 | $1.00 - $10.00 | $1.00 - $5.00 |
| Large | $0.25 - $10.00 | $5.00 - $280.00 | $3.00 - $50.00 |
| Extremely Large (500 Million+ experimental units) | Low Sample with only a handful of companies - Can't Generalize | " | " |
Industry
Statsig aims to be best-in-class for Warehouse Native experimentation costs. Customers who evaluate multiple vendors consistently report that Statsig is 50-66% of the cost of other platforms.
In cases where Statsig has been more expensive than competitors, the team investigates quickly. For example, a recent customer accidentally used un-partitioned data for their Statsig proof of concept. This unpartitioned data drove up cost relative to another vendor whose tables were partitioned. Statsig followed up by building warnings when source data isn't partitioned. After partitioning, cost went from 120% of the other vendor's cost to under 60%.
Multiple customers have migrated to Statsig from other Warehouse Native Experimentation platforms due to cost concerns. Reach out to the Sales team to run an evaluation of relative costs. If you have concerns, or another party claims their solution is more efficient, contact Statsig to discuss.
Tools for understanding cost
Statsig aims to be as transparent as possible about costs. Numerous tools throughout the product help in this regard:
History
In every loaded experiment or gate, you can quickly see the cost of each load. The metrics shown are relevant to your warehouse, for example, slot hours or bytes scanned for BigQuery, uptime for Snowflake, and so on.
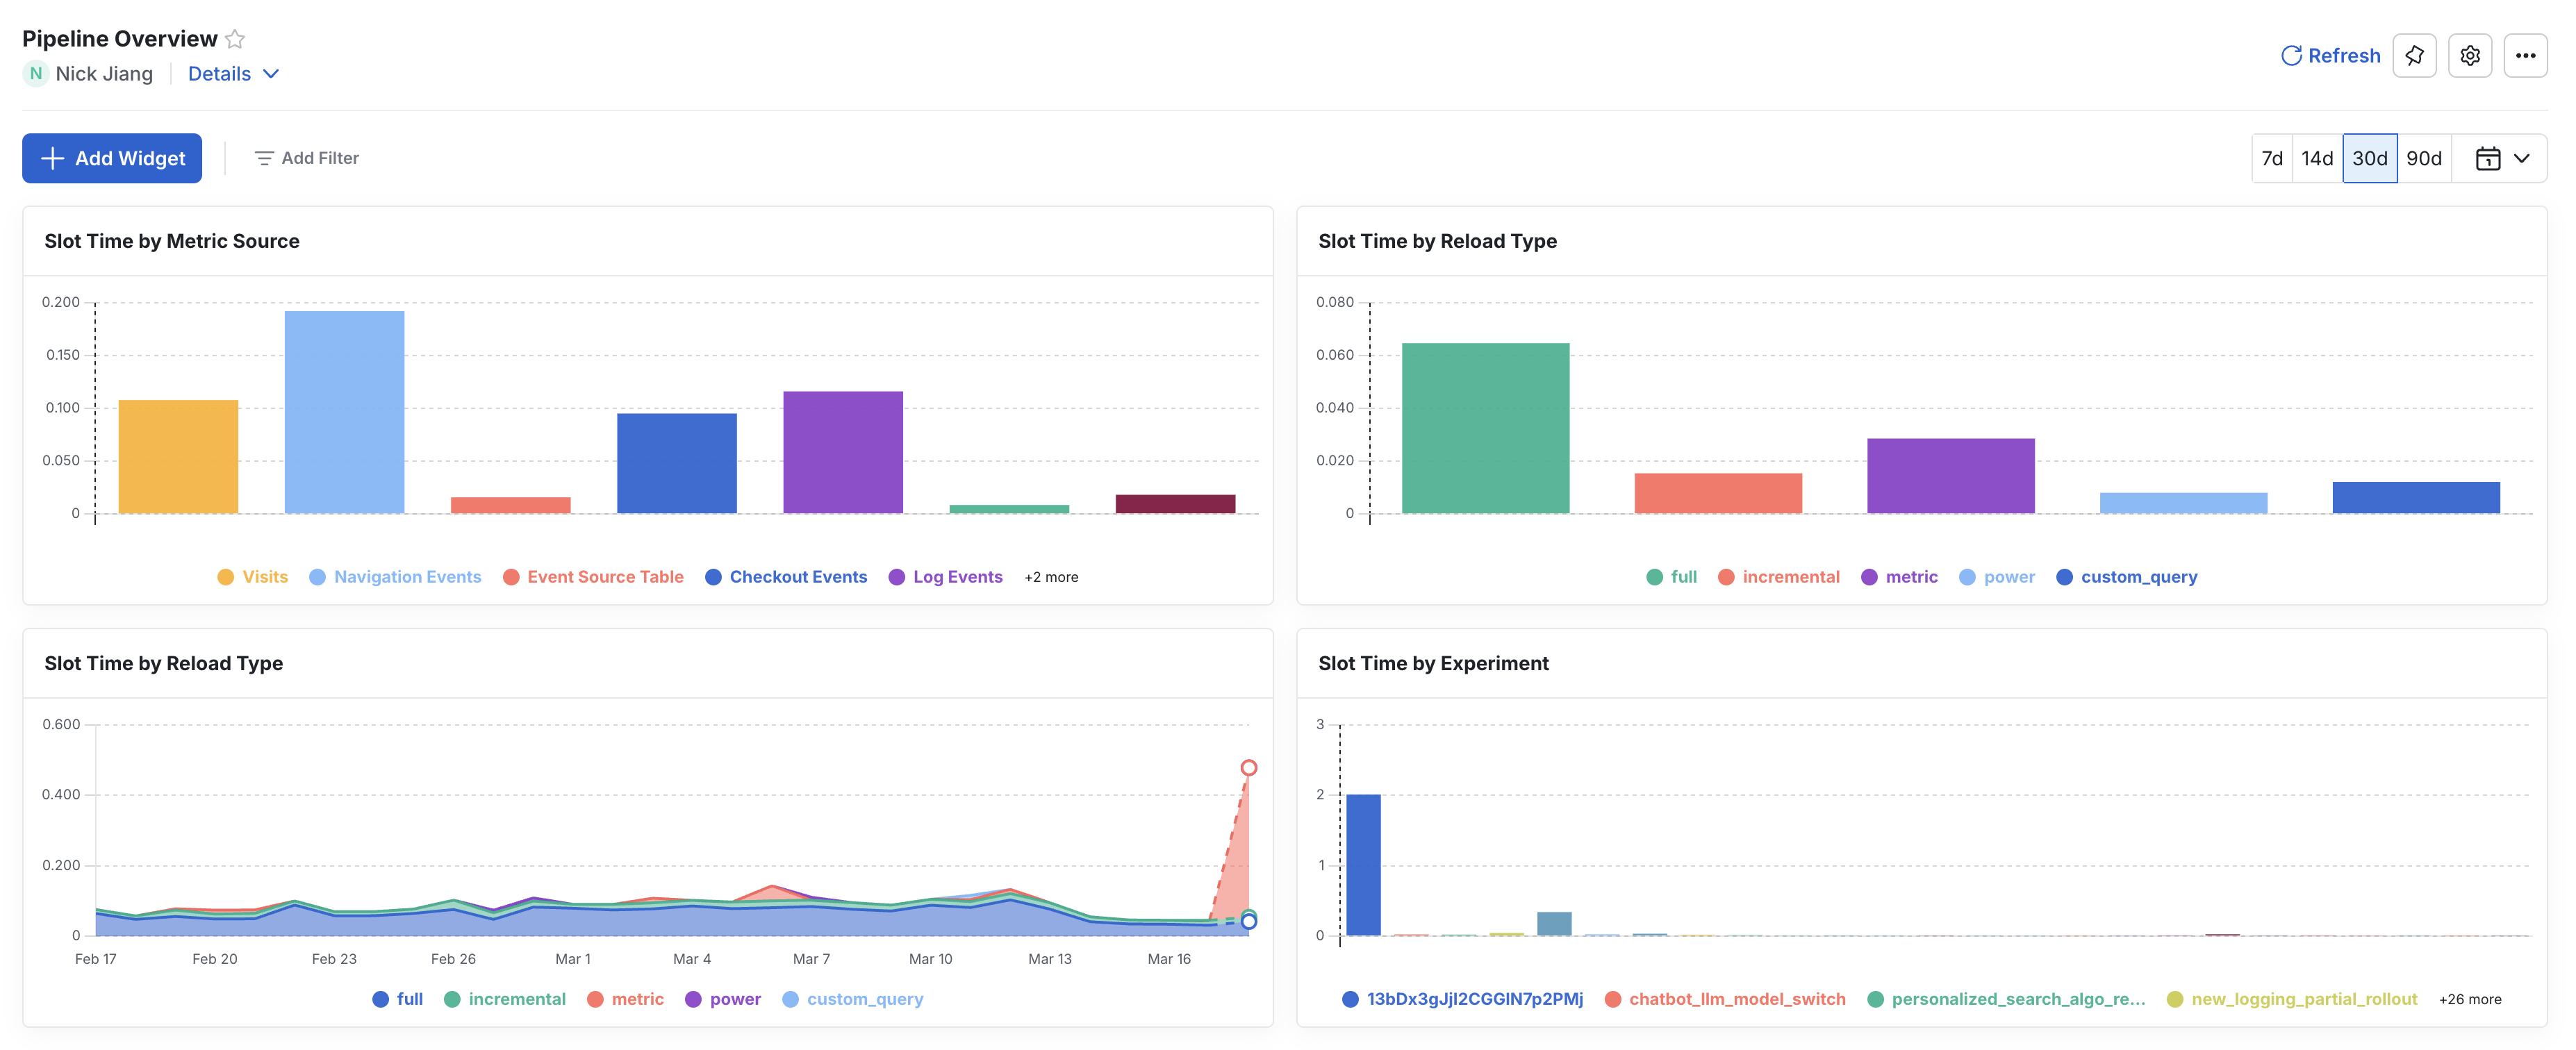
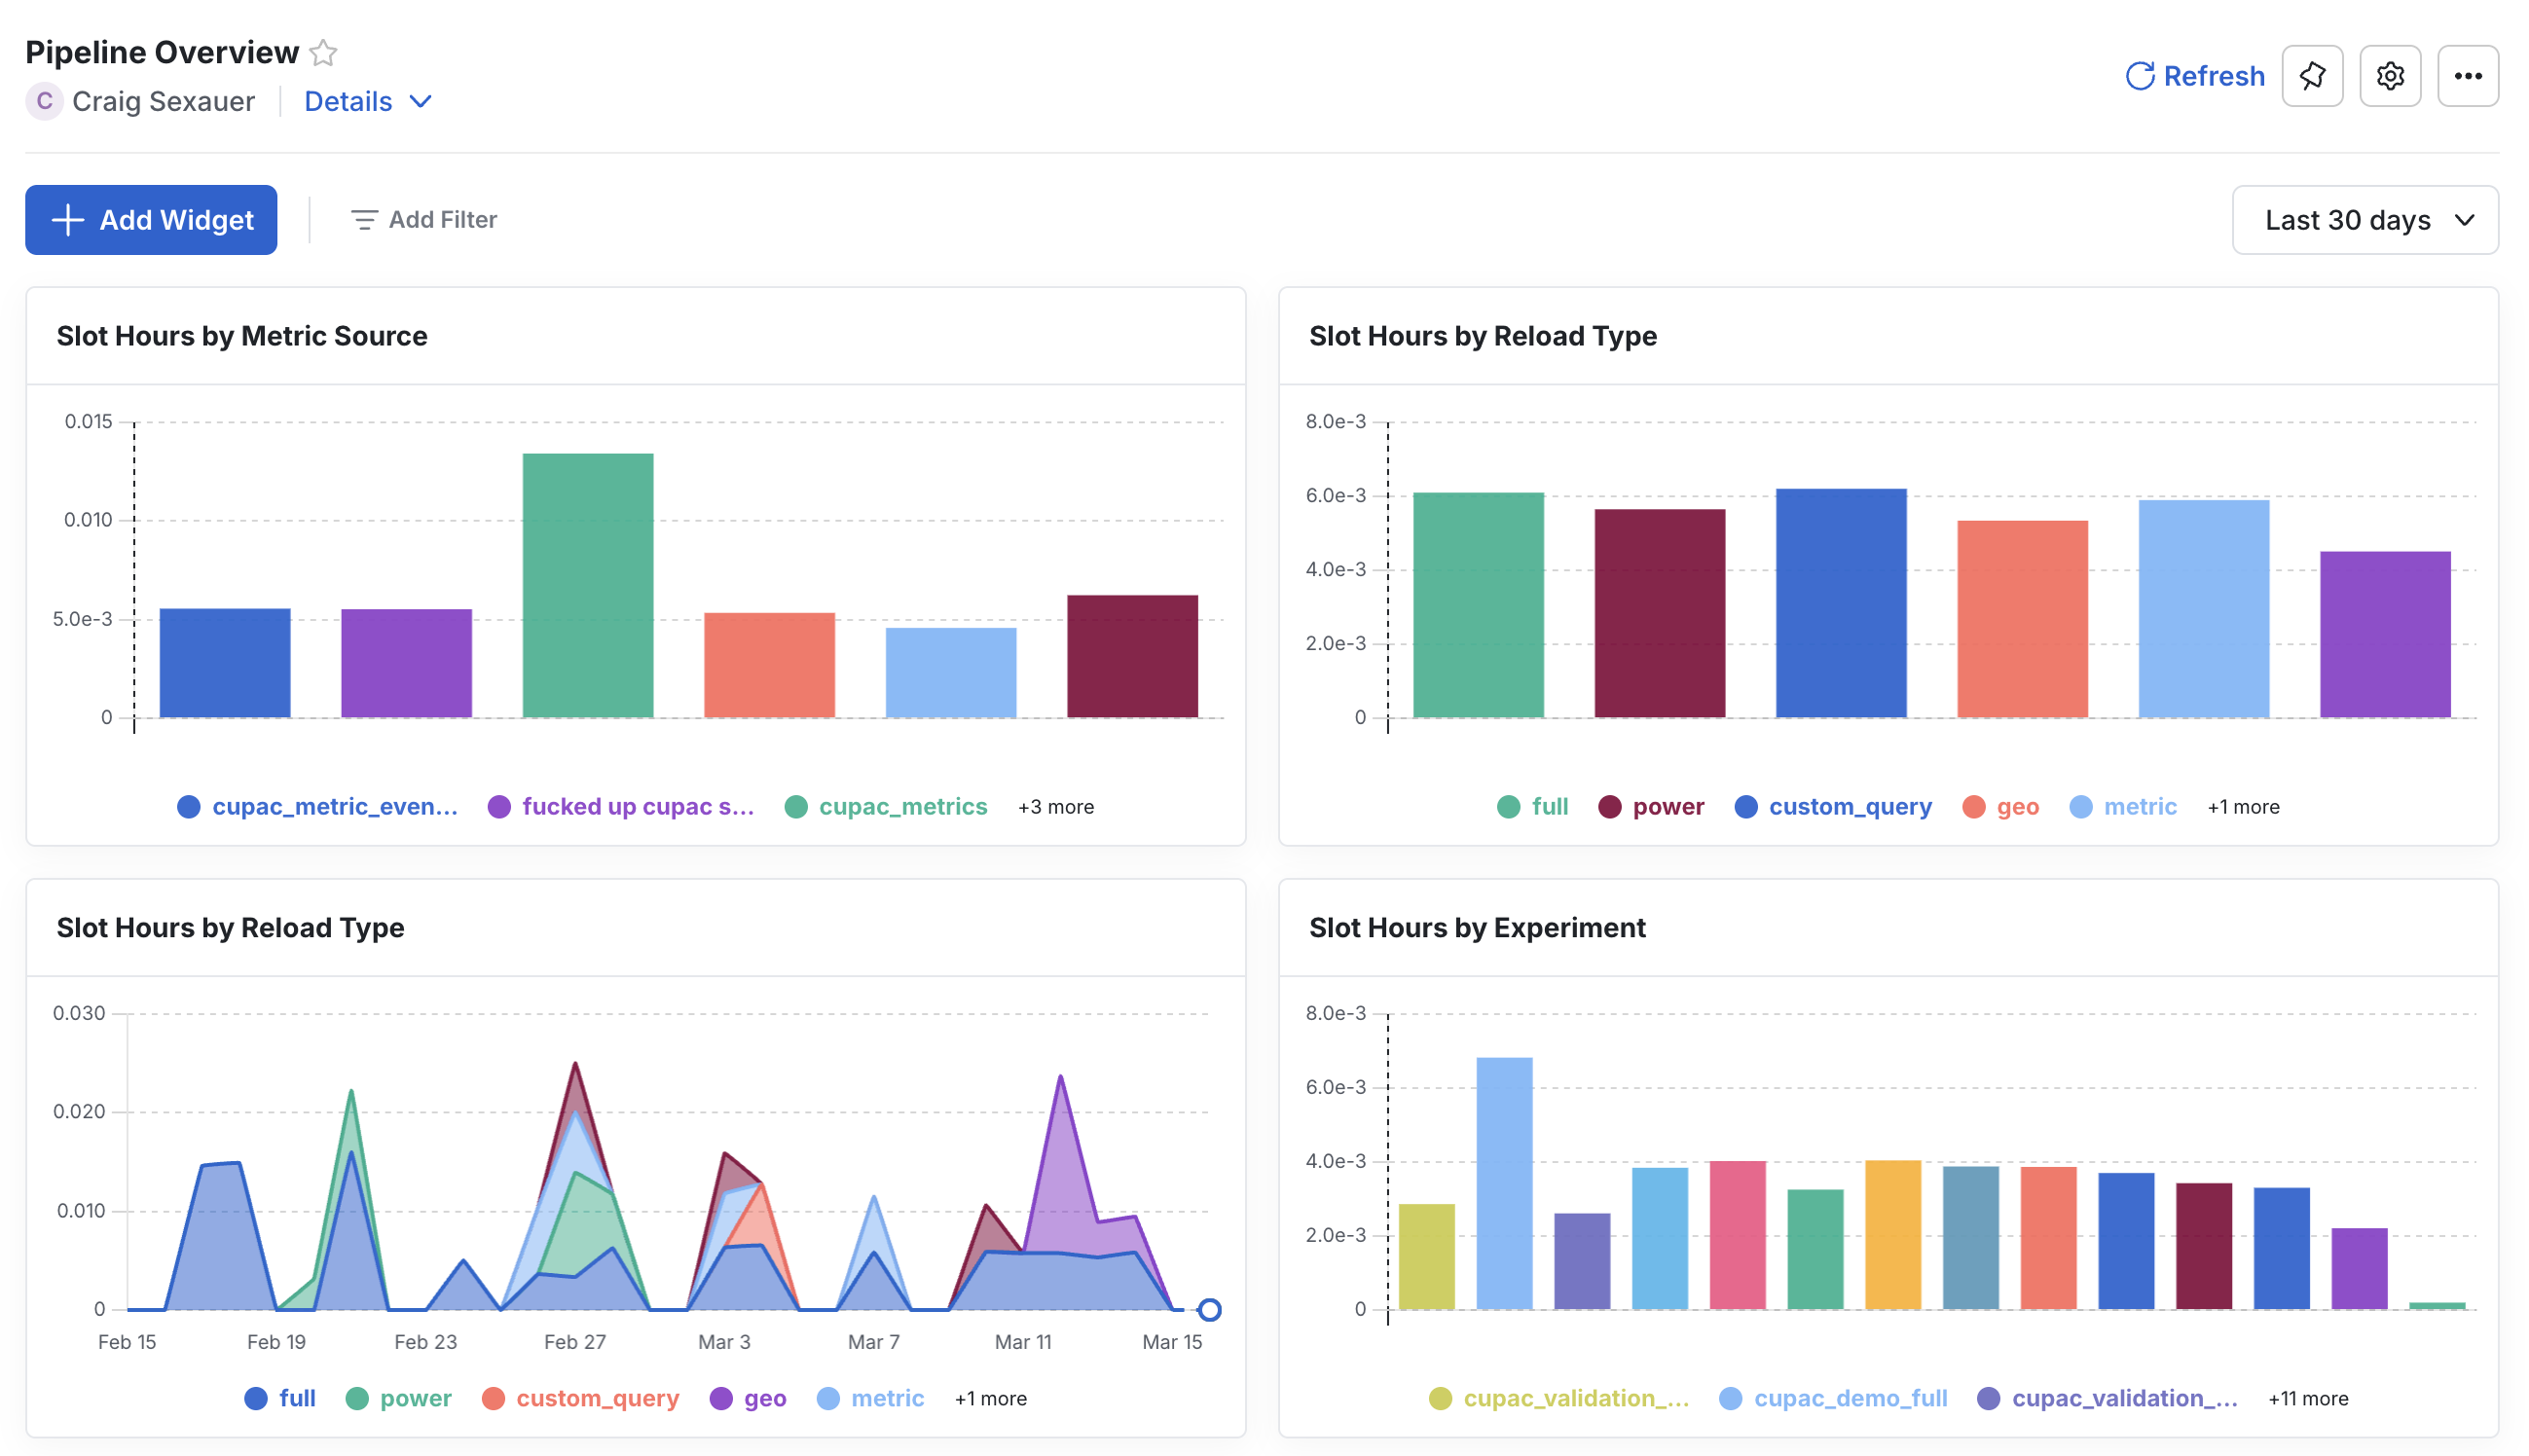
Pipeline overview dashboard
Statsig automatically creates a Pipeline Overview dashboard in its MEx platform. Statsig writes the underlying data to your warehouse, so you can investigate what is driving costs from Statsig. Many customers have built their own monitoring and alerting on top of this dataset and notify Statsig if they see any changes in cost.
Vendor tooling
Use standalone compute and storage resources for Statsig in your warehouse. This makes total cost of ownership easy to understand. Some cost information isn't visible to the platform without administrator rights on your warehouse.
If there is a mismatch between Statsig's dashboard and your costs, reach out to support. Statsig takes this seriously and works to resolve the gap.
Tools for managing cost
Follow UI hints
Statsig proactively flags to you if:
- A data source is particularly slow.
- A metric source is malformed (e.g. a view definition which is broken within your warehouse).
- A data source isn't following best practices.
Paying attention to these and flagging them quickly prevents wasted compute. In most cases where PoC customers had performance issues, the causes were unpartitioned temp tables for the PoC, or not using macros to filter tables with extremely long data retention.
Access controls
For large organizations, poorly optimized source tables or using the wrong source when pulling data cause most cost issues.
Statsig offers access controls so that:
- Your data team can control data sources and ensure they are well-behaved.
- The console clearly indicates verified sources for end users.
Following best practices
The best practices cover most situations that lead to high warehouse costs on Statsig. In short, you should aim to:- Cluster or partition source tables.
- Use Statsig date macros to guarantee filter push-down.
- Use Statsig's Turbo Mode to reduce redundant compute, especially for large or long experiments.
Was this helpful?