Metric Examples
Example metric definitions in Statsig Warehouse Native, including SQL snippets and metric source mappings for common product, revenue, and engagement metrics.
Statsig Warehouse Native supports common metric types including revenue, account value, participation, funnel, and retention metrics. These examples show the SQL and metric-source setup for each type and explain how Statsig calculates them in experiments. Use them as templates when you set up your own metrics against your warehouse tables.
If you're transitioning from another warehouse-native vendor, the metric format is similar. Customers have generally been able to use APIs to fetch remote configurations, translate them, and post them to Statsig without issue. If you're migrating from an in-house system, there may be differences between how you define experiment metrics internally and how Statsig handles them.
Average user revenue from a wide table
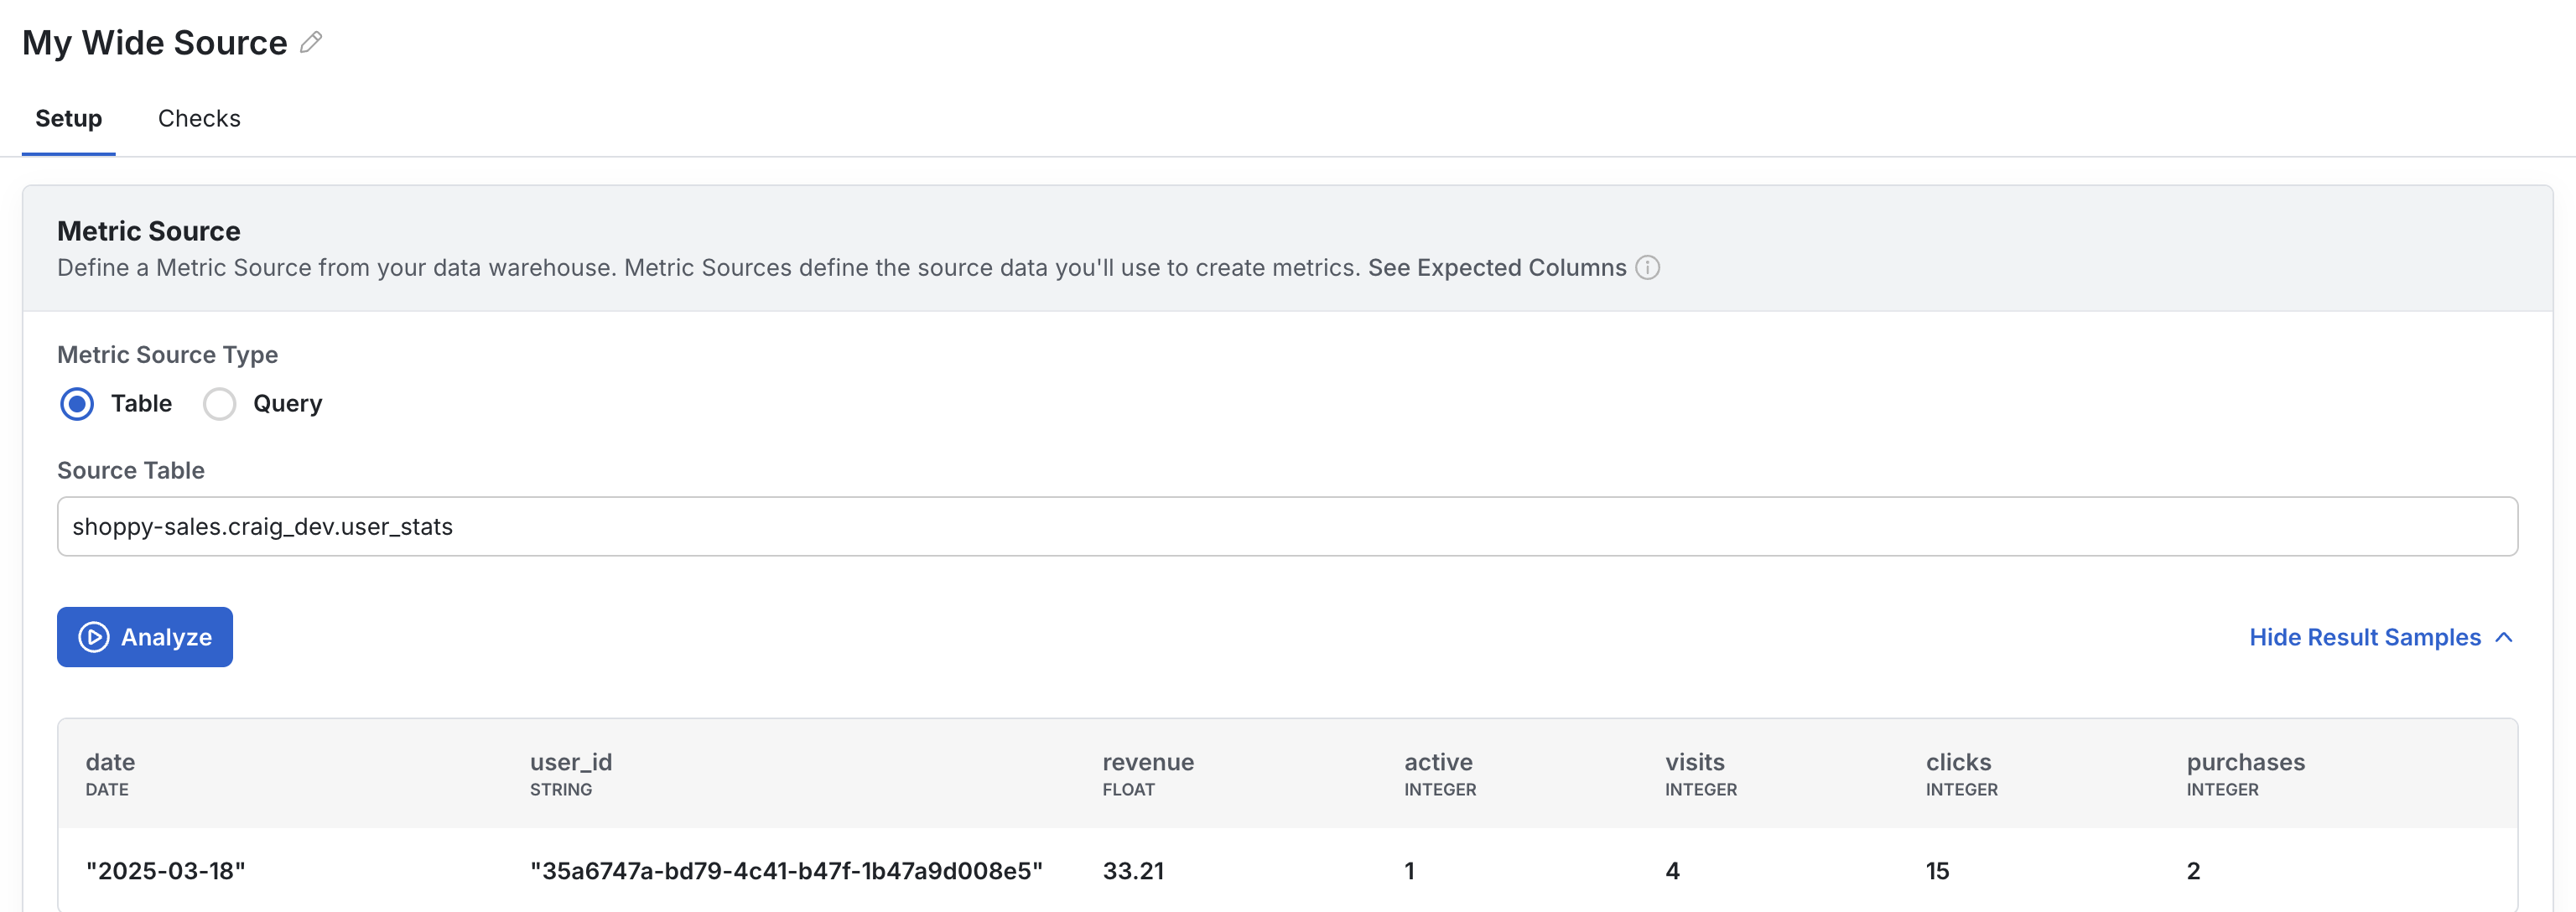
In many cases, companies have a primary source-of-truth table about user engagement with one row per user-day and many columns representing actions taken or other values. This table type integrates directly with Statsig.
First, enter the table path and optionally a partition column to use for date partitioning:
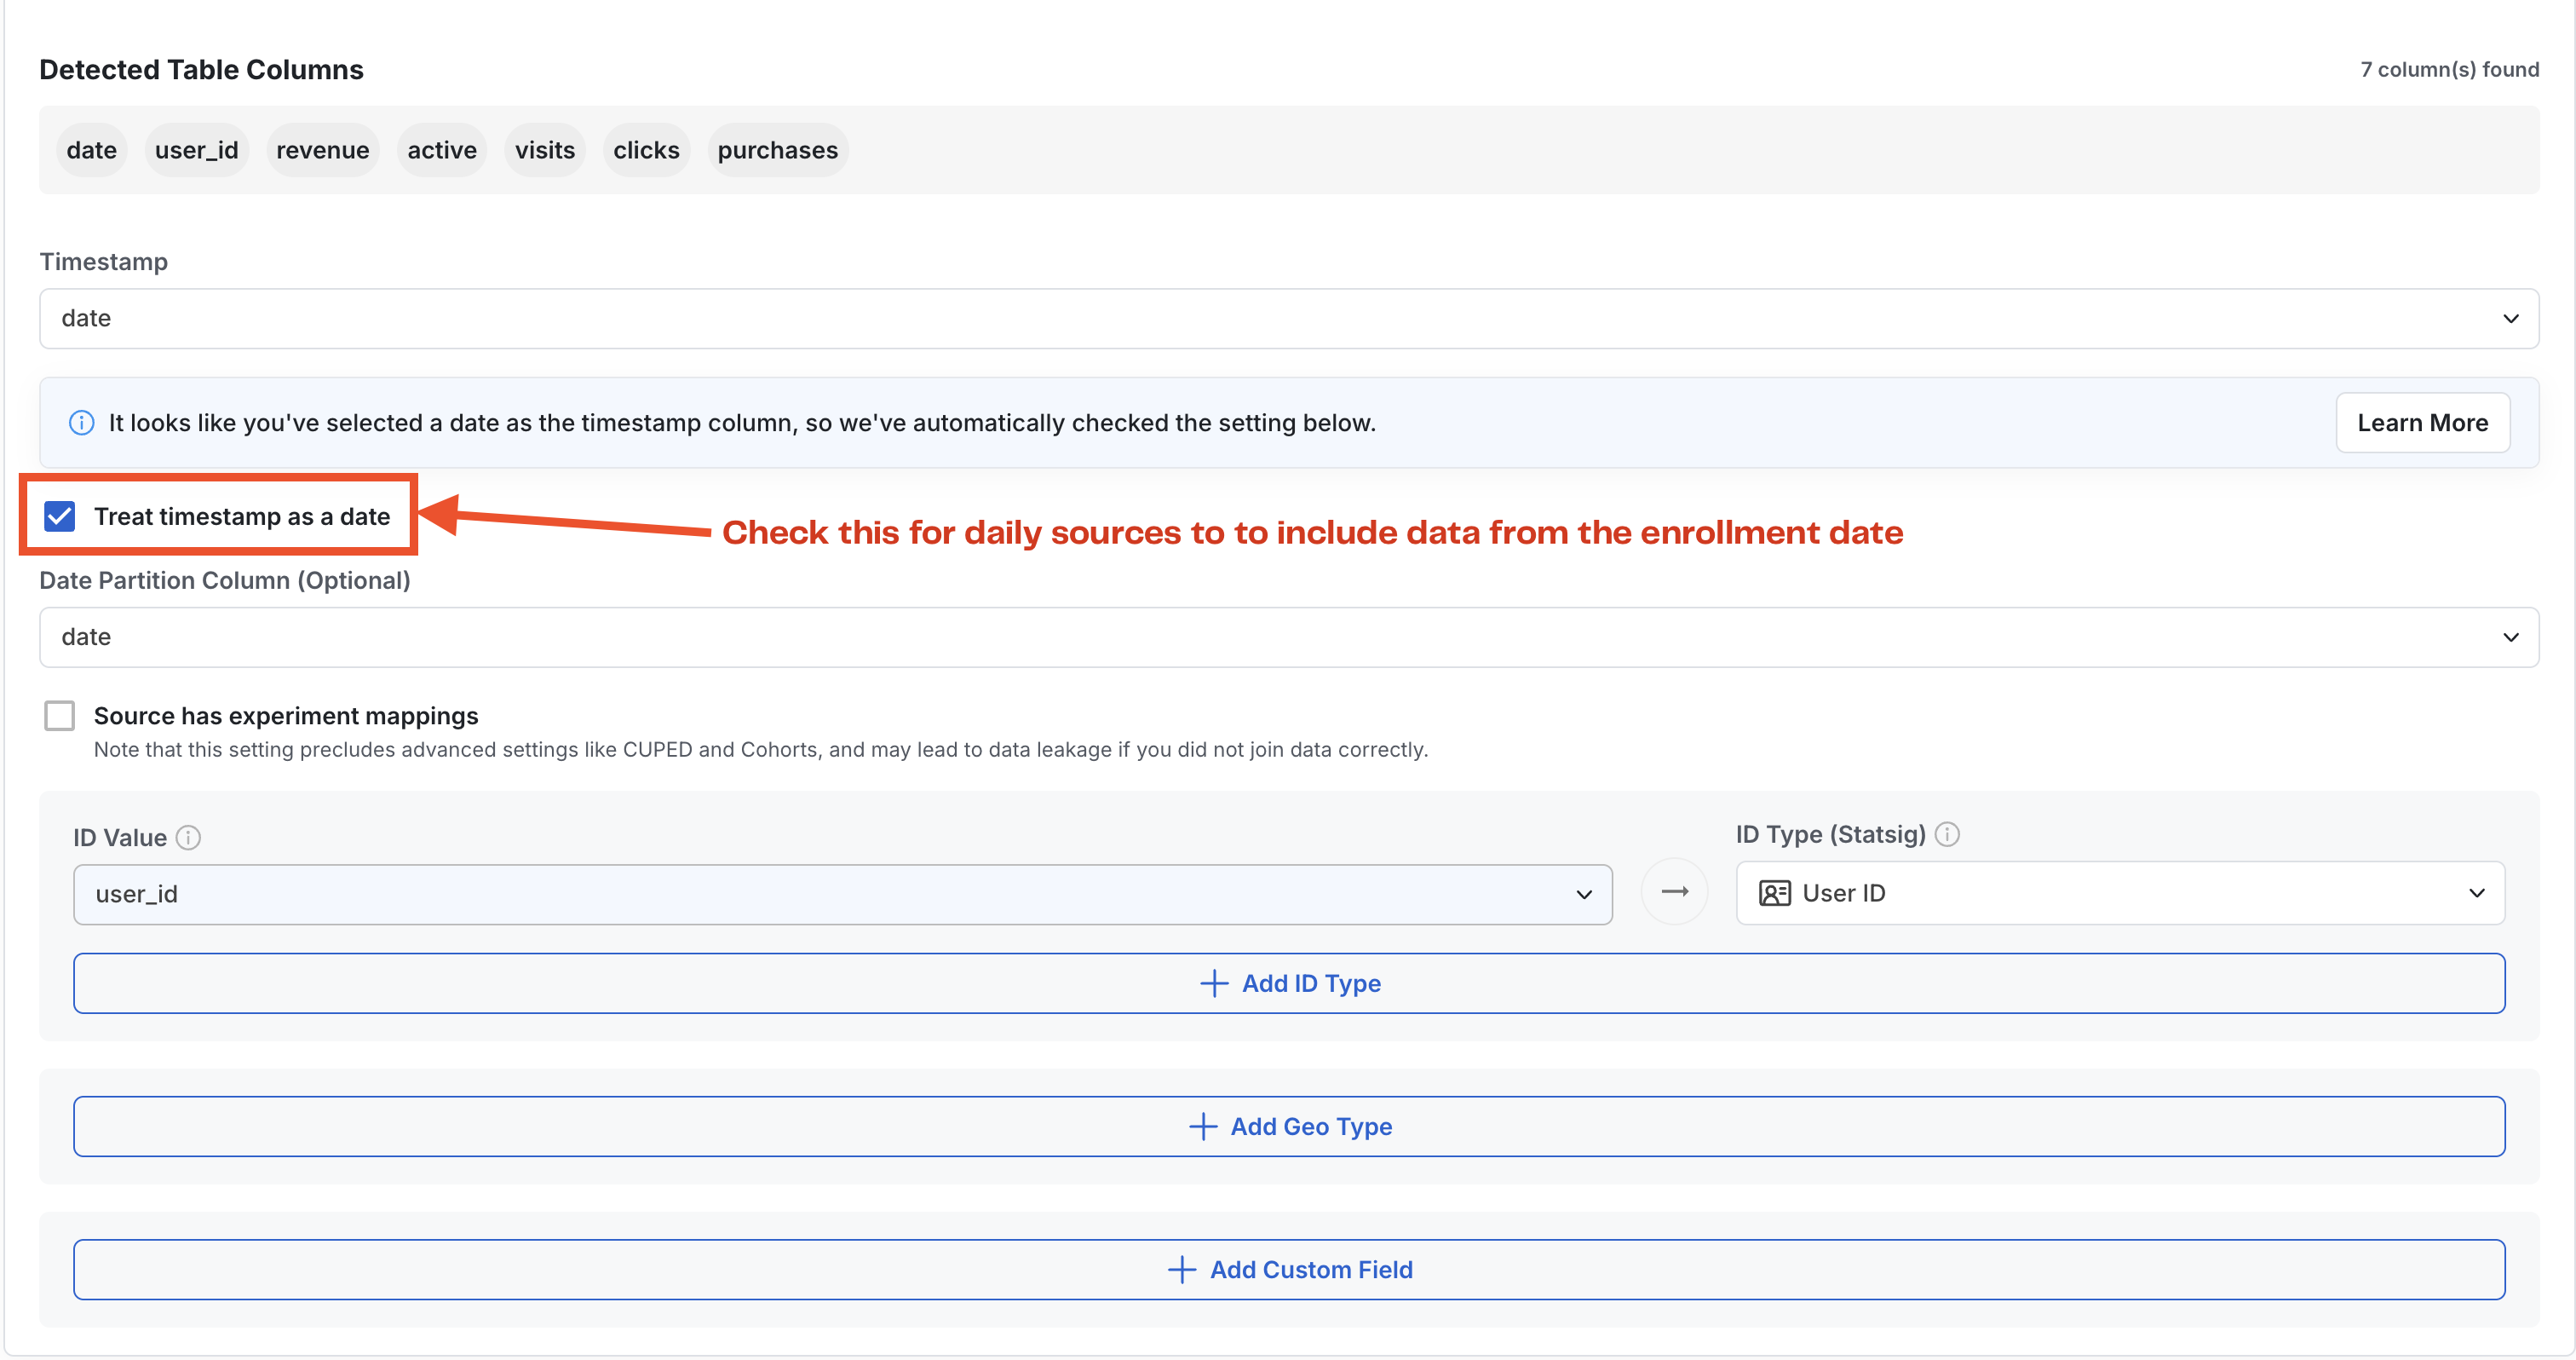
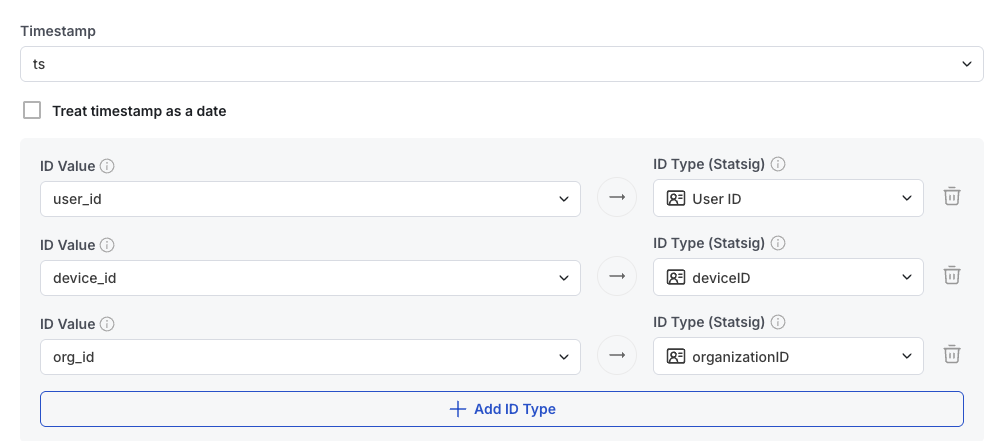
Then, configure your timestamp field and ID types. Add any custom SQL aliases, for example, dividing revenue by 100 to convert from cents to dollars.
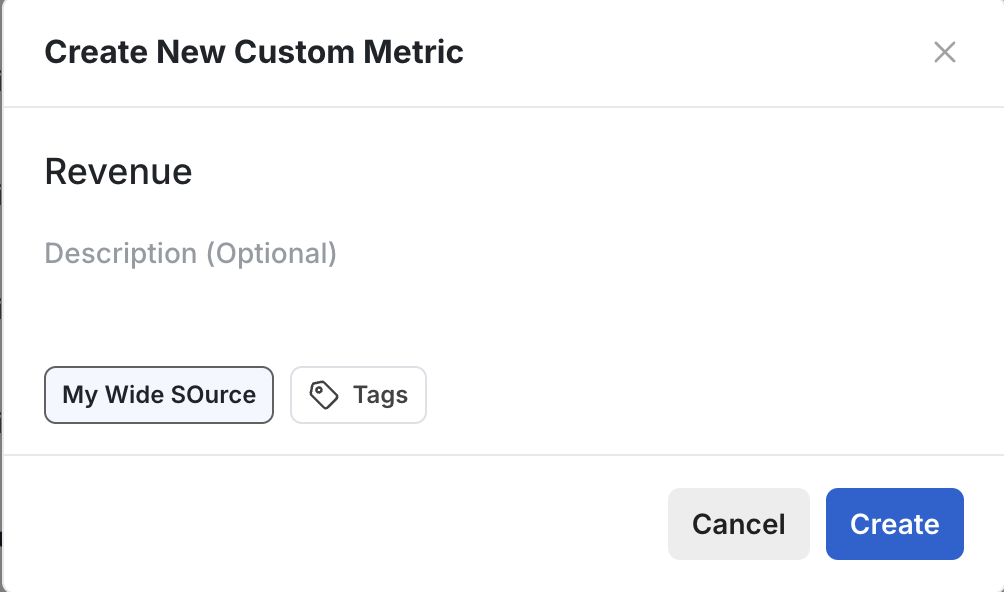
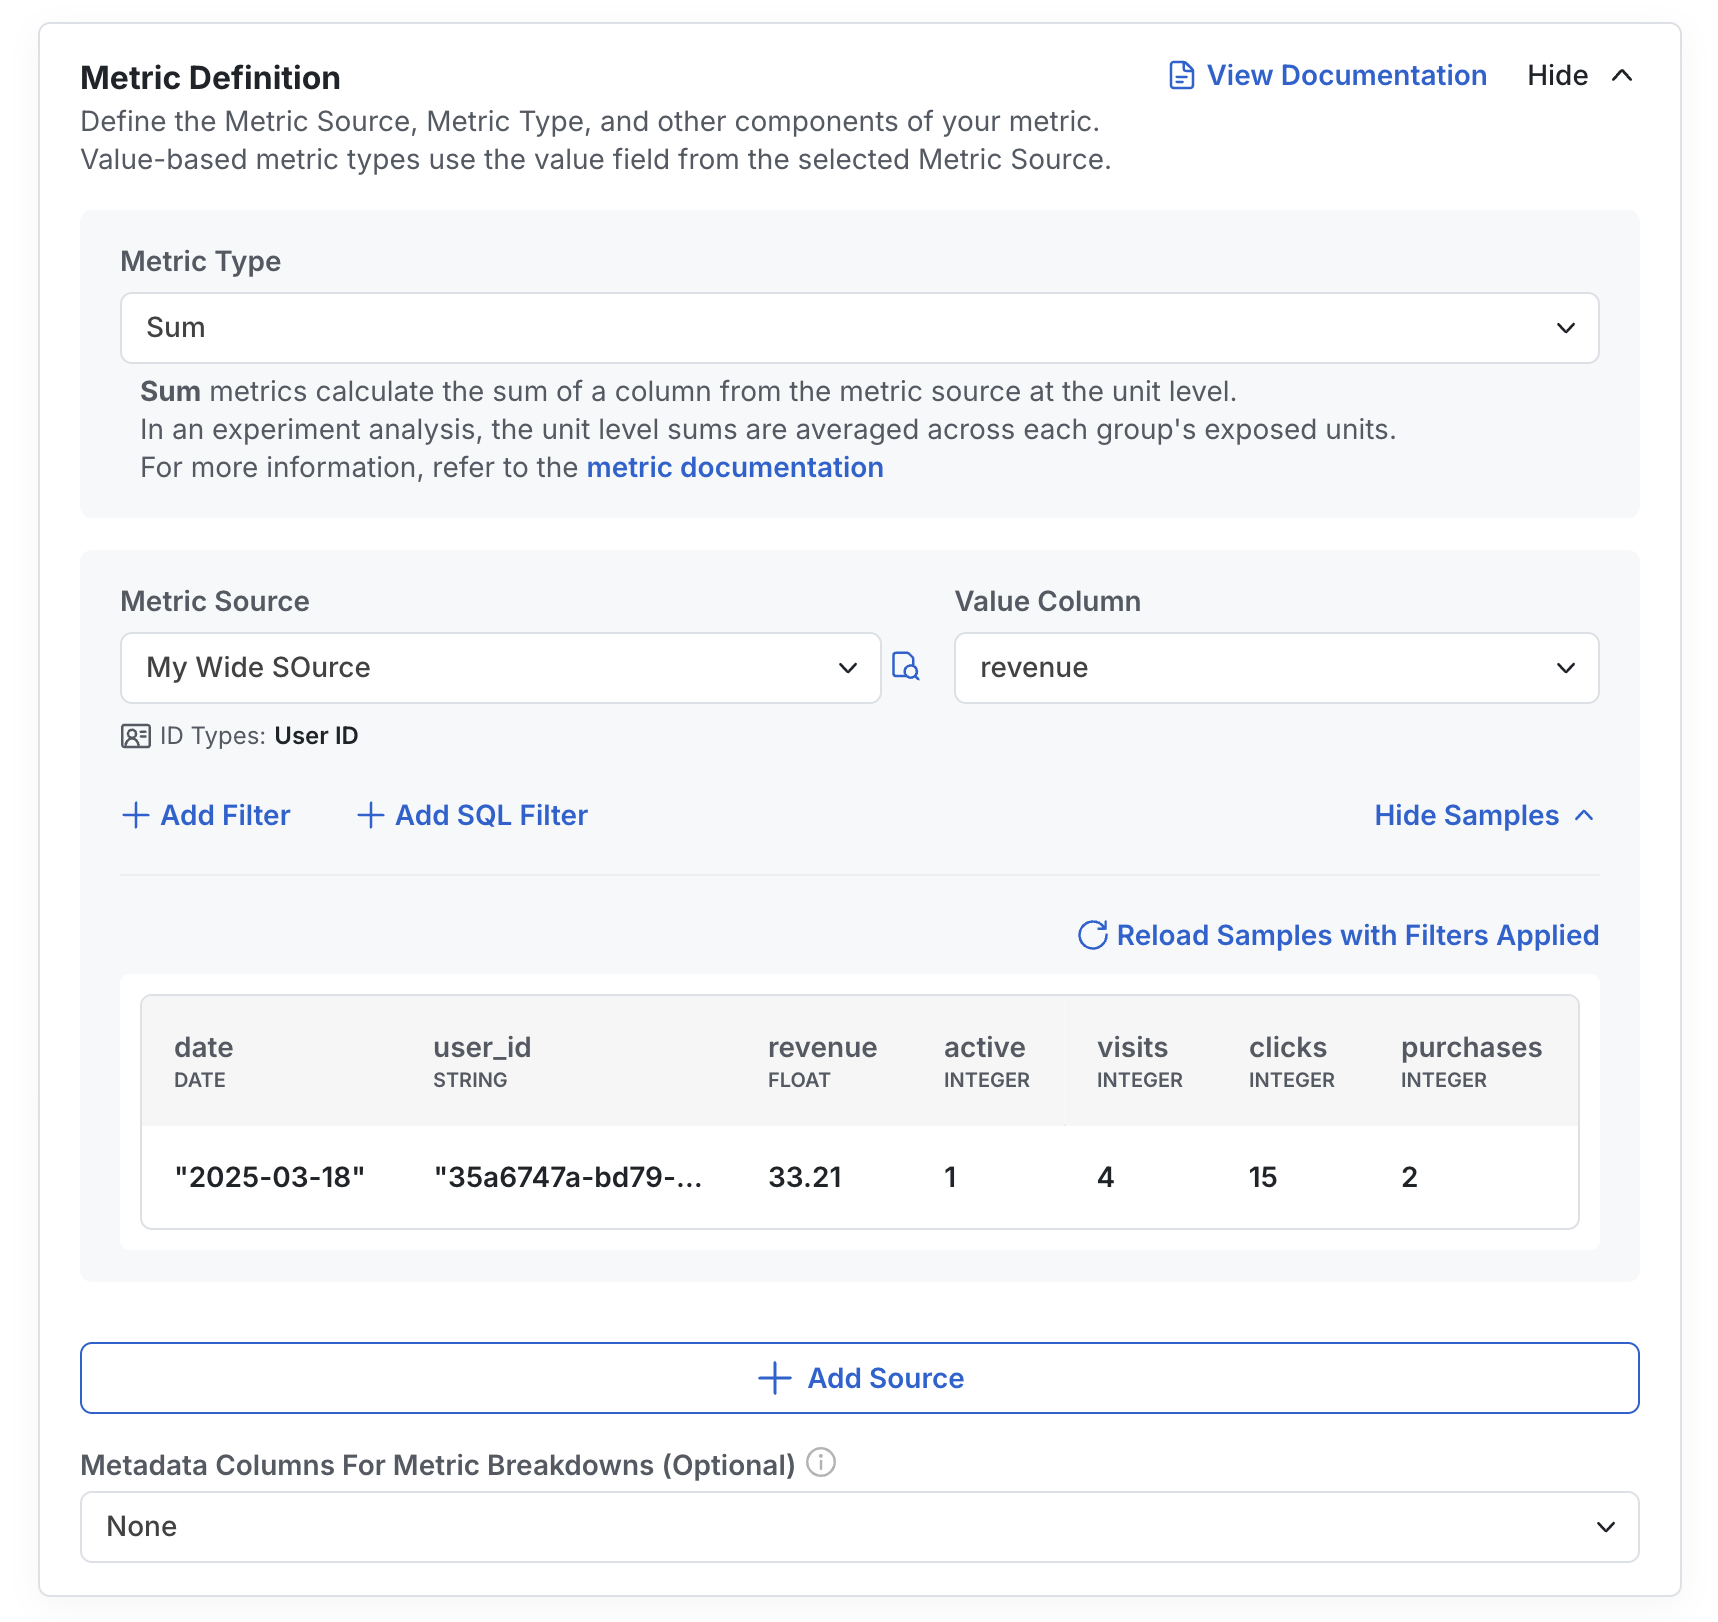
Go to the metrics tab, press create, configure your name/source, and then configure a sum metric on the column with the revenue value.
How it works in experiments
First, Statsig aggregates each unit-level record across the days they are enrolled in the experiment.
Then, Statsig calculates the mean unit-level revenue per experiment group, imputing 0s for all exposed users with no revenue.
Statsig provides a description of this in-product for any user who wants to learn more:
Average current account value
Often, you want to understand if your experiment has altered the state of users. For example, you may want to know whether users in test vs. control have grown their account value.
To measure this, provide a table or query that tracks users' account values each day. Then, set up a metric source pointing to that table or query.
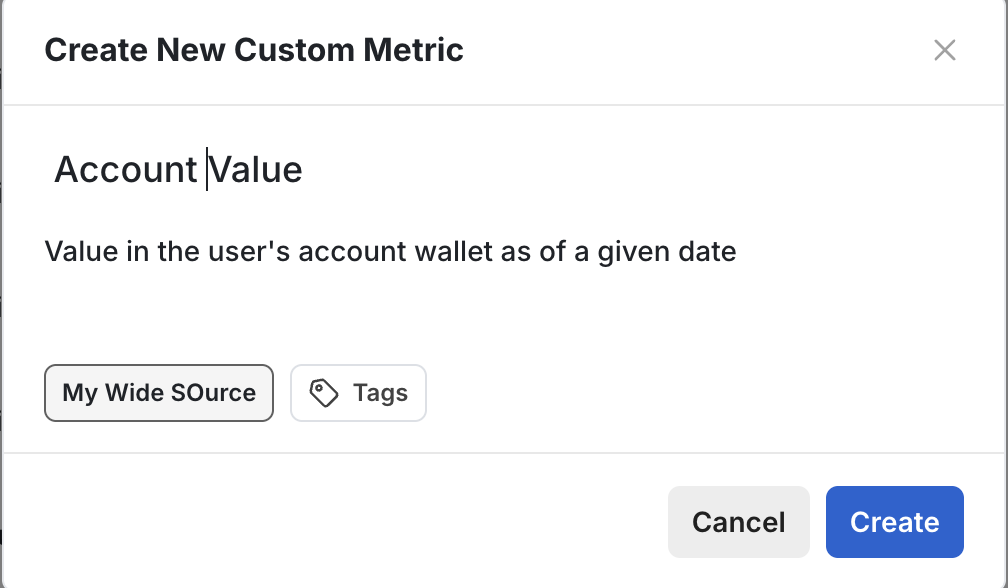
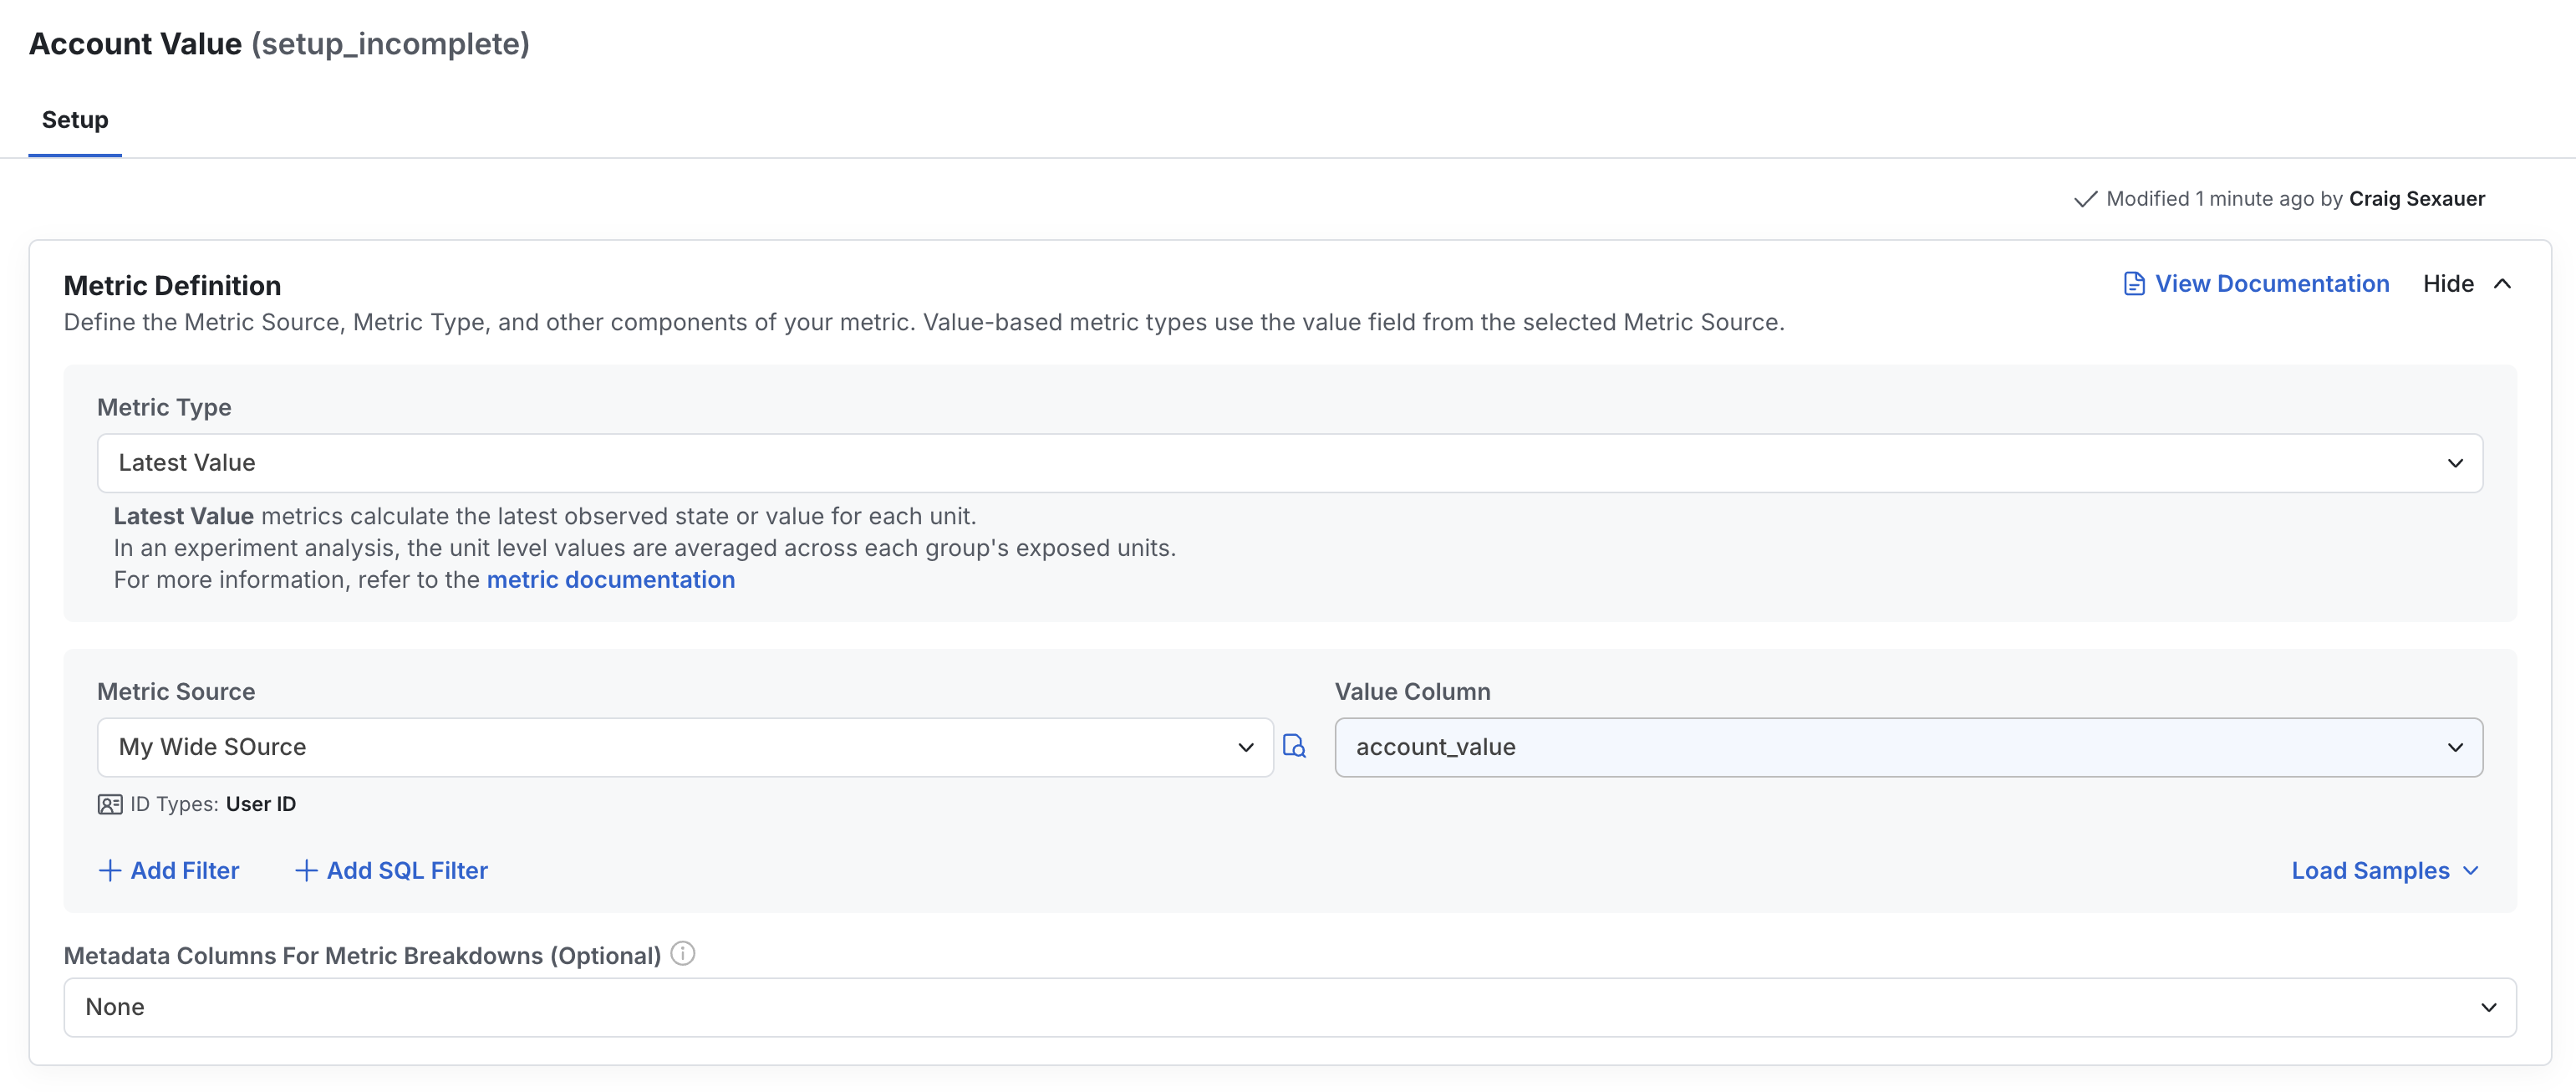
Go to the metrics tab, press create, configure your metric name & source, and then configure a latest value metric on the column with the account value.
How it works in experiments
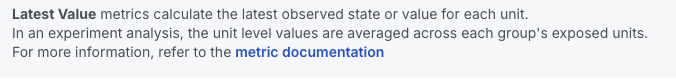
First, at unit level, Statsig calculates each day's latest non-null value within any cohort bounds and takes the latest value from the latest day available.
Then, Statsig calculates the mean unit-level value per experiment group on each day, imputing 0s for all exposed users with no value.
Statsig provides a description of this in-product for any user who wants to learn more:
Users' D7 participation rate
A common metric in experimentation is measuring whether exposed users take specific actions within a defined time window.
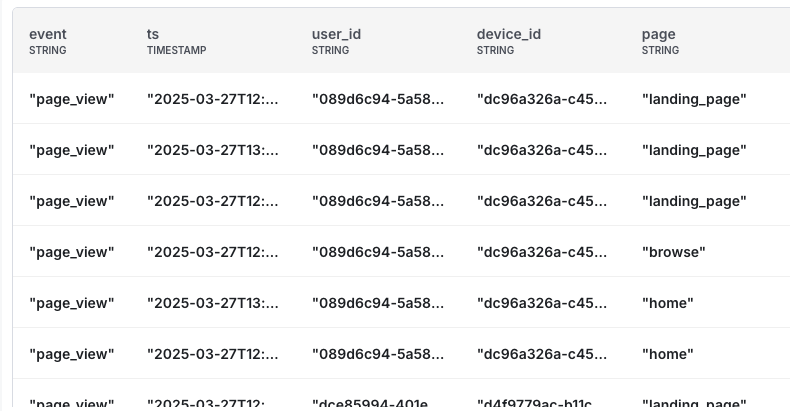
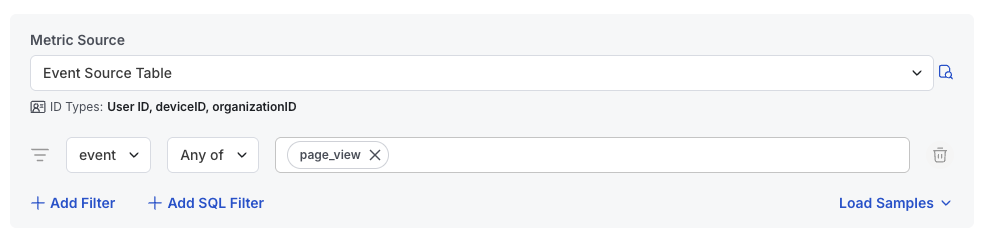
Provide an event table that records user actions with essential columns such as user_id, timestamp, and event type. Configure your timestamp field and ID types as the previous sections describe.
Navigate to the metric catalog and create a unit count metric using the defined metric source. Use the 'Add Filter' option to focus on specific events relevant to your metric.
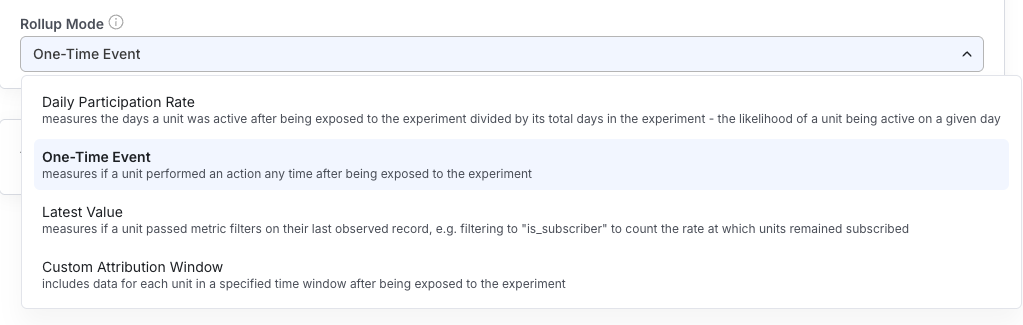
When defining the metric, you can choose from several rollup modes:
- Daily Participation Rate: measures the days a unit was active after exposure, divided by its total days in the experiment
- On-Time Event: measures whether a unit performed an action any time after exposure
- Latest Value: measures whether a unit passed metric filters on their last observed record
- Custom Attribution Window: includes data for each unit within a specified time window after exposure
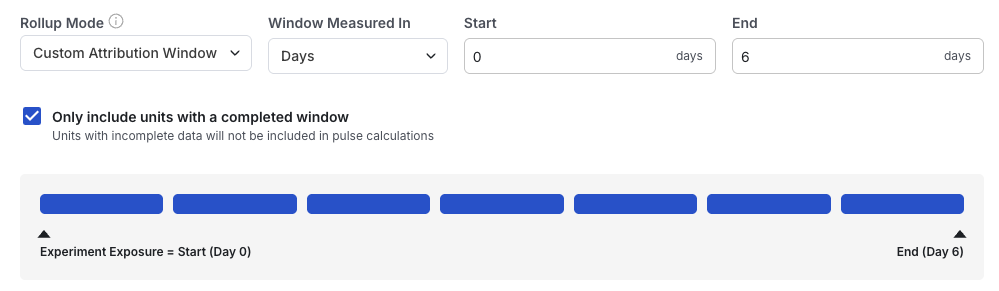
To measure user participation within 7 days, select 'Custom Attribution Window' as your rollup mode and set start = 0, end = 6 to define a 7-day window. Enable 'Only include units with a completed window' to exclude users who haven't yet reached the full 7-day period from your analysis.
How it works in experiments
First, at unit level, Statsig creates a 0/1 flag if the event triggers during the specified time window.
Then, at the group level, Statsig calculates the mean as the SUM of the unit-level flags, divided by the count of UNIQUE UNITS exposed to the experiment.
Refer to Unit Count (Window) Metrics for more details about how Statsig calculates these metrics.User funnel metric
A common analysis in experimentation is understanding how a new feature impacts dropoff rates at each step of a user funnel.
To create a funnel metric in Statsig, you need an event table that records each step of the events you want to track. The setup for your metric source follows the same process that previous sections describe.
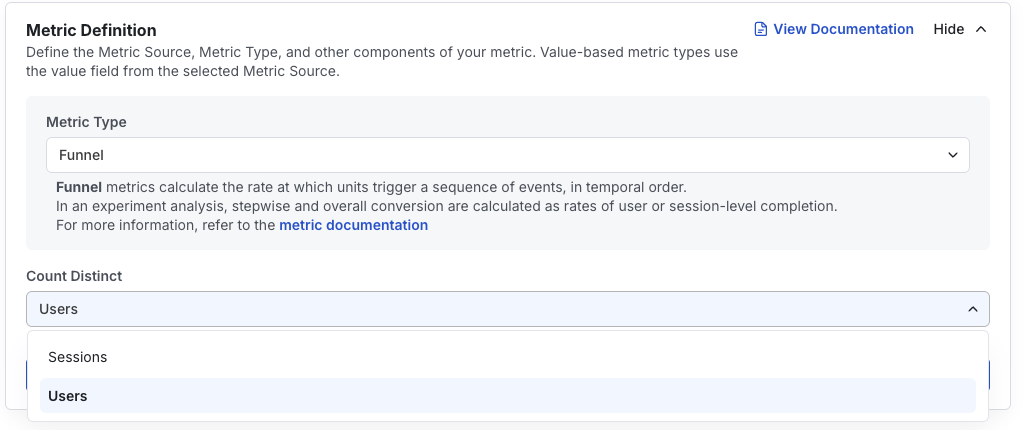
Navigate to the metric catalog, and select 'Funnel' as your metric type. Choose the unit level for your funnel steps: a distinct count of users or sessions, depending on what you want to measure.
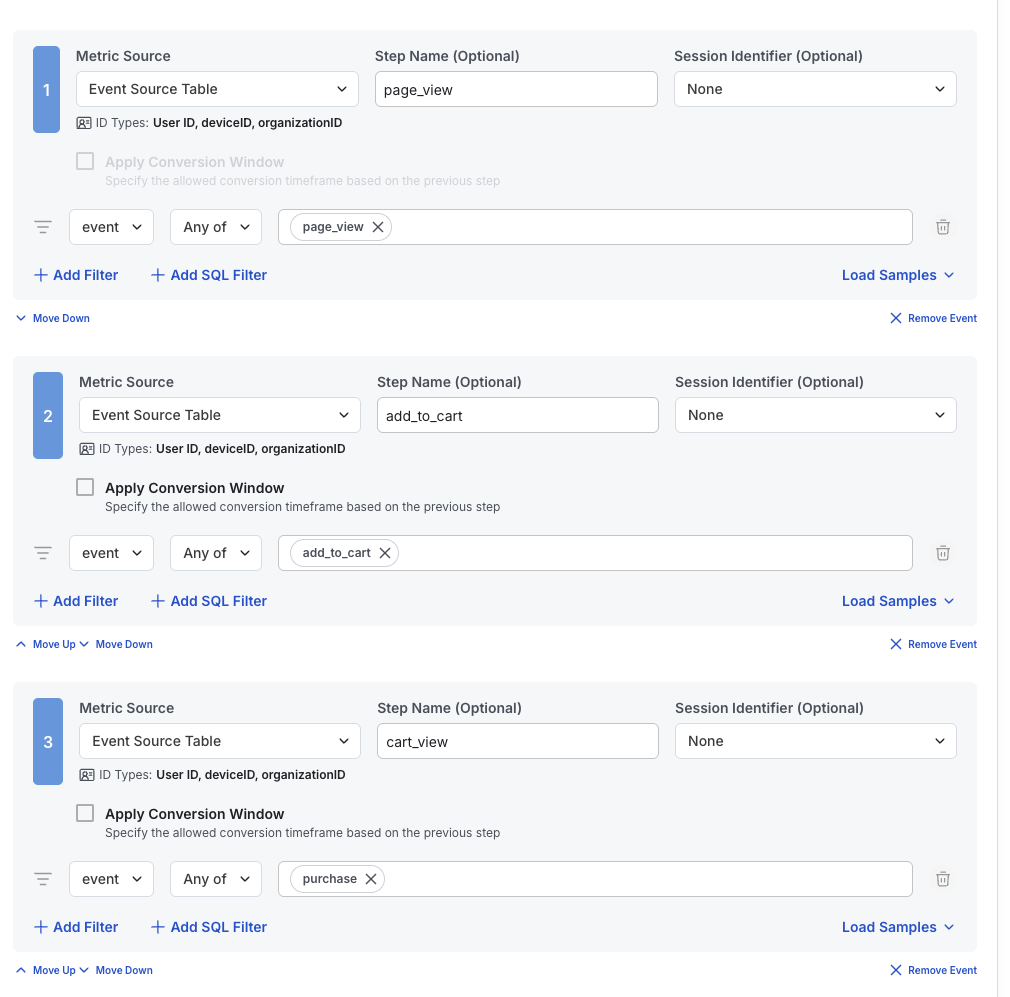
Then, define your funnel steps, specifying the sequence of events users go through.
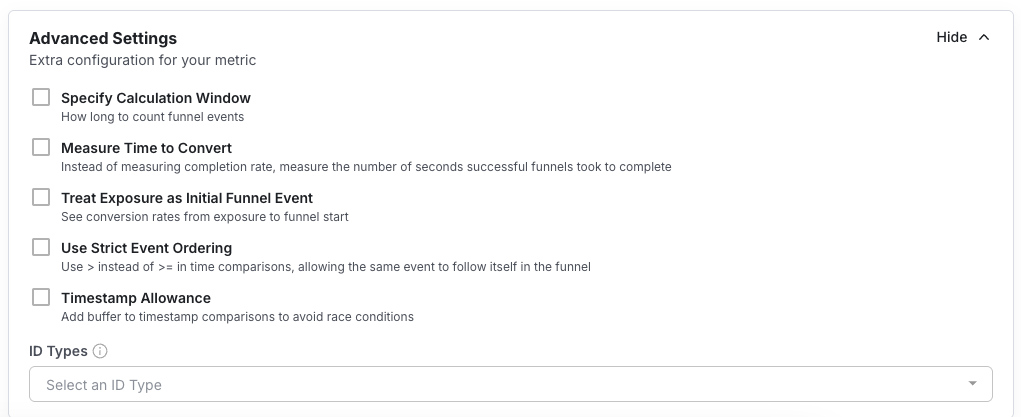
In the Advanced Settings, you can further customize your funnel metric. Options include specifying a calculation window, measuring time to convert, and treating exposure as the initial funnel event.
How it works in experiments
First, at unit level, Statsig constructs a 1/0 (or session-count number for session funnels) metric for each step of the funnel. This flag is 1 if the unit completed that step some time after the unit completed all previous steps in order. If using a session-level funnel, it's the number of sessions where that is true, e.g. the unit completed all previous steps in order for that session key.
Then, at the group level, Statsig calculates the stepwise mean as the total of each step's metric divided by the total metric from the previous step. Statsig calculates the overall mean as the units/sessions that completed the funnel divided by the unit/sessions that started the funnel.
Statsig provides a description of this in-product for any user who wants to learn more:

User retention rate
A retention metric measures changes in user stickiness and product growth.
To create a retention metric in Statsig, you need an event table that captures the key activities indicating user retention. The setup for your metric source follows the same process that previous sections describe.
Navigate to the metric catalog and select 'Retention' as your metric type. Configure the retention period and lookback window. For example, suppose you set 'Retention Period End' to 14 and the retention lookback window to 7. Statsig then measures retention as whether the user triggered the retention event between day 8 and day 14.
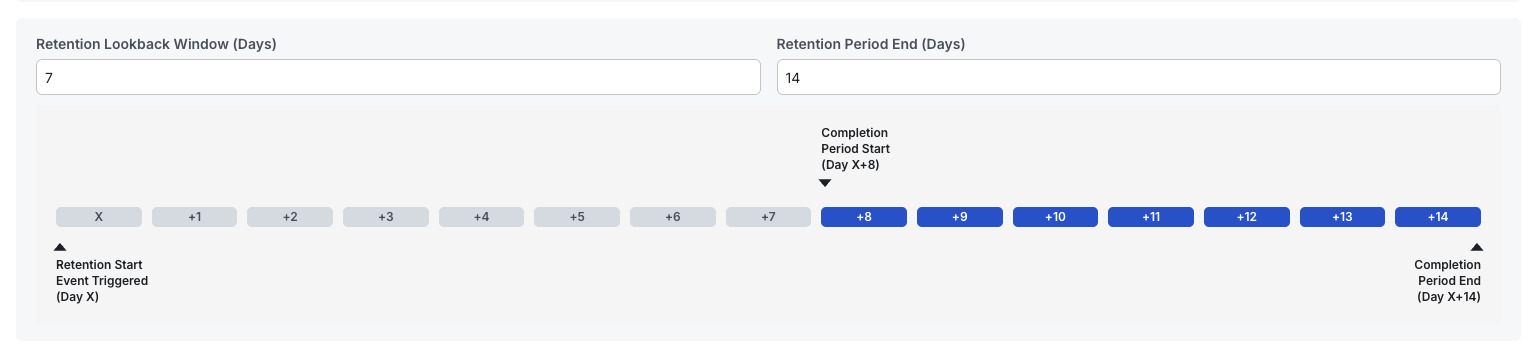
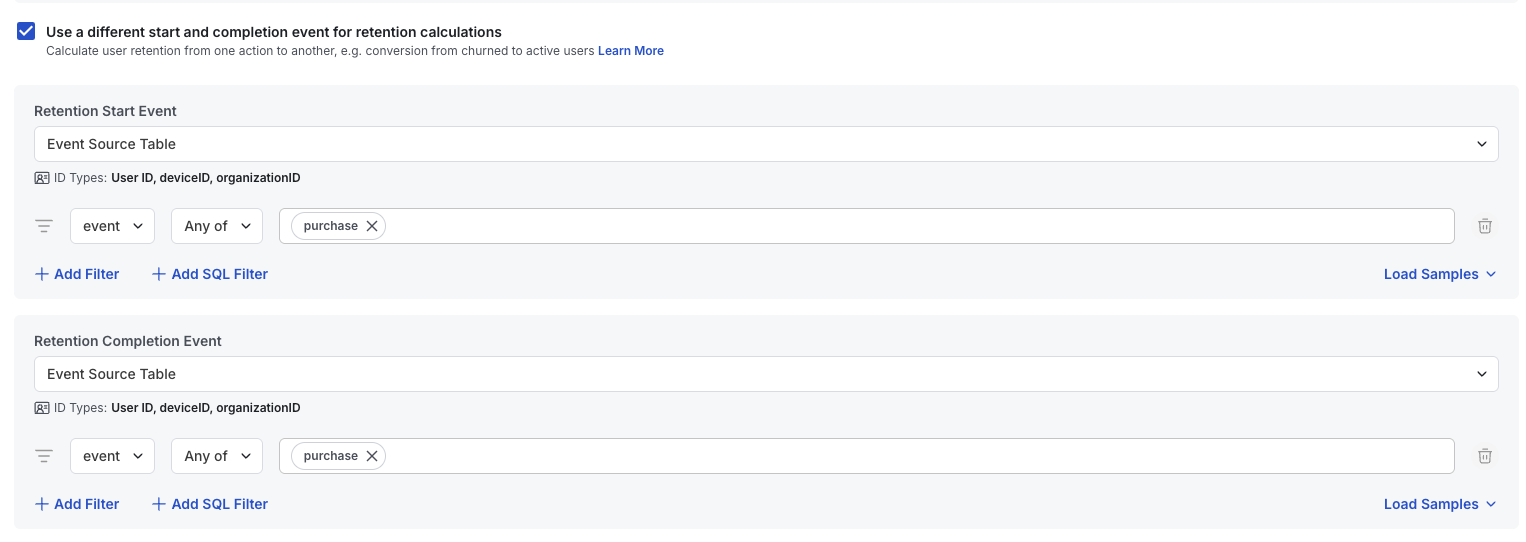
Enable "Use a different start and completion event for retention calculations" if you want to use a starting event other than exposure. You can also enable it to define a specific subset of events as your retention event. For example, based on the setup in the screenshots, this measures the week 2 retention rate of users who made a purchase in week 1.
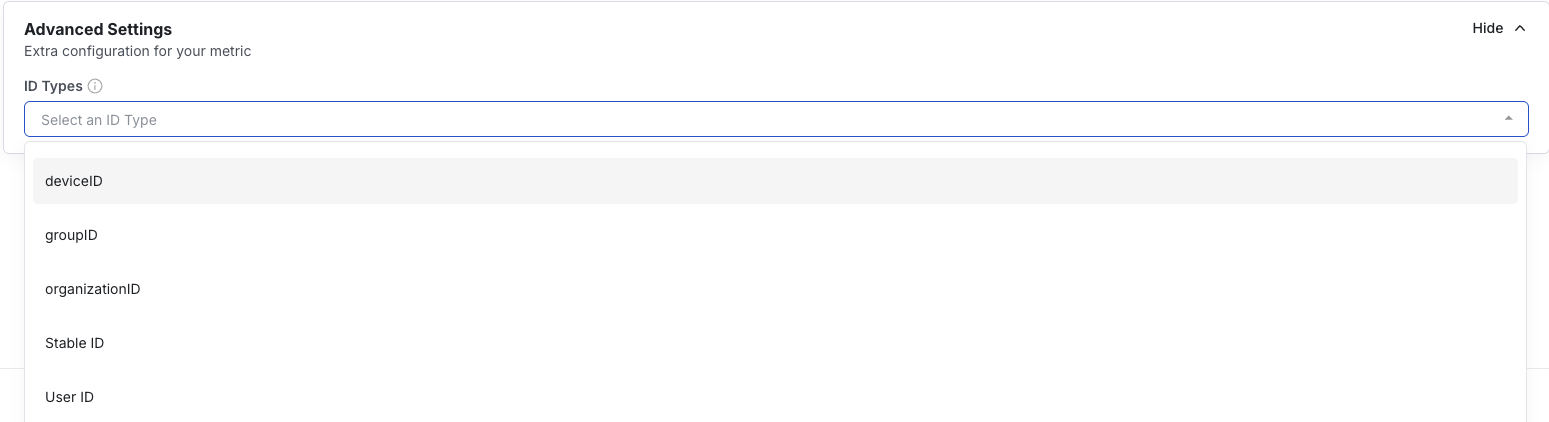
In the Advanced Settings, you can configure the ID type for your retention metric.
How it works in experiments
First, for each unit per day, Statsig checks if the retention start event triggers and assigns a 0/1 flag, which serves as the denominator of the calculation.
Next, Statsig checks if the retention completion event occurs within the specified time window and assigns a 0/1 flag, which serves as the numerator of the calculation.
Finally, at the group level, Statsig calculates retention as sum(numerator) / sum(denominator) to determine the overall retention rate.
Statsig provides a description of this in-product for any user who wants to learn more:

Was this helpful?