Metric Sources
Define metric sources in Statsig Warehouse Native that map warehouse tables and SQL queries to metric definitions used across experiments and analytics.
Metric Sources are how you schematize your warehouse data for Statsig, and they serve as the input data for metrics.
What is a metric source
A metric source is a key part of Statsig's semantic layer (and integrations to other Semantic Layers). A metric source consists of a data source, which is either:
- A SQL Query that Statsig reads as a view
- A warehouse table
And configuration around the source:
- [Required] identifier and timestamp columns
- [Optional] Aliases, partition information
- [Early Access] Data quality checks and configuration
The metric source is the entry point for using your data in parameterized queries for experiment analysis, analytics, and more within the Statsig console.
Data sources
Getting data
Statsig Metric Sources can use a query or a table as the source of their data.
A query-based source reads a SQL query and uses it as a source of truth. Combined with Statsig's built-in query macros, this provides an efficient and flexible way to create experimental data sources.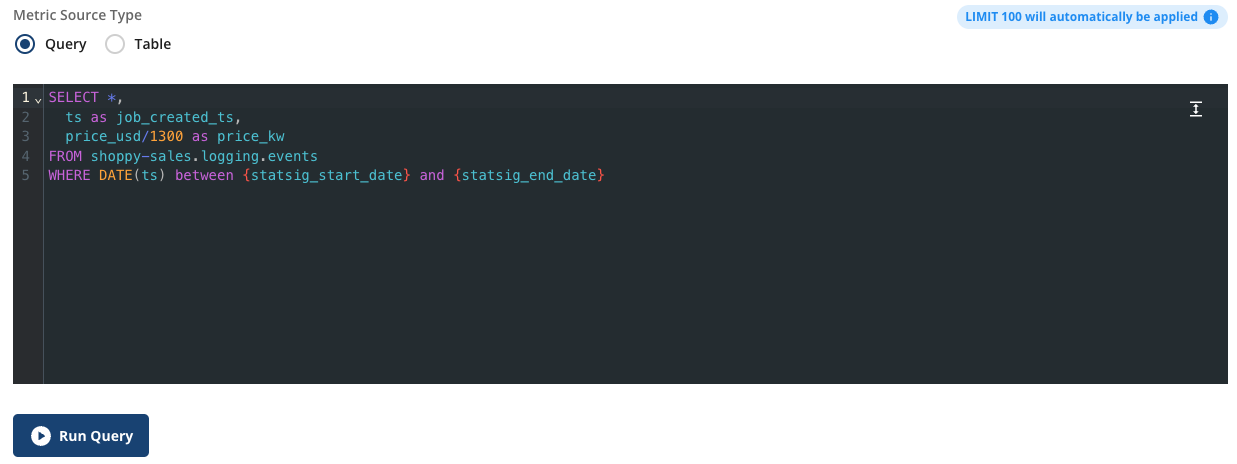
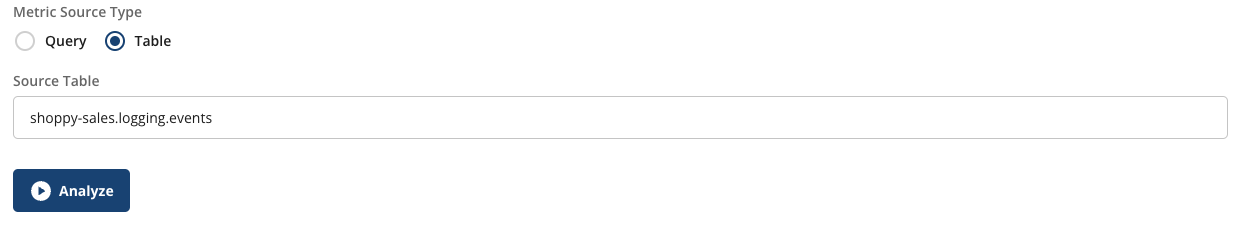
For larger or managed datasets, use table sources. Table sources minimize data scan and provide a more 1:1 mapping of "data source" to "metric source". Statsig automatically applies date macros in each experiment result reload when you use table sources.
Configuring data
For any source, select which field to use for the timestamp of the logs or metrics you provide. Also select 1 to N user identifiers to join to experiment data.
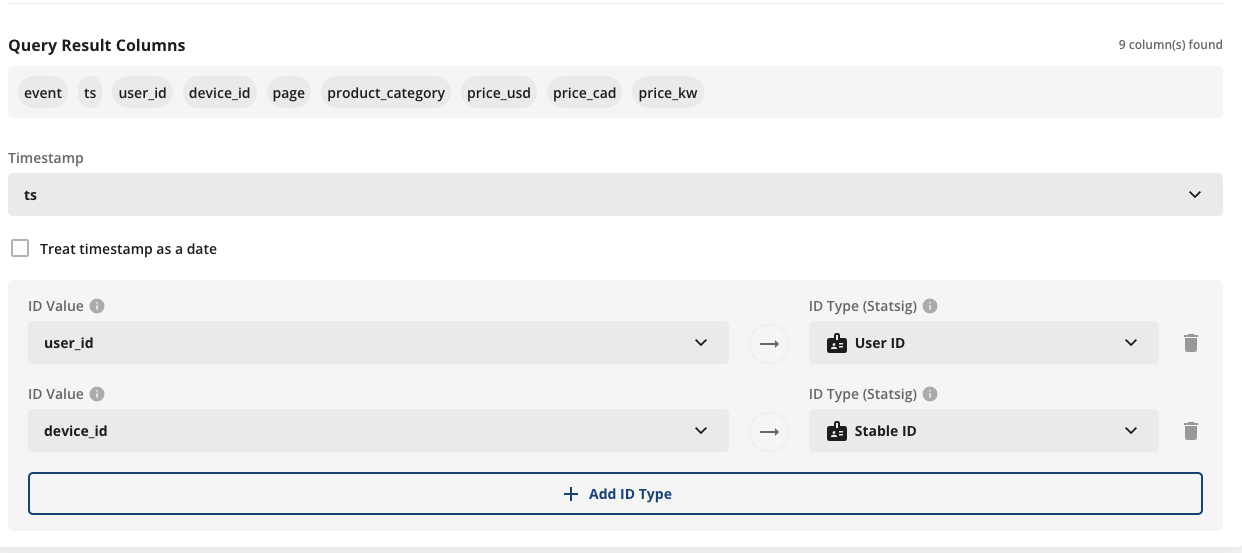
For table sources, you can optionally provide a partitioning column to reduce data scan, and provide aliases to make your column names more human-readable.
Types of data
Statsig works natively with many different types and granularities of data. Common patterns are:
1. Raw event logging (event level data), using the log timestamp as the timestamp
event_time | user_id | event_name | platform | value |
|---|---|---|---|---|
| 2024-03-01 10:05:12 | u_123 | page_view | web | null |
| 2024-03-01 10:05:45 | u_123 | button_click | web | null |
| 2024-03-01 10:07:02 | u_456 | purchase | ios | 29.99 |
Metric examples with this source:
- Number of users with purchase: You can create a UNIT COUNT metric, with a filter of event_name = 'purchase'.
- % of users with page view who clicked: You can create a RATIO metric with this metric source in both denominator and numerator, and apply event_name filter accordingly.
2. Fact tables (one row per entity per day), using the date of the row as the timestamp
order_date | order_id | user_id | order_status | items_count | revenue |
|---|---|---|---|---|---|
| 2024-03-01 | o_10001 | u_123 | completed | 2 | 49.98 |
| 2024-03-01 | o_10002 | u_456 | completed | 1 | 19.99 |
| 2024-03-02 | o_10003 | u_123 | refunded | 1 | 19.99 |
Metric examples with this source:
- Revenue: You can create a SUM metric on 'revenue' column, with any filters you need.
- Average order value: You can create a MEAN metric on 'revenue' column, with any filters you need.
3. Aggregated fact tables at unit day granularity, using the date of the row as the timestamp
date | user_id | sessions | purchases | revenue |
|---|---|---|---|---|
| 2024-03-01 | u_123 | 3 | 1 | 29.99 |
| 2024-03-01 | u_456 | 1 | 0 | 0.00 |
| 2024-03-02 | u_123 | 2 | 0 | 0.00 |
Metric examples with this source:
- Revenue: You can create a SUM metric on 'revenue' column, with any filters you need.
- Number of users with purchase: You can create a UNIT COUNT metric, with a filter of purchase > 0.
Types of data that require transformation
You may have a table that doesn’t fit the schemas above. For example, a wide user dimension table contains one row per user with pre-aggregated or derived behavioral attributes.
user_id | signup_date | first_active_date | first_page_view_date | first_purchase_date | last_active_date | lifetime_revenue | is_power_user |
|---|---|---|---|---|---|---|---|
u_123 | 2023-11-12 | 2023-11-12 | 2023-11-12 | 2023-11-20 | 2024-03-02 | 249.85 | true |
u_456 | 2024-01-05 | 2024-01-06 | 2024-01-05 | 2024-02-10 | 2024-02-18 | 19.99 | false |
u_789 | 2024-02-10 | 2024-02-10 | 2024-02-10 | null | 2024-03-01 | 89.97 | false |
This table type isn’t compatible with Statsig because it doesn’t have a single timestamp column that you can consistently configure across all events (for example, signup, first_active, and last_active). Statsig’s stats engine relies on a timestamp column to join metric data with exposure timestamps. This join ensures that Statsig includes only metric events that occur after a user is exposed to an experiment.
For example, suppose you configure signup_date as the timestamp column for this metric source. If you then attempt to build a funnel metric across multiple events (for example, signup → first_active → first_purchase), Statsig treats all funnel steps as occurring at the signup date. The metric source can only use a single configured timestamp column, so it applies that one timestamp to every step. As a result, Statsig ignores event-specific timestamps in other columns (such as first_active_date or first_purchase_date), and the funnel no longer reflects the true timing of each event.
To address this, there are two recommended options:
- Use upstream tables as the metric source: Define metrics directly from event logs or fact tables where each row represents a single event and includes a clear timestamp.
- Collapse the table into a long format: Reshape the wide user table into a long table (for example, one row per user per event or per day) with a unified timestamp column that you can configure in Statsig.
user_id | event_type | event_timestamp |
|---|---|---|
u_123 | signup | 2023-11-12 09:15:00 |
u_123 | first_active | 2023-11-13 10:02:41 |
u_123 | last_active | 2024-03-02 18:45:10 |
u_456 | signup | 2024-01-05 14:22:09 |
u_456 | first_active | 2024-01-06 08:11:54 |
Managing metric sources
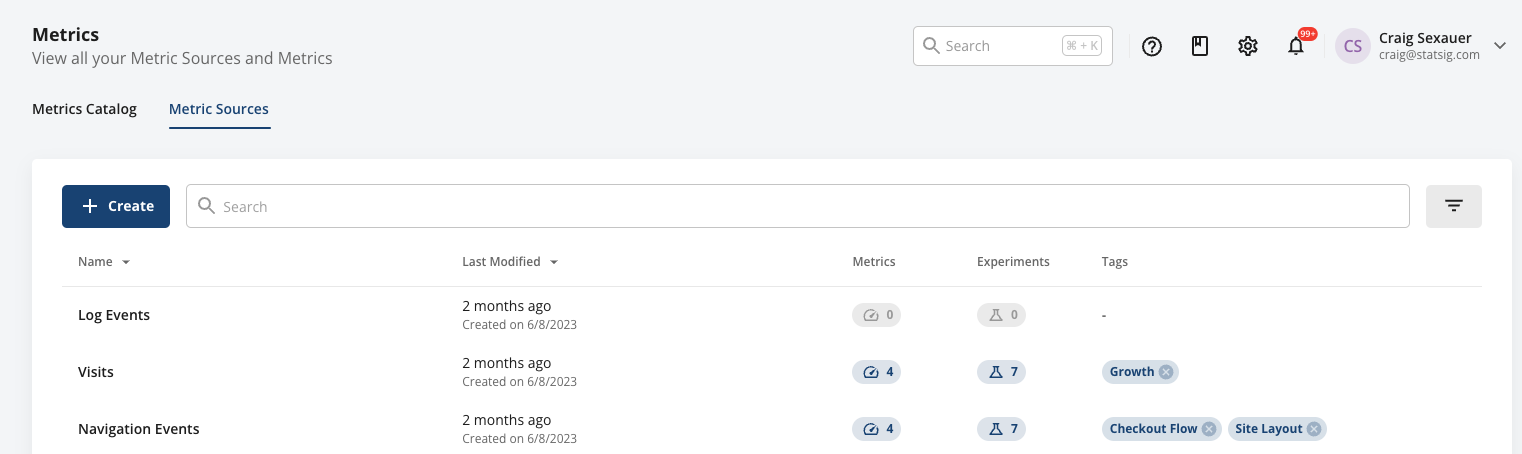
In the metric source tab, you can see your metric sources and the metrics and experiments that use them. In some cases, it makes sense to have a broad metric source that you reuse across many metrics with different filters and aggregations. In others, a metric source may exist for one metric, such as a set of specific events for a funnel.
Programmatic updates
You can create and modify metric sources through the API as part of your release flow for data systems. The API supports creating read-only artifacts. Refer to the console API and Semantic Layer Sync documentation.Governance
If you're concerned about granting Statsig broad warehouse access, give Statsig access only to its own staging schema or dataset. In that location, create views or materialize staging tables for the data you want Statsig to read.
Daily vs. realtime sources
When specifying a timestamp, you can also specify if the metric source contains data at a daily or timestamp granularity by toggling the "Treat Timestamp as Date" setting.

When this setting is not enabled, the system performs a timestamp-based join. Statsig attributes events to the experiment results based on the exact time they occur relative to the exposure time. For example, if a user is exposed at 2024-01-01T11:00:00 and an event occurs at 2024-01-01T11:01:00, Statsig attributes the event to the experiment because it occurred after the exposure. If the event occurs at 2024-01-01T10:59:00, before the exposure, Statsig doesn't attribute it.
When the "Treat Timestamp as Date" setting is enabled, the system performs a date-based join. Statsig includes all events occurring on the same calendar day as the exposure, regardless of time, in the experiment results. This includes data from the first day of exposures, ensuring Statsig doesn't omit day-1 metrics from the analysis.
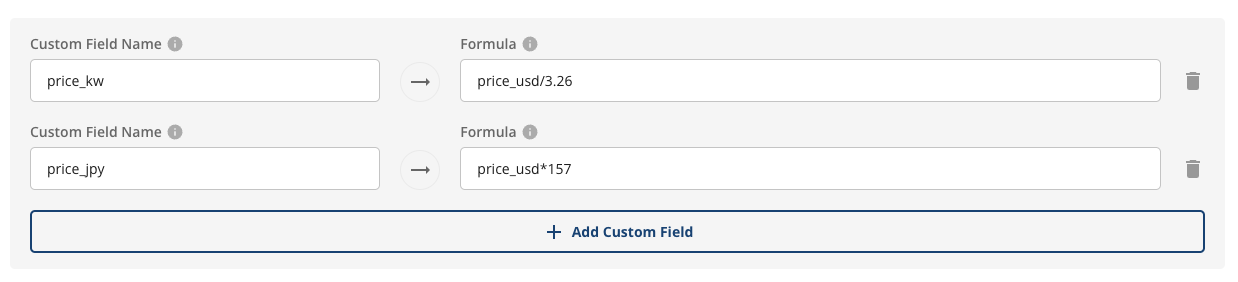
All Statsig needs to create metrics is a timestamp or date, and a unit (or user) identifier. Context fields let you pull multiple metrics from the same base query, and select values to sum, mean, or group by.
| Column Type | Description | Format/Rules |
|---|---|---|
| timestamp | Required an identifier of when the metric data occurred | Castable to Timestamp/Date |
| unit identifier | Required At least one entity to which this metric belongs | Generally a user ID or similar |
| additional identifiers | Optional Entity identifiers for reuse across identifier types | |
| context columns | Optional Fields you aggregate, filter, or group on |
For example, you could pull from event logging and aggregate the event-level data to create metrics:
| timestamp | user_id | company_id | event | time_to_load | page_route |
|---|---|---|---|---|---|
| 2023-10-10 00:01:01 | my_user_17503 | c_22235455 | page_load | 207.22 | / |
| 2023-10-10 00:02:15 | my_user_18821 | c_22235455 | page_load | 522.38 | /search |
| 2023-10-10 00:02:22 | my_user_18821 | c_22235455 | serp_click | null | /search |
You could create an average TTL metric by averaging time_to_load, and group it by page route or filter to specific routes when creating your metric.
As another example, you might pre-calculate some metrics at a user-day grain, either to match your source of truth exactly or to add more complex logical fields:
| timestamp | user_id | company_id | country | page_loads | satisfaction_score | revenue_usd | net_revenue_usd |
|---|---|---|---|---|---|---|---|
| 2023-10-10 | my_user_17503 | c_22235455 | US | 13 | 9 | 130.21 | 112.33 |
| 2023-10-10 | my_user_18821 | c_22235455 | CA | 1 | 2 | 0 | 0 |
| 2023-10-10 | my_user_18828 | c_190887 | DE | 0 | null | 22.1 | 0 |
You can create different metrics by summing and filtering on those daily fields.
(Very) slow metric sources
Statsig uses techniques like Statsig macros, push-down filters (predicate filters), and partition keys to make queries in your warehouse efficient. While metric sources can include joins or complex queries, they should be performant. If they aren't, any metrics based on that metric source become expensive or cause timeouts and failures. The same applies to assignment sources.
Statsig flags a metric source as slow if it takes more than 30 seconds to retrieve a sample of up to 100 records from the table. If the query is expensive, consider the following steps in sequence to optimize your metric source:
- Include filters based on the partition column.
- Use Statsig macros in SQL.
- Pre-calculate some of the metrics to avoid joins or complex queries.
- Upgrade your computing resources if you're on a very small cluster. Do this cautiously.
If Statsig flagged you for a slow assignment source, the same guidance applies.
Was this helpful?