Viewing Feature Gate exposures
Monitor feature impact by viewing gate exposures, balanced gates, and metric lifts in Statsig console
Gate exposures
To see the number of users exposed to a feature gate:
- Log into the Statsig console at https://console.statsig.com
- On the left-hand navigation panel, select Feature Gates
- Select the feature gate that you want to test
- Click on the Pulse Results tab
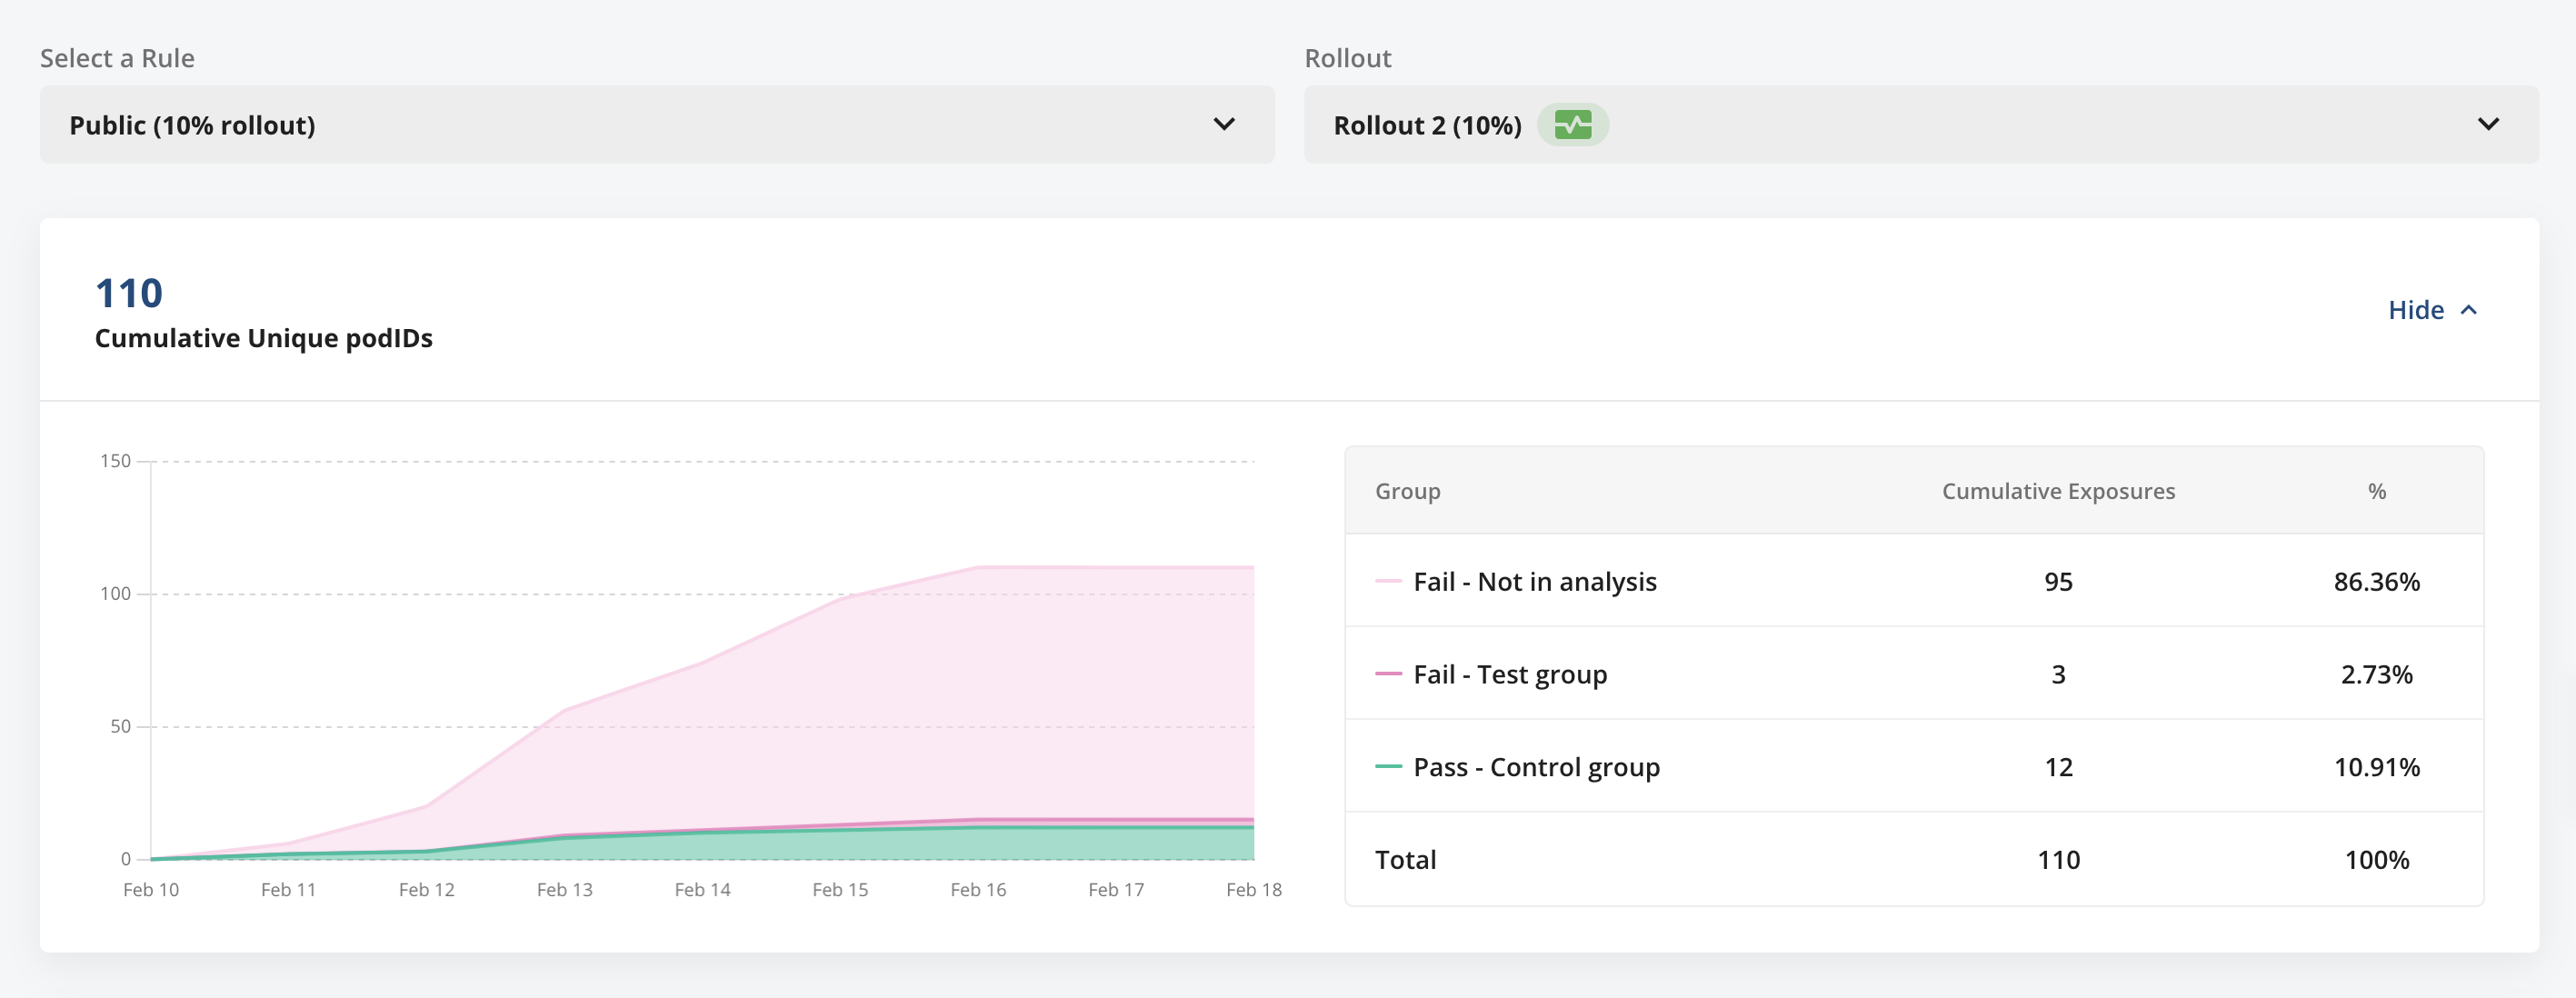
- The Cumulative Exposures panel shows total exposures of a feature gate, broken down into three groups:
- Units that passed the feature gate and were used for analysis.
- Units that did not pass the feature gate and were used for analysis vs. the "Pass" group.
- Units that did not pass the feature gate and were not used for analysis vs. the "Pass" group.
Balanced gates
Statsig balances gates and holdouts by default in Cloud, and as an opt-in option for Warehouse Native holdouts (on the Setup page). This reduces false positives at the cost of some sample size. This is a best practice, and Statsig defaults to a balanced analysis. Go to section 7 of AB Testing Intuition Busters for more discussion.Statsig achieves this sampling during analysis by downsampling the larger arm proportionally to match the smaller group. For example, a (100 - large_group_pct)/(large_group_pct) sampling rate is applied to the larger group using an unbiased hashing approach, keeping the user pool consistent. Statsig rotates the hash salt across different gates and holdouts.
Metric lifts
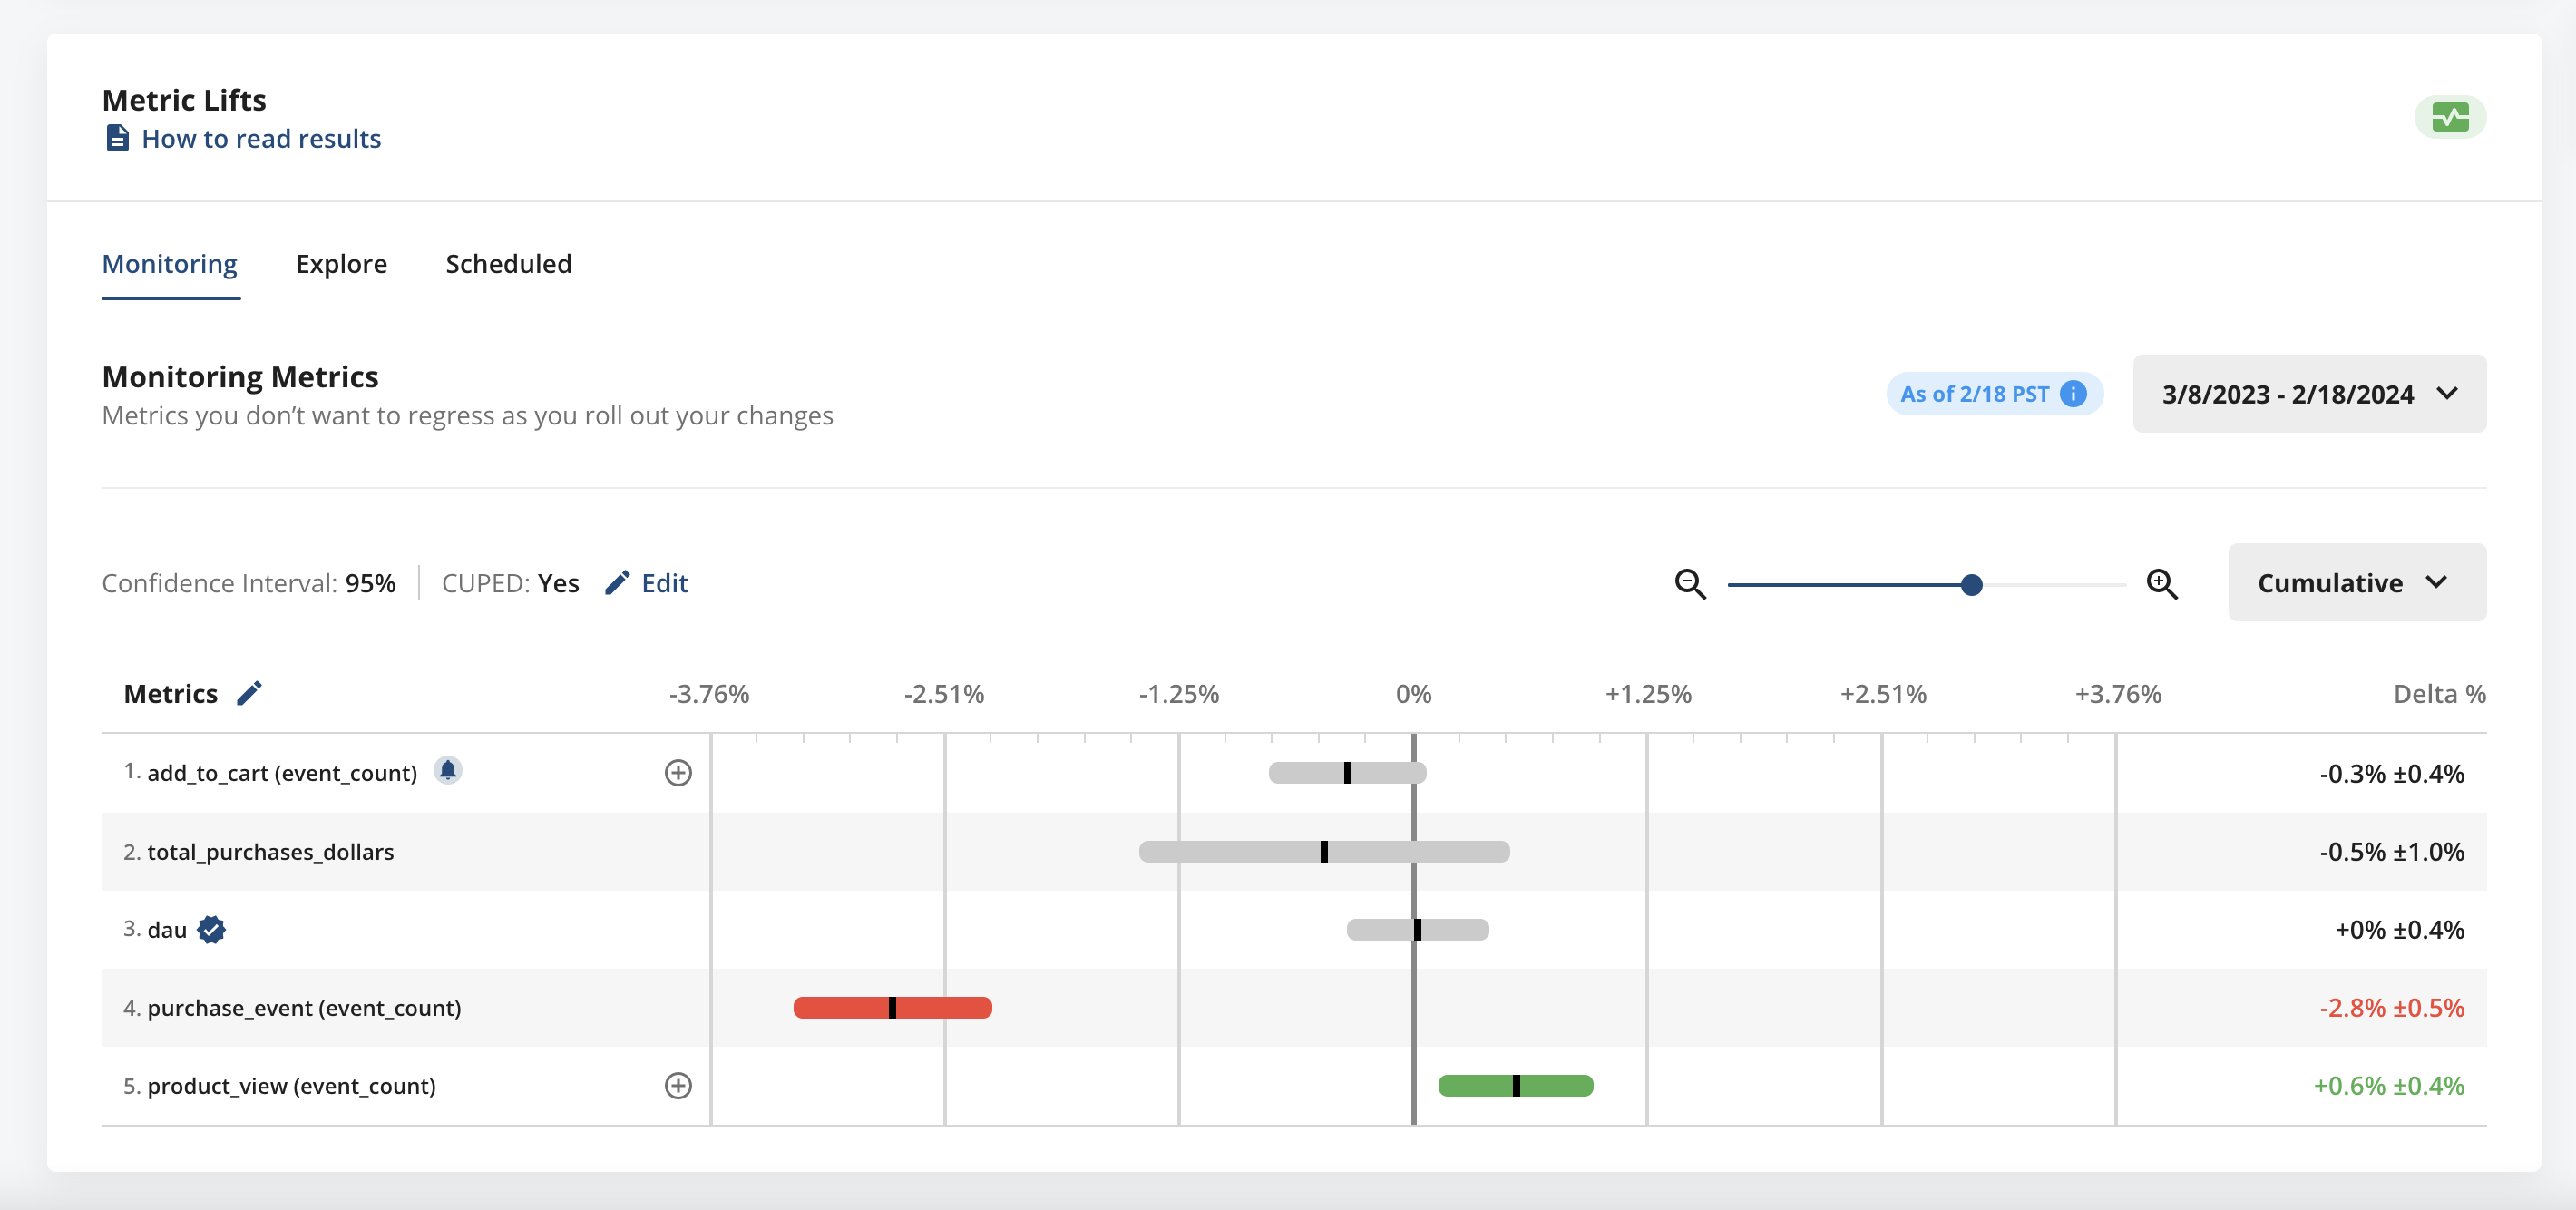
The Metrics Lifts panel shows how your feature is performing based on lifts in any business metrics added to the list of Monitoring Metrics for your gate.
Statsig uses an equal variant comparison (for example, 10% vs 10%) for calculating metric lifts for gate rollouts. Read more about the advantages of this methodology in "A/B Testing Intuition Busters: Common Misunderstandings in Online Controlled Experiments" by Ron Kohavi, Alex Deng, & Lukas Vermeer.In the example below, the rises in product view count and purchase event count are statistically significant, suggesting this feature positively impacts the number of product views, but may actually be negatively impacting conversions to purchases.
Bots & filtering
Was this helpful?