Pre-Post Results
Learn how to use Pre-Post Results to analyze feature impact when traditional A/B testing isn't possible
Pre-Post Results is an analysis mode for Feature Gates that estimates a feature's impact when you can't run a traditional A/B test. It compares your key metrics in the period before a rollout against the period after, so you can gauge the directional impact of a feature you shipped to everyone at once. Use Pre-Post Results when you roll a gate straight from 0% to 100% and have no control group to compare against.
Cloud only feature Statsig offers this feature only on Statsig Cloud. As Statsig works on a WHN solution, contact Statsig if you're interested in being an early customer.
How Pre-Post Results work in Statsig
By comparing key metrics before and after you roll out a feature gate from 0% to 100% of users, you can identify the directional impact of your features in production.
Pre-Post is particularly valuable for:
- Emergency rollouts: Features that need to ship immediately without time for a slow rollout
- Infrastructure changes: Backend improvements or technical features that affect all units/pods/users and that you can't partially roll out
- Retroactive analysis: Understanding the rough impact of features you already rolled out without experiments
- Regulatory or ethical features: Changes you can't withhold from a control group
Pre-Post Results aren't experiments
Pre-Post analysis measures the change in a metric around a specific point in time, among a specific set of exposed units. It doesn't meet the requirements of a proper A/B test or feature gate partial rollout. Think of Pre-Post analyses as snapshot measurements around the time you launched your feature. Because many other factors can occur at the same time, there's no guarantee that your results are due to your feature launch. Correlation doesn't equal causation.
Experiments remain the standard for measuring feature impact. Run launches as an Experiment or partial Feature Gate rollout when accuracy, validity, and extensibility are important.
When does Statsig calculate Pre-Post Results?
Statsig calculates Pre-Post Results for targeting rules that meet specific rollout conditions:
- The targeting rule started at 100% pass rate, or you rolled it out from 0% to 100% in a single step
- The rollout happened in the last 30 days
When you select a qualifying rule in the Metrics Impact tab, Statsig automatically switches to Pre-Post Results mode and displays a banner indicating you're viewing Pre-Post analysis.
How Pre-Post Results calculates feature impact
Pre-Post Results uses the following approach to estimate feature impact:
- Identify the participating units: Find all users you exposed to the feature after the 100% rollout
- Collect pre/post-rollout data: Gather metric values for these users from the periods before and after the rule change
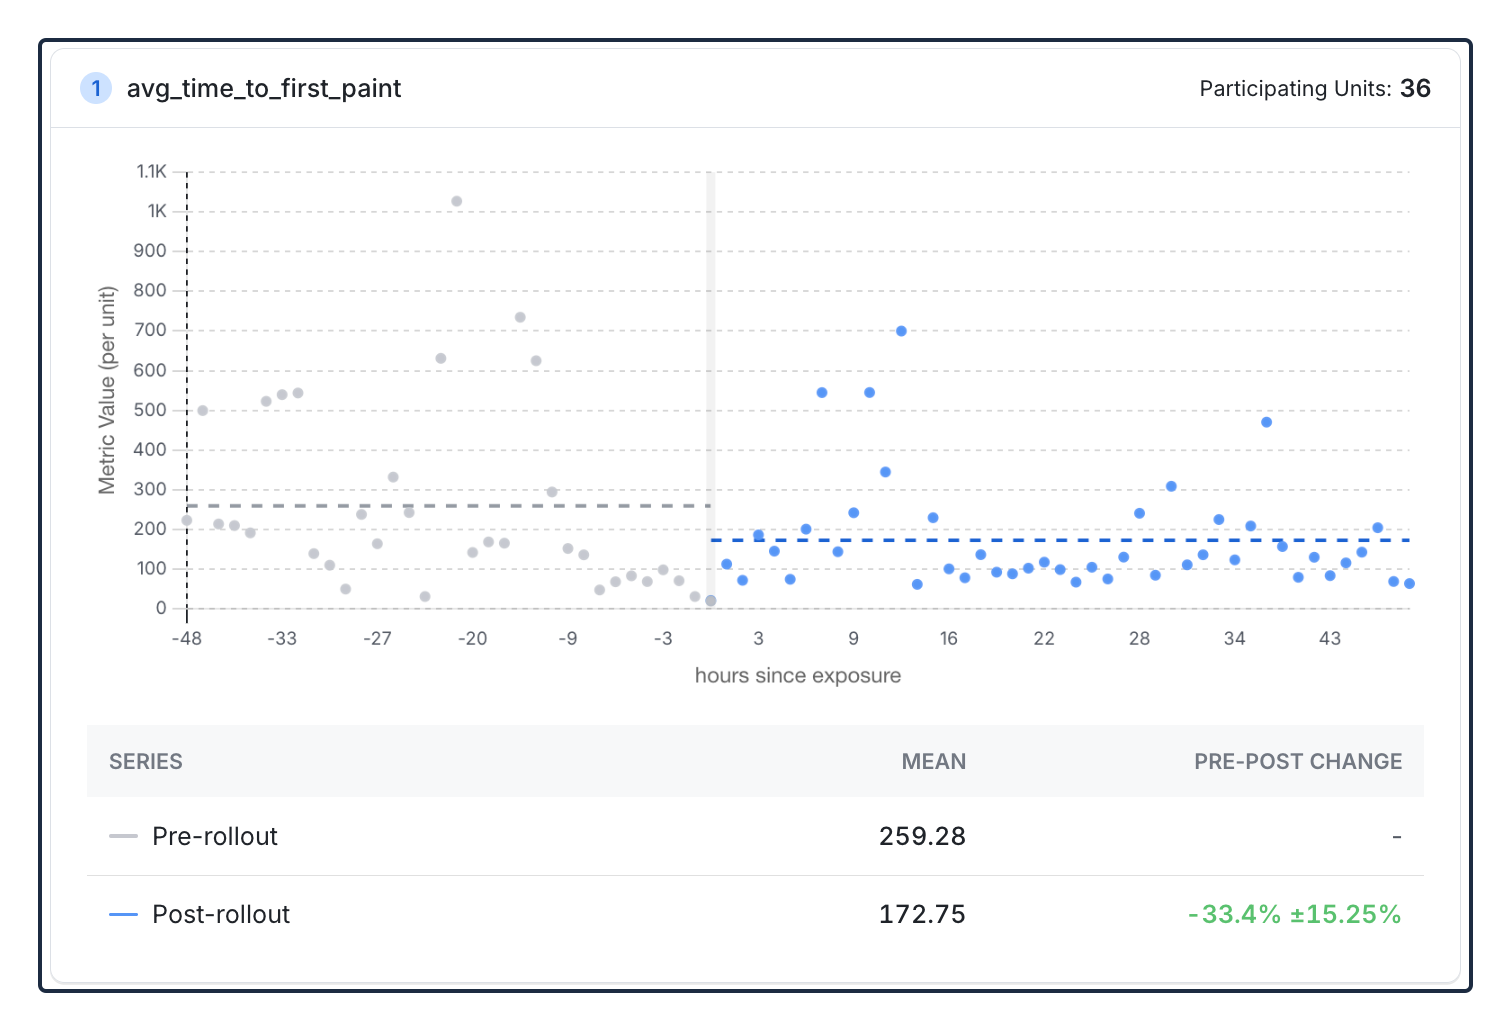
- Bucket metric data into discrete periods: Statsig automatically groups metric data into buckets of a consistent duration.
- Calculate the difference: Compute the mean metric values for both pre and post periods, treating each bucket as a unique observation, then calculate the delta (difference) between them
This method ensures Statsig compares the same users before and after the feature rollout.
Supported metric types
| Metric type | Supported |
|---|---|
| Event Count | ✅ Yes |
| Event Count Custom | ✅ Yes |
| Event User | ✅ Yes |
| Sum | ✅ Yes |
| Mean | ✅ Yes |
| Funnel | ❌ No |
| Ratio | ❌ No |
| Participation Rate | ❌ No |
Best practices
When using Pre-Post Results, follow these guidelines:
- Focus on metrics that are directly related to your feature's intended impact and have sufficient volume. The more directly a metric responds to the feature launch, the easier it is to detect a sudden change.
- Correlation doesn't equal causation. Consider other changes, seasonal effects, or external events that might influence your metrics during the analysis period.
- Use Pre-Post Results as one data point alongside qualitative feedback, user research, and business context to make informed decisions.
- If you can partially roll out a feature to less than 100% of users, do so. A partial rollout lets you measure the metric impact for users who see the feature against users who don't. That comparison establishes true causation.
Known limitations
- 30-day window: Statsig supports only rollouts from the last 30 days
- No control group: Results show correlation, not definitive causation
- External factors: Other changes during the analysis period can influence results
- Metric type restrictions: Statsig doesn't yet support some advanced metric types.
Was this helpful?