Running an A/A Test
Learn how to run A/A tests to validate your experimentation setup and ensure proper metrics configuration.
This guide walks through creating and implementing an A/A test on your product in Statsig. A/A tests are commonly used to validate a new experimentation engine you may be integrating with.
For new users, running an A/A test provides a low-stakes first test environment. Use it to confirm that your metrics are set up correctly and that exposures are flowing through as expected before starting your first A/B test.
By the end of this tutorial, you'll have:
- Created a new Feature Gate in the Statsig console, set up as an "A/A test"
Prerequisites
- You already have a Statsig account
- You already integrated the Statsig Client SDK into an existing application
Step 1: Create a feature gate in the console
The easiest way to run an A/A test in Statsig is by using a Feature Gate. You can also use an Experiment to run an A/A, but this tutorial uses a Feature Gate.Log into the Statsig console at https://console.statsig.com/ and navigate to Feature Gates in the left-hand navigation panel.
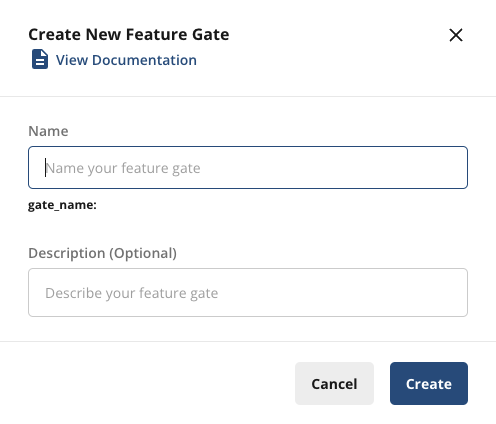
Click on the Create button and enter the name and (optional) description for your feature gate. This example calls the feature gate “aatest_example”. Click Create.
In the Setup tab, define the rules for this feature gate. Tap + Add New Rule. You can run an A/A test on a specific user group or platform, but the recommended setup is to divide all traffic 50/50 and deliver the same experience to each group.
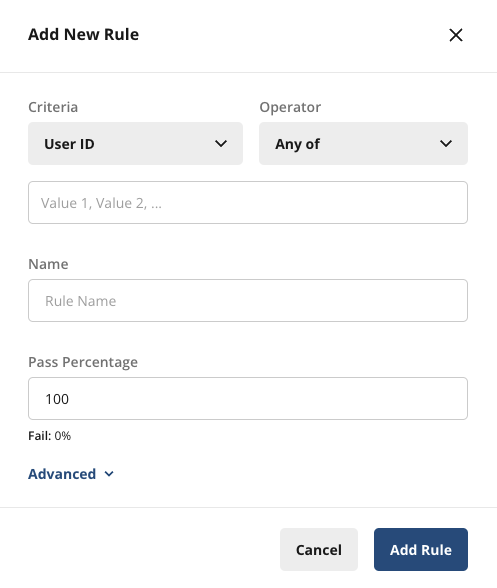
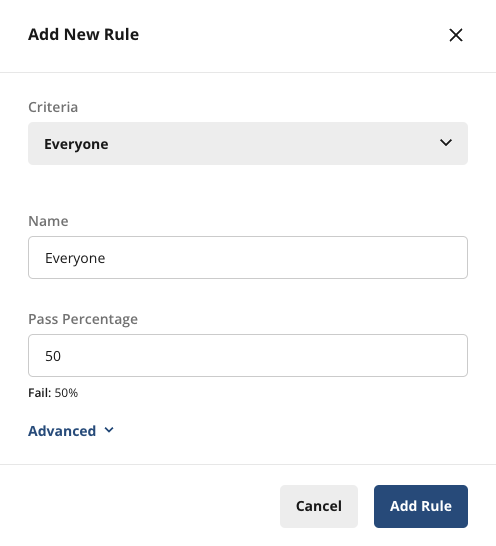
Under Criteria, select Everyone (you may need to scroll up), name your rule, and set the Pass Percentage to 50%. Click Add Rule, then tap Save Changes in the upper right-hand corner.
Your feature gate setup should now look as follows:
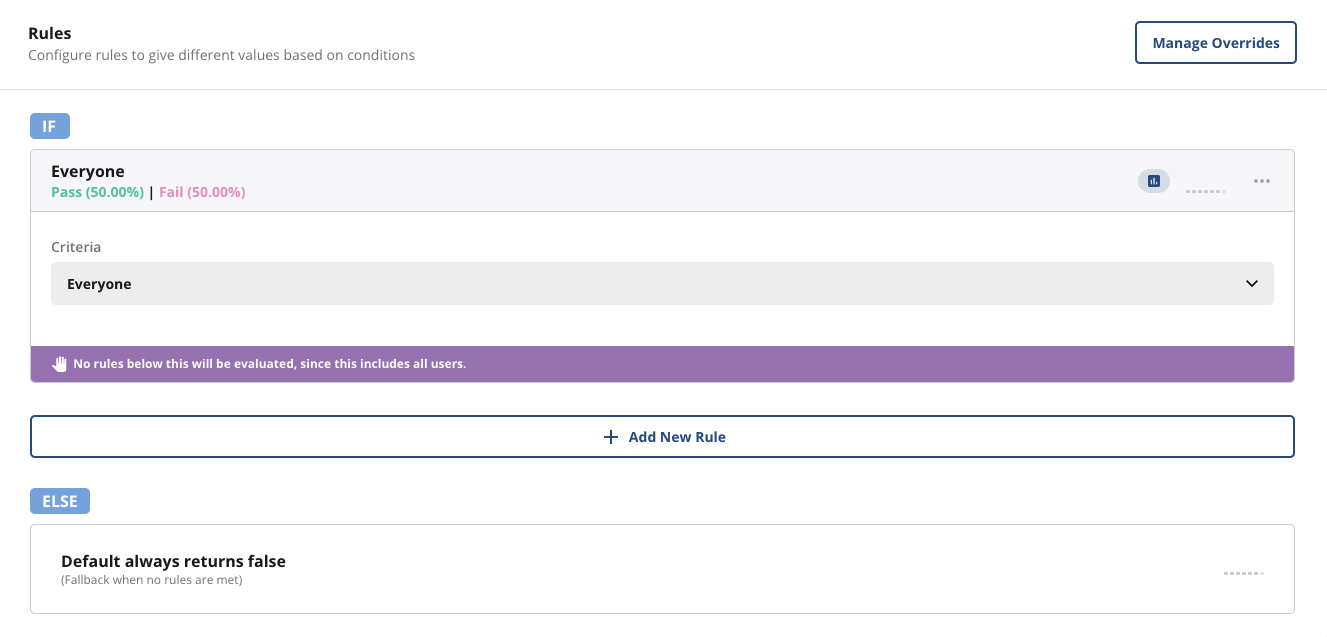
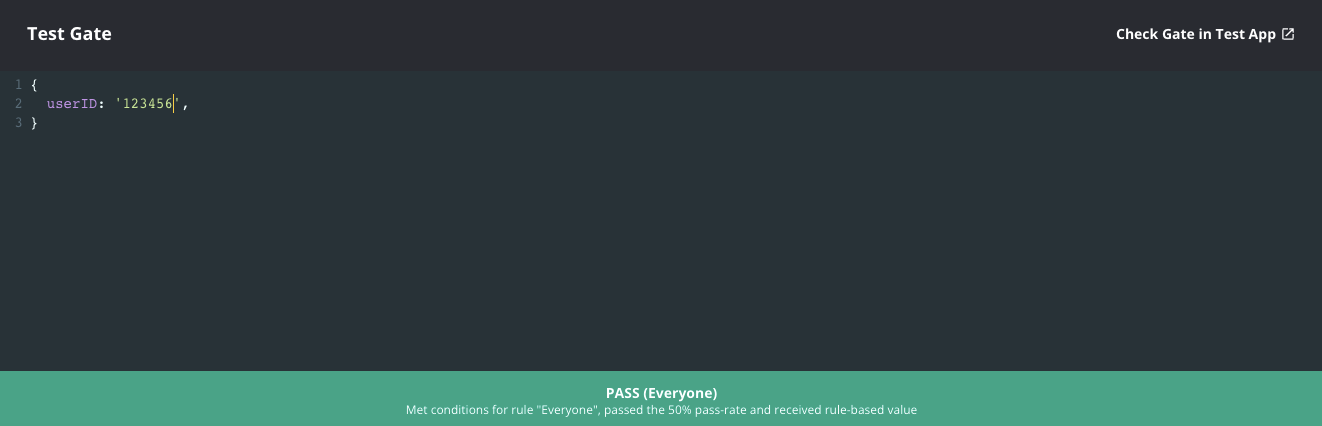
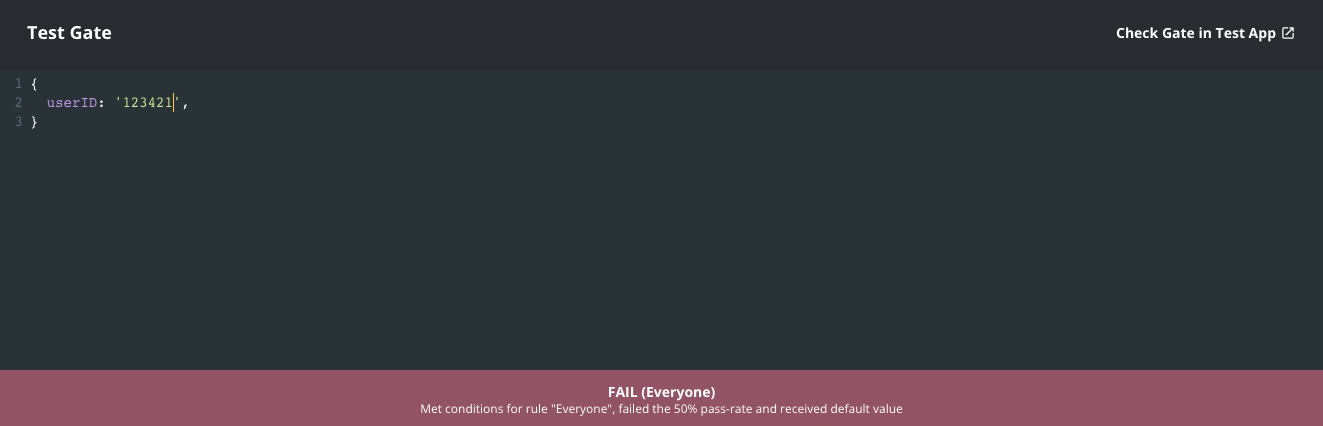
Verify that the gate is working as expected by typing in some sample user IDs into the console. Roughly 50% of the IDs should pass and 50% should fail.
Step 2: Check the feature gate in your code
Copy the code snippet from the upper right corner of your feature gate page (under the < > symbol) and add it to your application at the point where you want to call the A/A check.
statsig.checkGate("aatest_example")
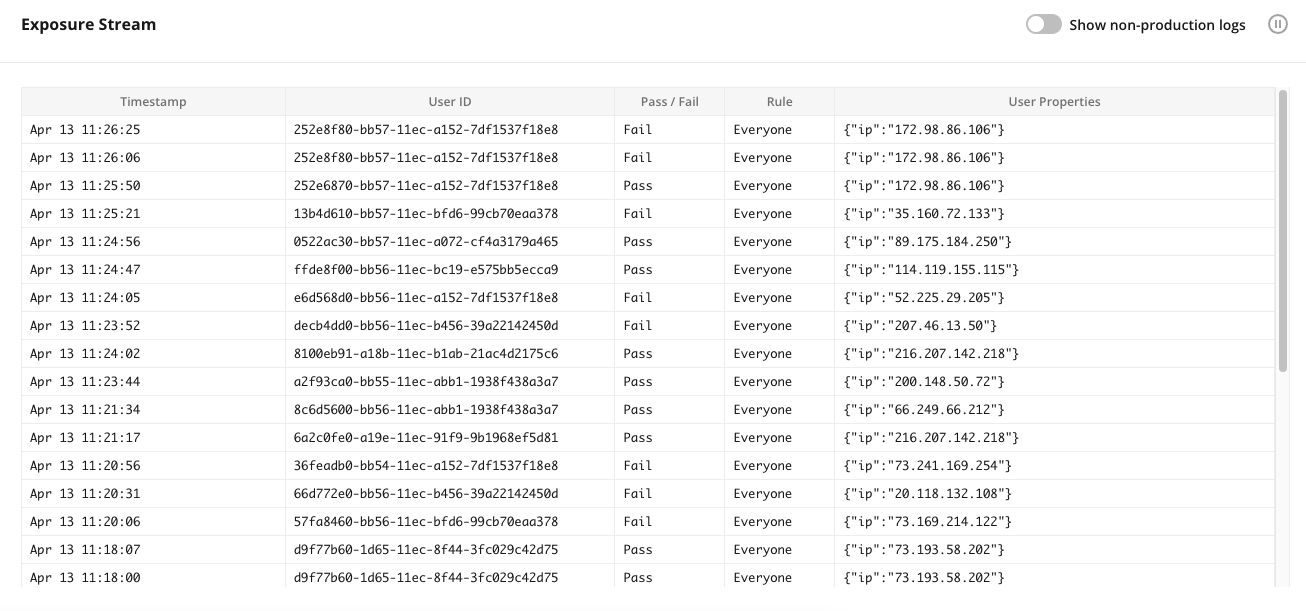
When a user renders this page in their client application, a live log stream appears in the Statsig console under the Diagnostics tab of your feature gate.
Step 3: Review A/A test results
Within 24 hours of starting your experiment, cumulative exposures appear in the Pulse Results tab of your feature gate.
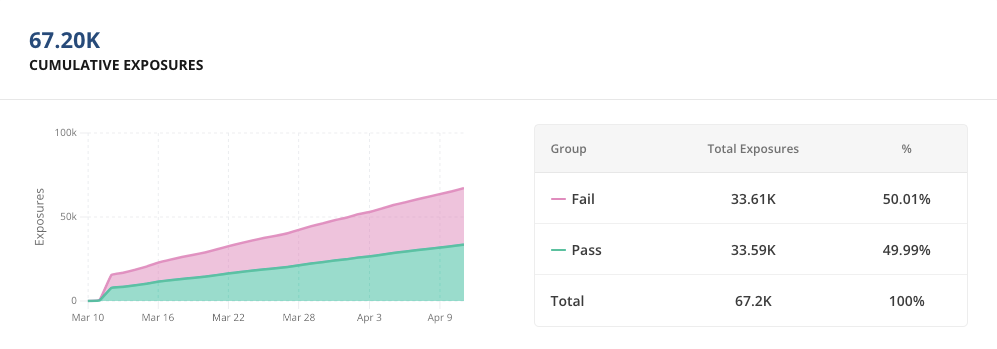
This shows your logged exposures and their distribution. If something looks off, check the Diagnostics tab for day-by-day exposure breakdowns at both the Checks and User level.
In the Metric Lifts panel, you can see the full picture of how all your tagged metrics are performing.
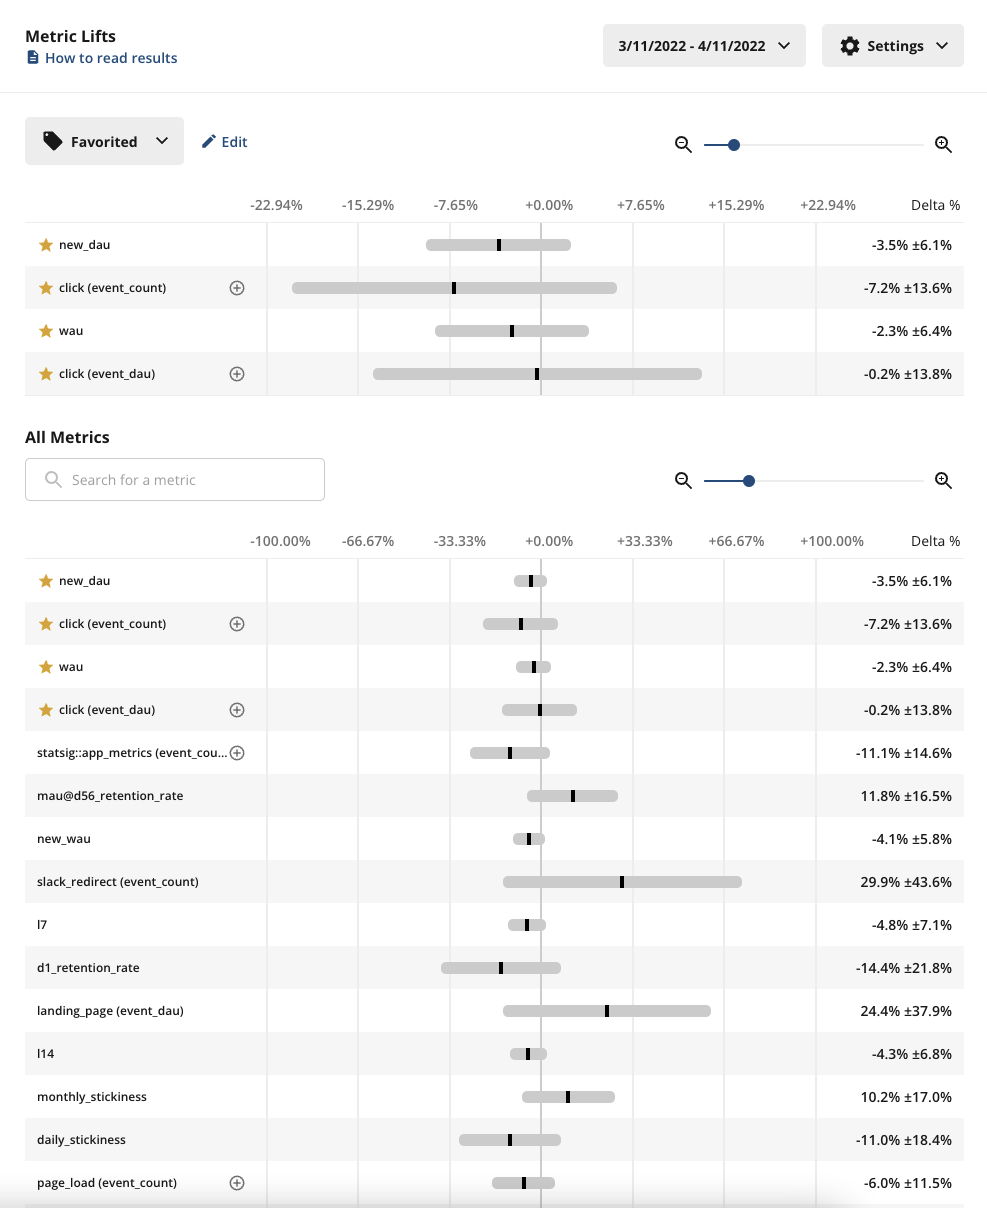
What should you expect to see?
- Exposures- make sure you’re seeing exposures flowing through as expected from your product. If you’re not seeing exposures, use the Diagnostics tab and the Exposure Stream to debug
- Pulse results- roughly 5% of your metrics in Pulse should be showing a statistically significant change due to the 95% confidence interval of Statsig’s stats engine
Run your A/A long enough to reach most of your weekly active users, or at least a week.
Simulated A/A tests
Statsig runs simulated A/A tests every day in the background for every company on the platform. An A/A test is structured like an A/B test, but both groups receive the same experience. A/A tests help build trust in your experimentation platform and metrics.
A/A tests can be Online or Offline. An Online A/A test runs on real users. An engineer instruments your app with the Statsig SDK to check for experiment assignment. Statsig logs assignment, but delivers no difference in experience to the user.Since there is no effect, you expect to only see statistical noise. When using 95% confidence intervals, only ~1 in 20 metrics shows a stat-sig difference between control and test.
Offline A/A tests
A single request runs on one unit type. An offline A/A test works by:
- Querying a representative sample of your data
- Randomly assigning subjects to Test or Control
- Computing relevant metrics for Test vs Control and running them through the stats engine
- Measuring the percentage of false positives. With a p-value cutoff of 0.05 (typical), you can expect a ~5% false positive rate.
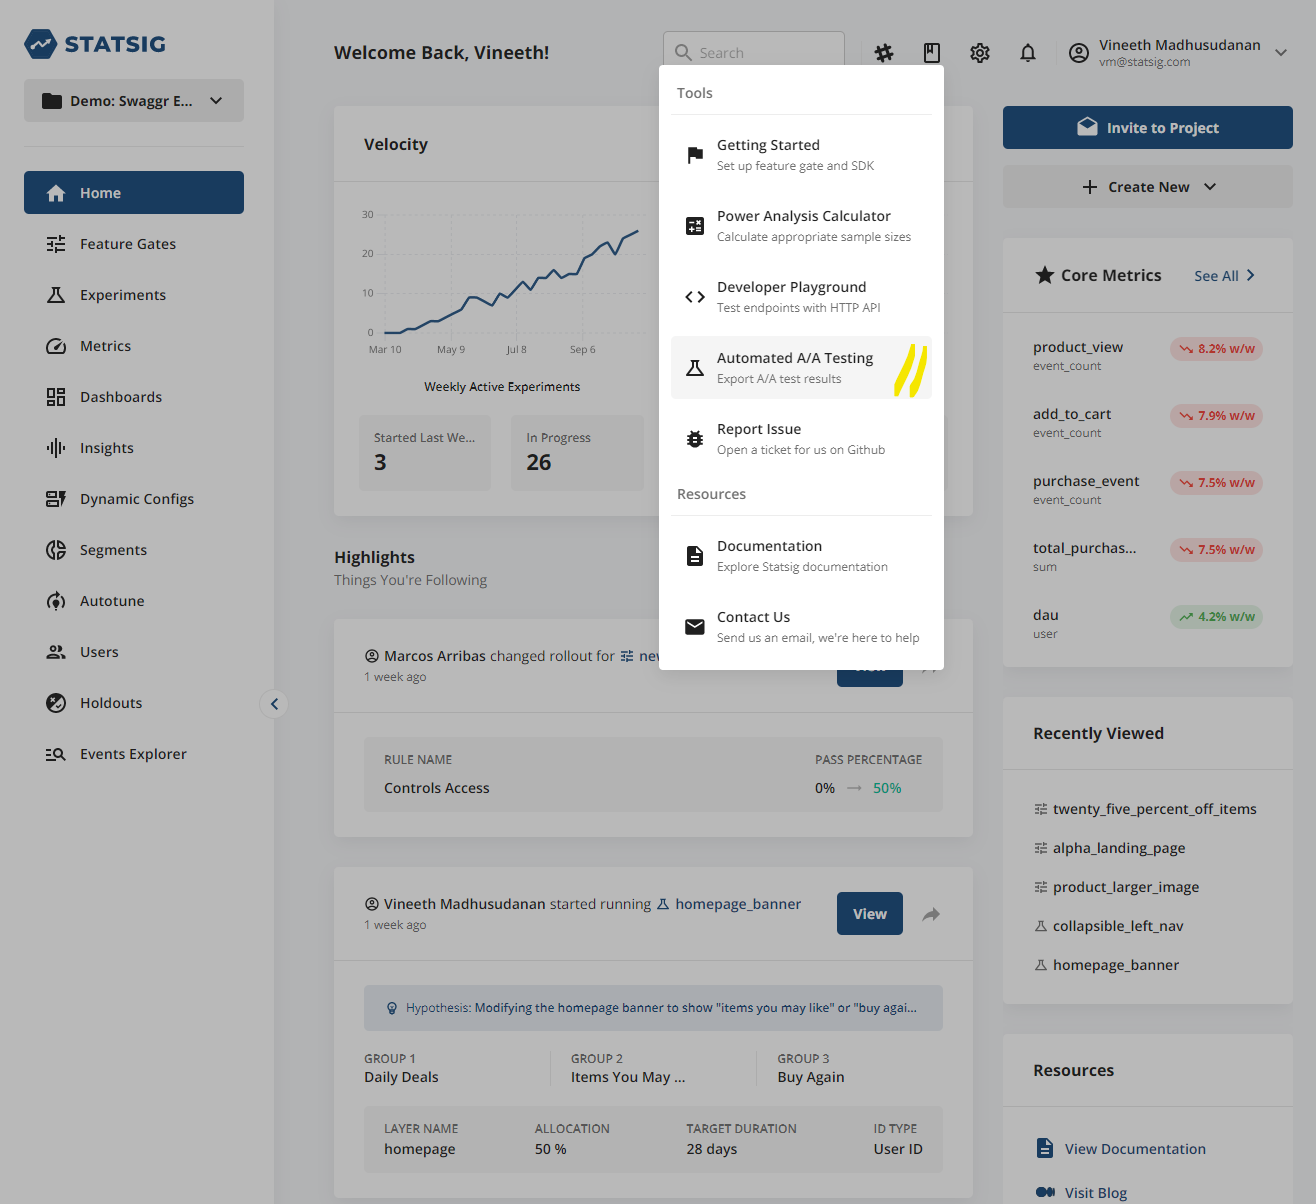
Download the running history of your simulated A/A test performance through the “Tools” menu in the Statsig Console. Statsig runs 100 tests per request.
Simulated A/A test file columns
| Column Name | Description |
|---|---|
| metric_name | Name of the Metric |
| metric_type | Type of Metric |
| unit_type | The unit used to randomize (e.g. userID) |
| n_tests | The number of tests run |
| pct_ss_95_pct_confidence | The percentage of tests that have a stat-sig result for this metric |
| avg_units_per_test | The number of units (often users) sampled into the A/A test |
| avg_participating_units_per_test | The number of units in the test with a value for this metric |
Was this helpful?