For AI agents: a documentation index is available at /llms.txt. Append .md to any page URL for markdown, or send Accept: text/markdown.
Sequential Probability Ratio Tests
Learn about SPRT methodology for faster A/B test decision making with no penalties for peeking.
The sequential probability ratio test (SPRT) decides an A/B test by comparing how likely your data is under the alternative hypothesis versus the null hypothesis, and stops when that likelihood ratio crosses an upper or lower boundary set from your alpha and beta. You can read results at any time with no peeking penalty, and you can accept the null hypothesis as well as the alternative. SPRT requires a baseline mean, standard deviation, and minimum detectable effect (MDE) for each metric before the experiment starts.
Statsig offers three analysis methods, which you choose with the Analytics Type setting under Advanced Settings on the experiment Setup tab. Use frequentist analysis with sequential testing for standard p-values and confidence intervals that stay valid when you read results early. Use SPRT when you want unlimited peeking and the option to accept the null hypothesis as well as reject it. Use Bayesian mode for chance-to-beat and expected-loss readouts, with optional priors from past experiments.
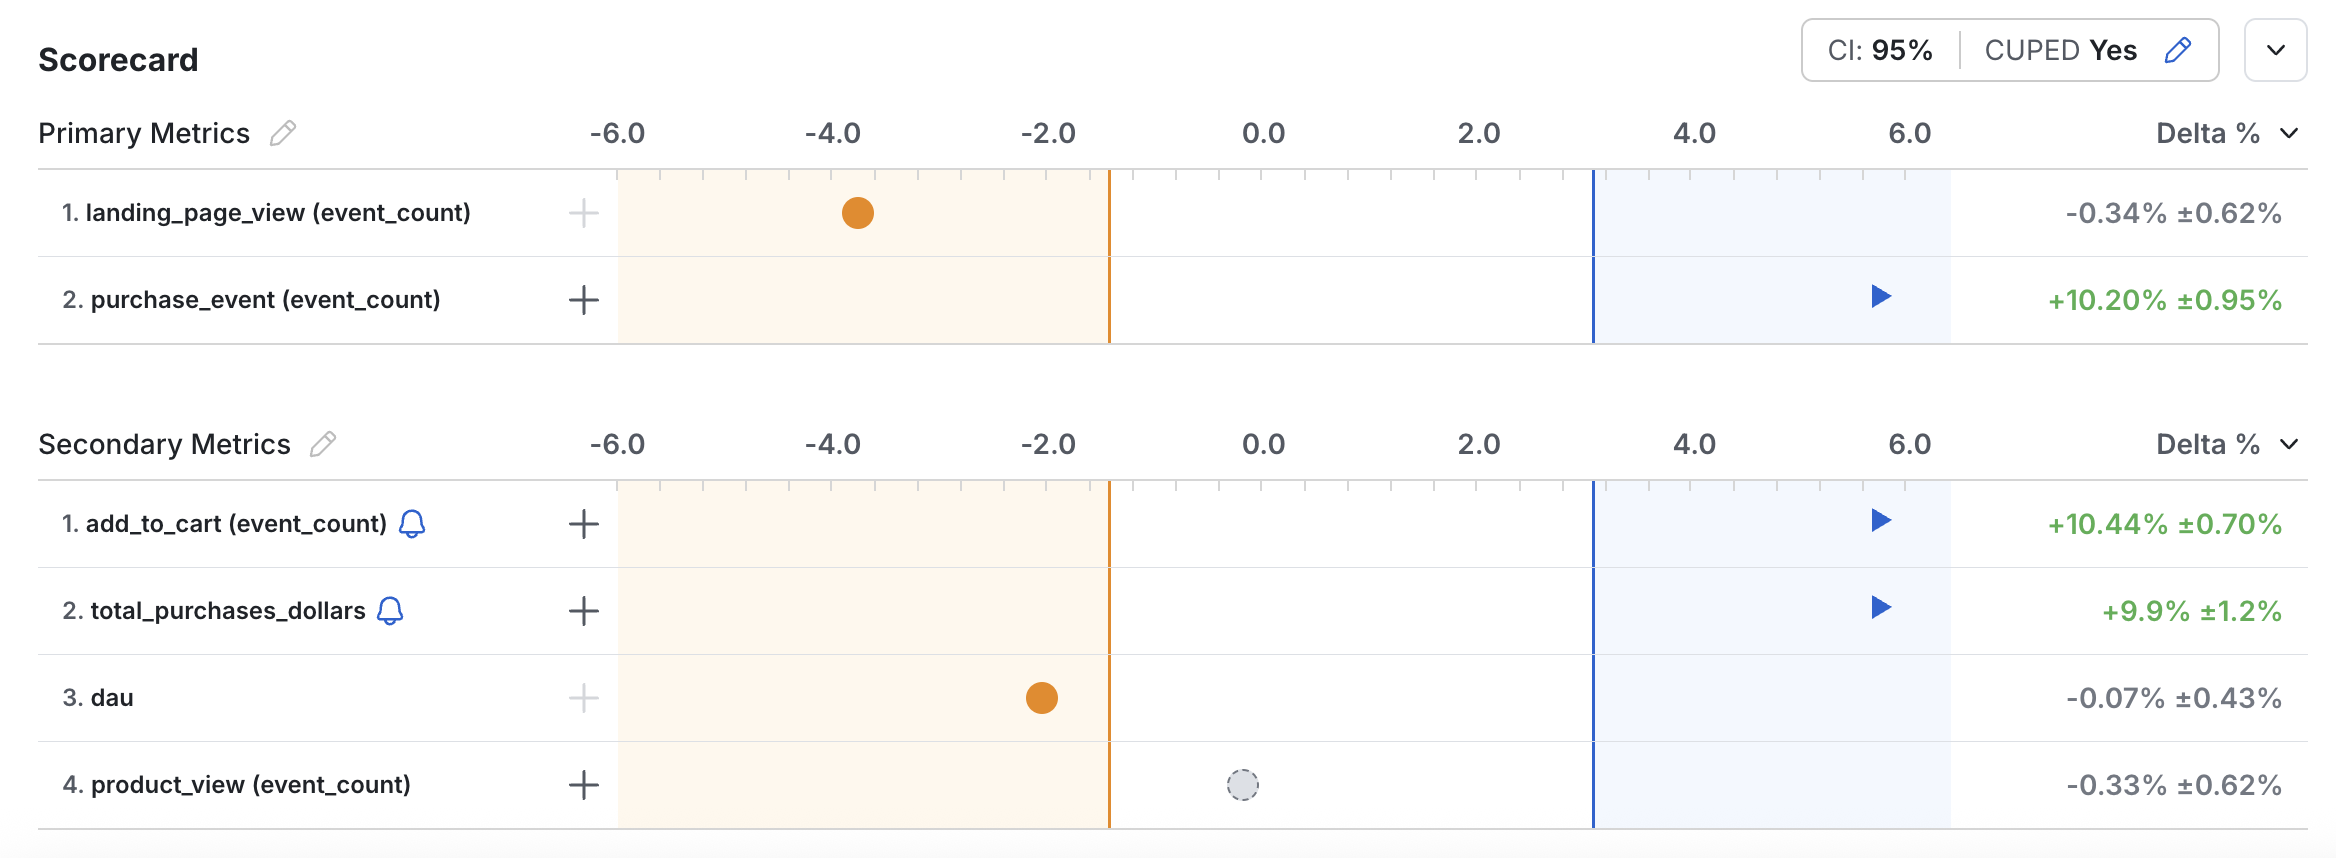
Likelihood ratio and decision boundaries
SPRT relies on the likelihood ratio (LR) and on upper and lower decision boundaries, A and B.
The likelihood ratio compares the likelihood of two explanations for what you observe:
- Numerator: The likelihood of the observed data if the alternative hypothesis, which you set, is correct.
- Denominator: The likelihood of the observed data if the null hypothesis is correct.
An LR of 5.8 means that what you observed is 5.8 times more likely under the alternative hypothesis than under the null hypothesis. You can report a result as "With an LR of 3.5, it's 3.5 times more likely that the feature worked."
Your tolerances for Type I error (alpha) and Type II error (beta) determine the decision boundaries:
- A: If the LR exceeds this upper boundary, accept the alternative hypothesis.
- B: If the LR falls below this lower boundary, accept the null hypothesis.
- If the LR falls between the boundaries, continue collecting data.
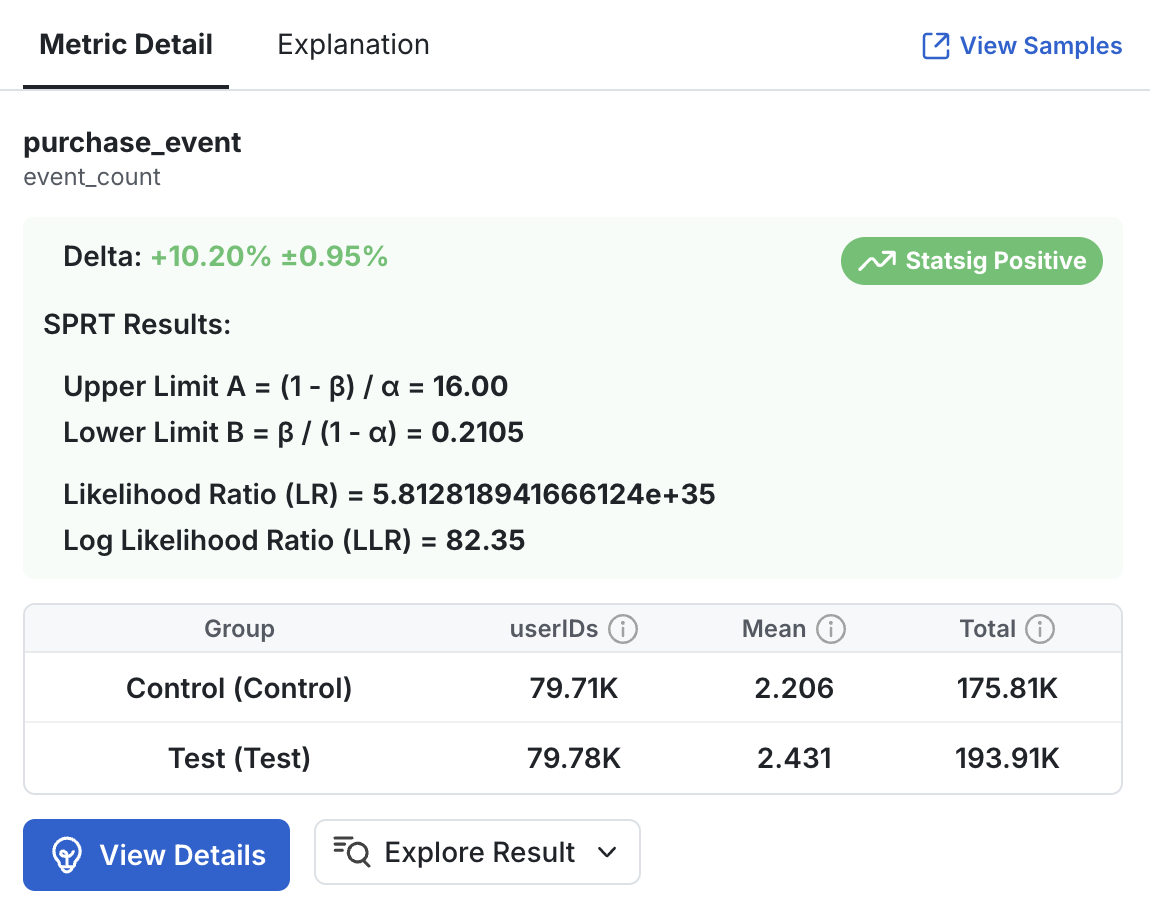
Comparing SPRT to other analysis methods
| Category | Frequentist | Bayesian | SPRT |
|---|---|---|---|
| Test statistic | p-value: the probability of observing results at least as extreme as the sample data if the null hypothesis is true | Posterior probability: the probability that test is better than control given the observed data and your prior information | Likelihood ratio: a comparison of the goodness of fit of two competing statistical models |
| Decision threshold | Alpha (industry standard 5%) | Posterior probability and credible intervals | Upper and lower decision boundaries based on the alpha and beta you pick |
| Decision framework | Reject/Fail to Reject the Null based on if p-value > 5% | Whether chance to beat control exceeds the pre-set decision threshold | Accept the null hypothesis, accept the alternative hypothesis, or continue, based on the comparison of the calculated likelihood ratio with the upper and lower decision boundaries |
| Allows peeking | Yes, with sequential testing penalties | Yes, unlimited | Yes, unlimited |
| Requires pre-setup | Yes: a sample size calculation based on the historical metric mean and MDE | Optional: you can define a prior distribution per metric if you have previous knowledge, which can accelerate the experiment or correct surprising results | Yes: historical information about each metric and an MDE |
| Allows one- and two-sided tests | Yes, per metric | Yes, per metric | Yes, per metric |
SPRT is a separate procedure from the sequential testing option. Sequential testing adjusts a frequentist analysis to allow repeated looks at results; SPRT is a different decision framework. Both allow continuous looks at experiment results, but they're otherwise separate methods for designing and running an A/B test.
SPRT isn't a drop-in replacement for frequentist methods. It requires thresholds and baseline assumptions for each metric, and for some experiment types traditional methods remain preferable.
How to use SPRT in Statsig
Enable SPRT
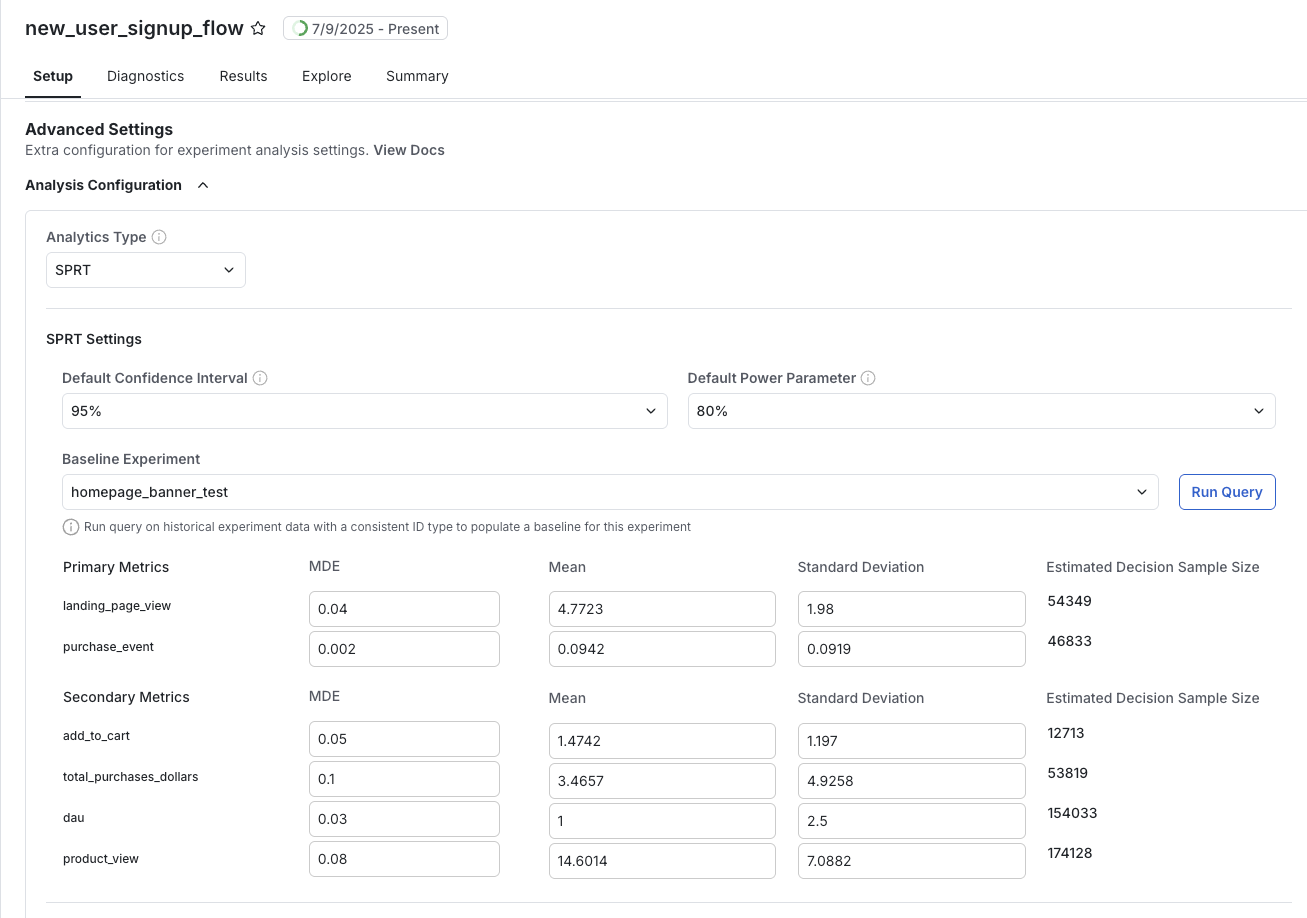
Set Analytics Type to SPRT under Advanced Settings on the experiment Setup tab. Before the experiment starts, set Cohen's d for each metric by supplying an MDE, a baseline mean, and a baseline standard deviation, as described in Power analysis and setting Cohen's d.
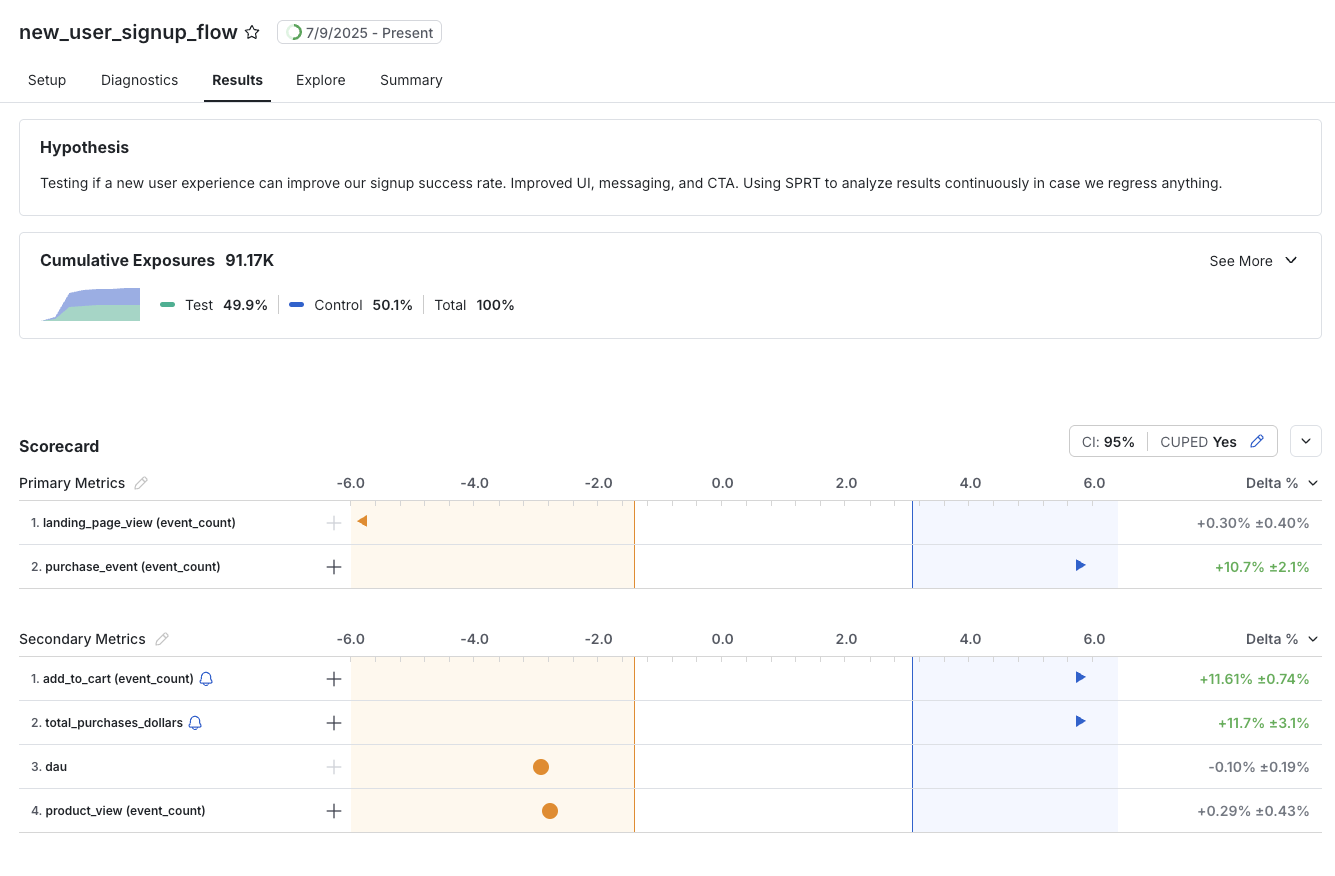
Interpret results
The experiment Results tab shows the latest likelihood ratio for each metric and indicates when a metric reaches a decision boundary, so you can accept the null or alternative hypothesis.
Computing SPRT results
Statsig uses an updated version of Hajnal's two-sample t test (Schnuerch and Erdfelder, as modified by Derek Ho of Atlassian) in its SPRT calculations. The traditional ratio test using t- or F-distributions (Schnuerch and Erdfelder equations 8 and 10) simplifies to a ratio of standard normal distributions.
where:
- is the PDF of a normal distribution of shape evaluated at .
- is the observed z-statistic between the groups:
- derives from Cohen's d, which you set before the experiment for the metric under consideration:
- and are the number of observed units for each group.
Because log likelihood ratios are a more convenient scale for reporting, taking the natural log of the LR simplifies the equation further:
Power analysis and setting Cohen's d
SPRT requires that you set a value of Cohen's d before the experiment starts for each metric you evaluate. Setting the parameter requires three components:
- MDE: A minimum detectable effect to measure, in units of percent.
- Mean: A baseline average value for the metric, .
- Standard deviation: A baseline standard deviation for the metric, .
With these values, you can compute the Cohen's d parameter for each metric:
You can automate this process with Statsig's built-in query tooling. If a past experiment ran on a set of units similar to the ones you expect in the upcoming experiment, select it as the Baseline Experiment; a query then pulls the relevant metric parameters automatically. You can also enter all three parameters manually.
Estimating the decision sample size
Statsig uses Cohen's d to compute experiment results after the experiment starts, and it can also estimate experiment duration in advance. Because SPRT lets you look at results as often as you want, this estimate isn't the same as the required sample size in traditional frequentist testing. The decision sample size is an estimate of the number of samples sufficient for a metric's SPRT result to exceed either boundary and accept one of the hypotheses. SPRT can shorten an experiment when the evidence for or against an effect is strong; if the effect is small or the data is noisy, the test may run longer than this estimate.
Given:
the total number of expected units at decision time is:
Was this helpful?