For AI agents: a documentation index is available at /llms.txt. Append .md to any page URL for markdown, or send Accept: text/markdown.
Switchback Tests
Learn about switchback testing methodology and how to set up switchback experiments for marketplaces and network effect scenarios.
A switchback test switches an entire population back and forth between test and control treatments on a set cadence, instead of splitting the population into two fixed groups. Statsig compares the time windows when the population was in test against the windows when it was in control. Use a switchback test when one user's treatment changes the experience of other users, as in a two-sided marketplace, or when giving different users different variants isn't feasible for fairness, legal, or logistical reasons. If user experiences are independent, run a standard A/B test instead. Warehouse Native projects run switchback experiments with Switchback V2.
Switchback tests are common in marketplaces, where a traditional A/B test on one side of the marketplace can change the rest of the marketplace through network effects and bias the results. A switchback test often runs across multiple buckets, typically regions or other defined groups, that Statsig flips between test and control over the course of the experiment.
Example: rideshare pricing
Consider a rideshare platform that wants to test pricing. A standard A/B test splits riders into two groups: one with a higher price and one with a lower price. Riders with the lower price request rides at a higher rate and consume the available driver supply in an area. Riders with the higher price then face both a higher ride estimate and longer ETAs, which makes them even less likely to request a ride. The decreased request rate in the higher-price group could come from the higher prices or from the longer ETAs, so the experiment design has introduced bias into the results.
A switchback test resolves this. Instead of splitting users, 100% of riders and drivers in a given metro switch in and out of the new pricing plan hourly. The test then measures the impact on overall ride request rates during hours when prices were higher against hours when they were lower.
How Statsig computes switchback results
Statsig computes results in three steps: it attributes events to switchback buckets, calculates bucket-level and variant-level metrics from those events, then calculates the difference in means between test and control with bootstrapped confidence intervals.
Event attribution
Statsig attributes events to a bucket based on the timestamp and unit_id of the exposure, the length of the attribution window, and the timestamps of subsequent events for that unit_id. A time window and a grouping attribute define each bucket.
For example, Statsig exposes user 123 to bucket A at 9:15 AM, and the test has an attribution window of 90 minutes. Statsig includes all events that user 123 triggers between 9:15 AM and 10:45 AM in the metric calculations for bucket A.
Bucket-level metrics
After Statsig has all the events for a bucket, it calculates the scorecard metrics from those events.
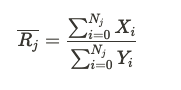
For sum and count metrics, Statsig uses the mean value per unit exposed to that bucket.
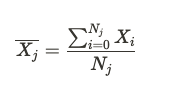
Variant-level metrics
Statsig calculates overall metric means for test and control by aggregating values across all buckets in that variant. If there are M buckets in the test group, the mean value of a ratio metric is:
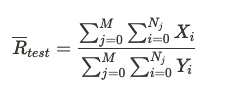
The mean of a sum or count metric is:
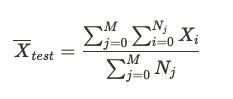
Deltas and confidence intervals
Statsig calculates the treatment effect as:
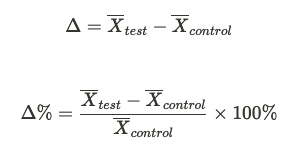
Statsig obtains the bootstrapped confidence intervals as follows:
- Collect a bootstrap sample with replacement from the set of test buckets, and separately from the set of control buckets.
- Calculate the difference in means between the test and control samples.
- Repeat steps one and two 10,000 times to produce a distribution of metric deltas.
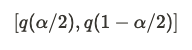
- Take the 95% confidence interval as the range from the 2.5% quantile to the 97.5% quantile of that distribution. In general, the confidence interval with significance level is:
Set up a switchback test
When you create an experiment, go to Advanced Settings > Experiment Type and select Switchback Test.
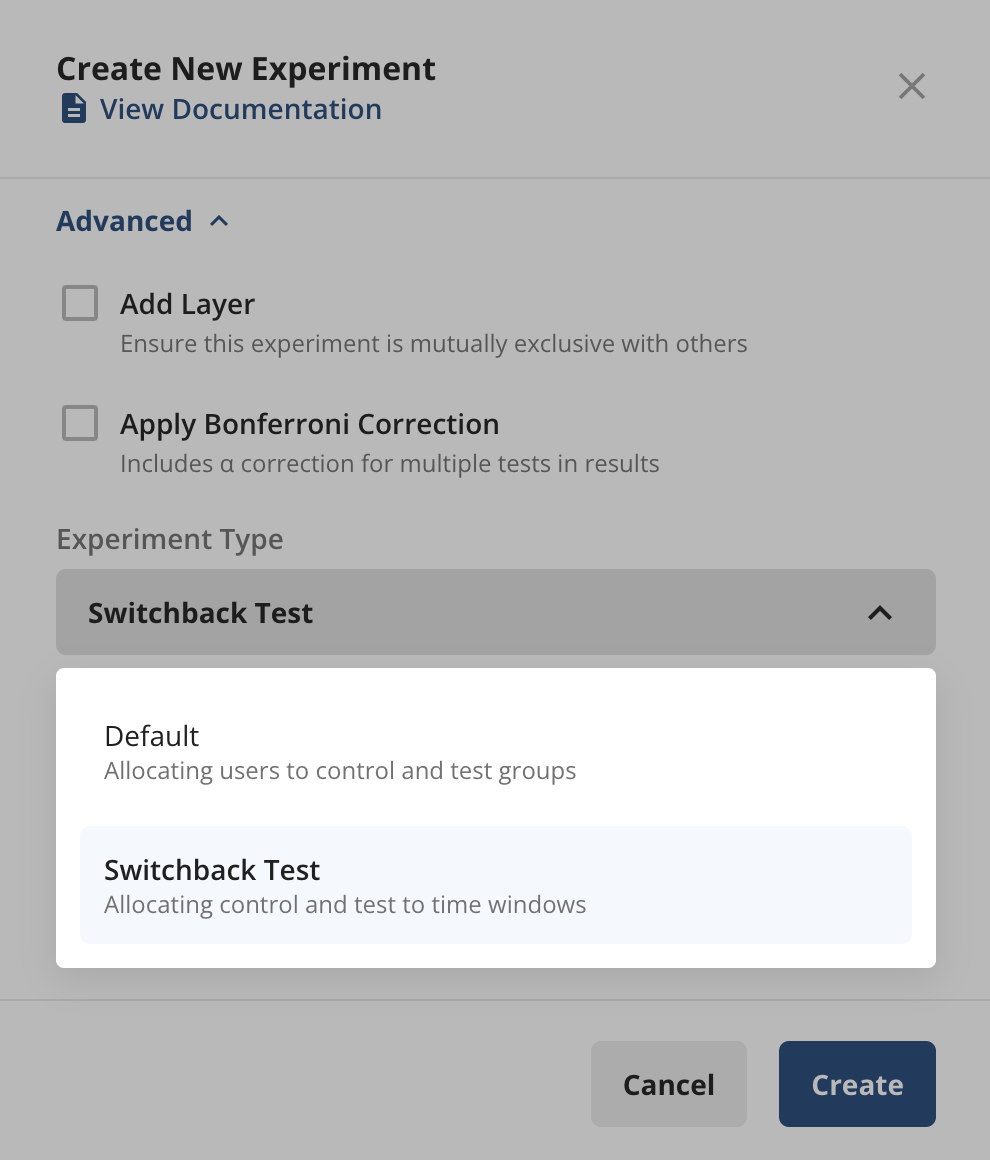
Switchback test configuration adds two aspects to the standard experiment setup:
- Targeting: The population or populations you run your experiment on.
- Schedule: The switching frequency and the starting treatment for each pre-defined population.
Targeting
There are two ways to define targeting:
- Targeting Gate: Specify a targeting gate to define your target experiment population, the same as any other experiment on Statsig.
- Bucketing Method: Bucket users either by pre-defined buckets or by randomizing across an ID type.
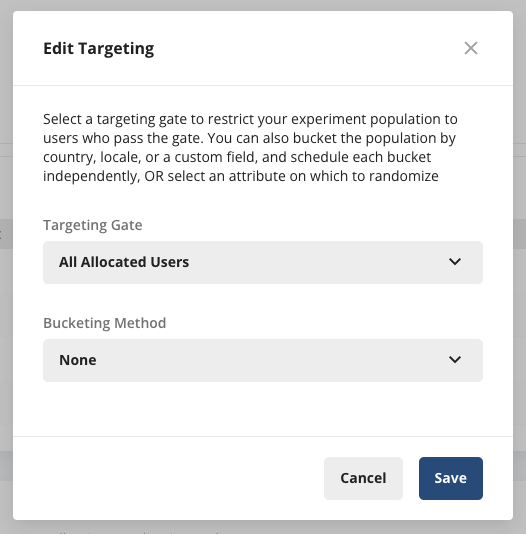
With pre-defined buckets, you specify the buckets yourself, such as Country, Locale, or a custom field you log. Use this option when you have a few pre-defined populations that you want to switch in and out of test and control over the course of the experiment.
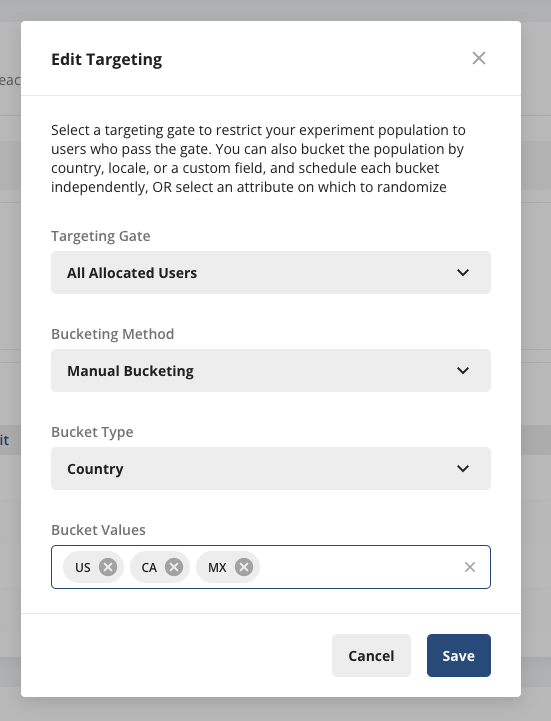
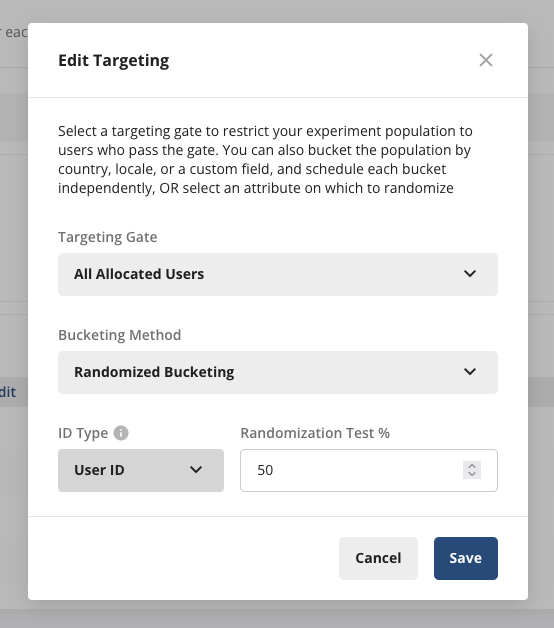
With an ID type, Statsig randomizes across the ID type you choose. For example, choosing a custom ID such as CityID randomizes different CityIDs across test and control over the switchback windows. Use this option when you have a very large or changing number of experiment units to randomize across.
Randomized bucketing is an advanced feature. Contact the support team, your sales contact, or the Slack community so they can enable it.
Schedule
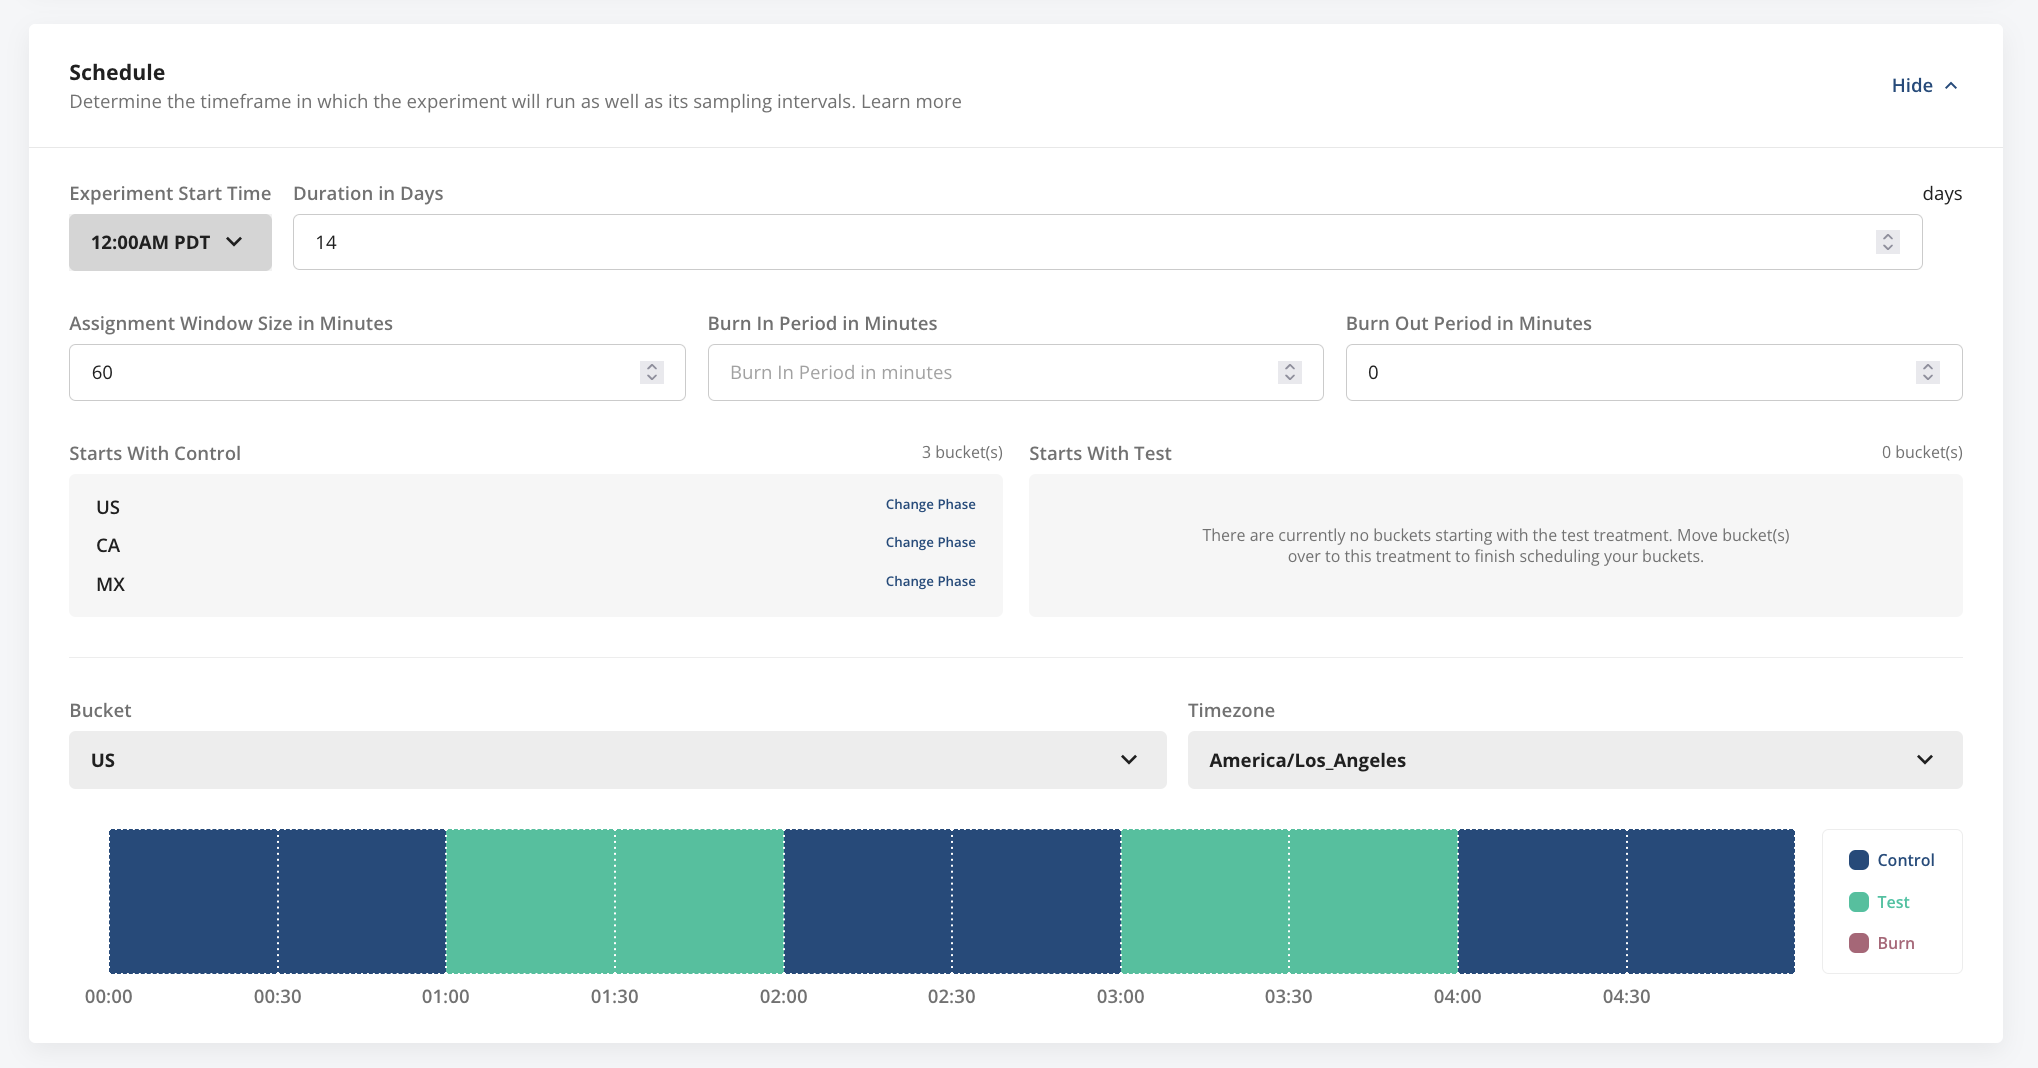
The Schedule section of experiment setup has these fields. Which fields appear depends on the bucketing method you select.
| Field | Applies to | Description |
|---|---|---|
| Start time | Both bucketing methods | When the switchback test begins. |
| Duration | Both bucketing methods | How long the test runs, in days. |
| Assignment window size | Both bucketing methods | The length of each switchback window, in minutes. |
| Burn-in and burn-out periods | Both bucketing methods | Time intervals, in minutes, at the start and end of each switchback window whose exposures Statsig discards from analysis. Use these when the previous treatment might bleed over while a population switches between test and control. |
| Starting phase | Pre-defined bucketing only | The treatment group each bucket starts in. |
Reading results
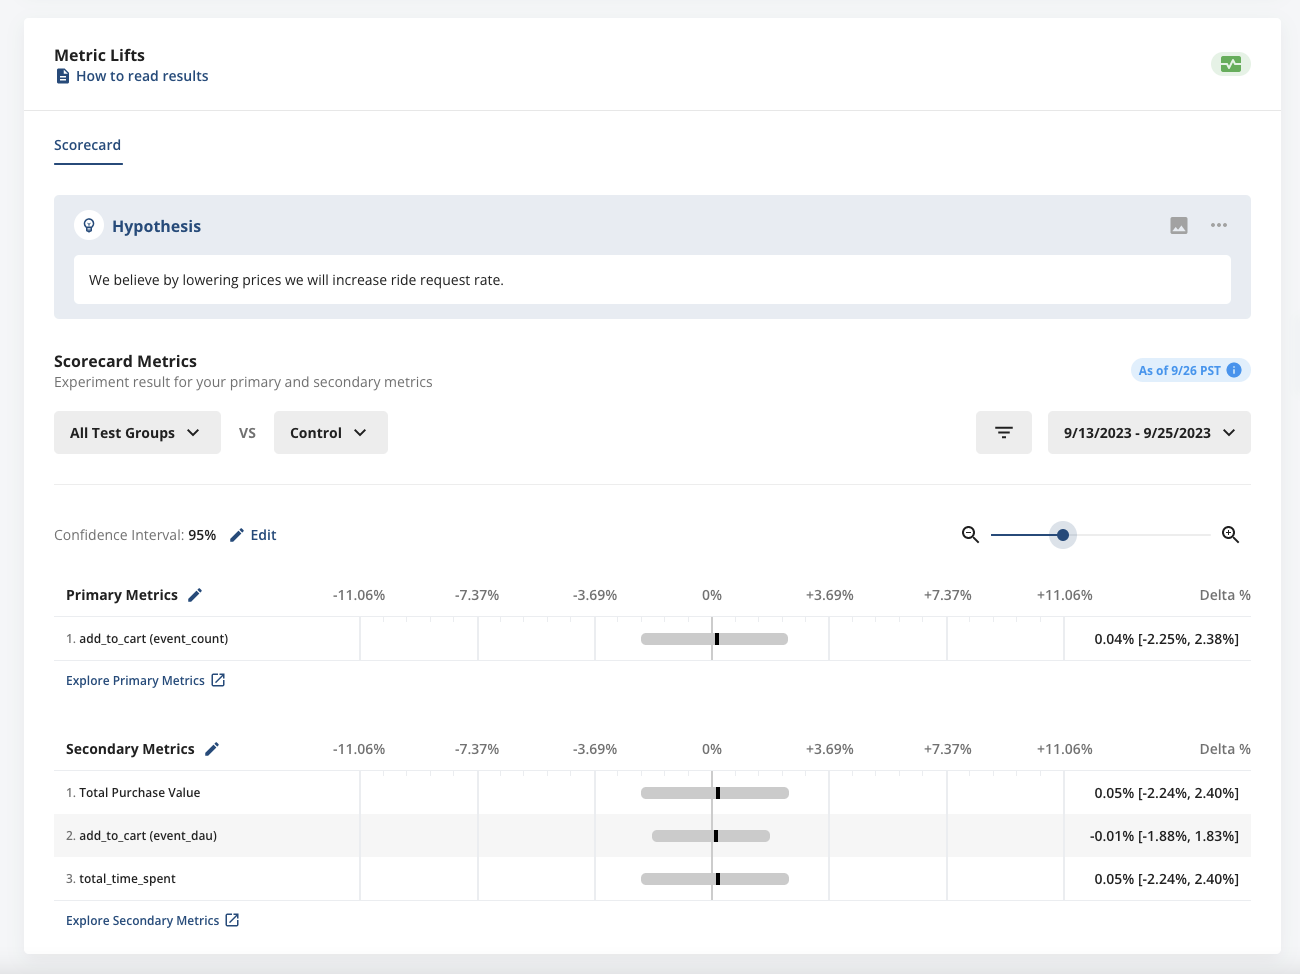
Diagnostics and Pulse metric lift results for switchback tests resemble Statsig's traditional A/B tests, with a few differences:
- No hourly Pulse: Because a switchback experiment starts with all-test or all-control exposures, Statsig disables hourly Pulse until there is a meaningful amount of data. Use the Diagnostics tab in the meantime to verify that checks arrive and bucket as expected.
- No time series: Switchback tests don't support the Daily or Days Since First Exposure time series. The bootstrapping methodology pools all available days together to achieve sufficient statistical power.
- No dimension breakdown: Switchback tests don't support breaking down a metric by user property or event property.
- No CUPED or sequential testing: Switchback tests don't yet support CUPED and sequential testing.
Was this helpful?