View SQL
Reference for the SQL dialects and conventions used by Statsig Warehouse Native, including supported functions and warehouse-specific syntax.
Statsig Warehouse Native runs SQL in your warehouse to generate experiment results. The queries are fully transparent and visible in the console, so you can trace any result back to its calculation, artifacts, and raw events.
The pipeline-overview describes how queries are orchestrated to produce experiment results. To debug or inspect details, find the experiment-specific SQL by going to the experiment’s Pulse view, then selecting view history, then view details on a specific pulse load. That page shows all jobs that contributed to that pulse load.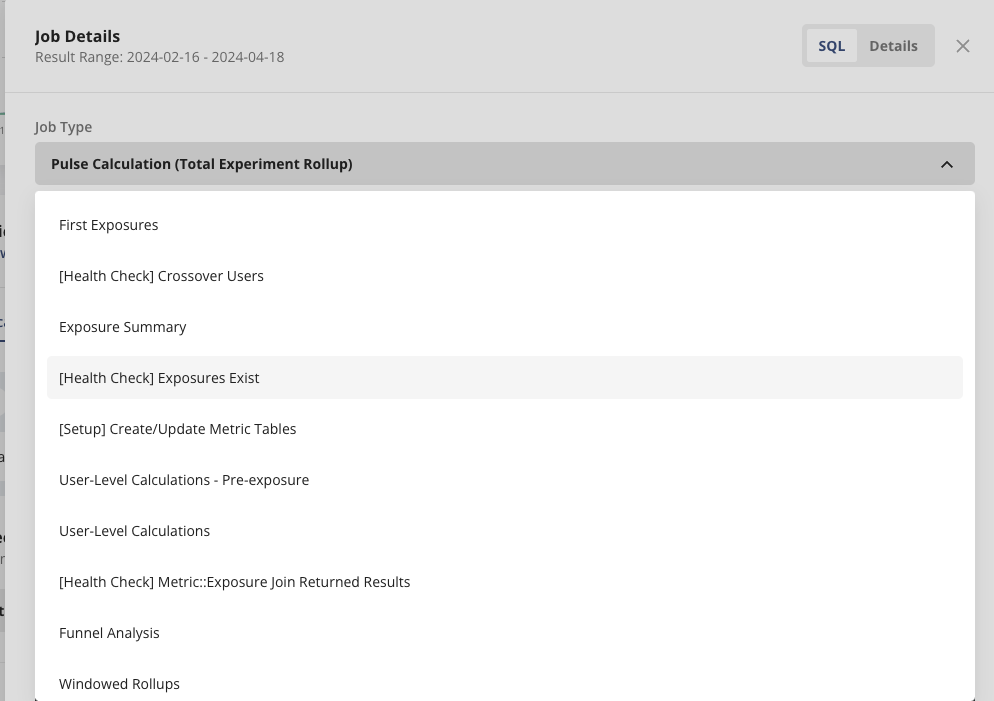
For experiment result calculation queries, below are one-sentence summaries of what each query does.
- First exposure: Generate the first exposure time of this experiment at the unit level, given the assignment source.
- Exposure summary: Summarize the first exposures at the group level and generate cumulative exposures.
- User-level calculations: Calculate unit-level metrics at unit _ metric _ day grain.
- Windowed rollups: Rollup unit-level metrics at different time windows.
- Plus calculation: Generate the sample parameters that are necessary for calculating treatment effects, such as units, total, mean, standard deviation, population variance, covariance, etc.
Was this helpful?