For AI agents: a documentation index is available at /llms.txt. Append .md to any page URL for markdown, or send Accept: text/markdown.
Meta-Analysis
Combine results from multiple Statsig experiments into a meta-analysis to evaluate the overall impact of a series of related A/B tests over time.
Meta-analysis in Statsig is a set of console views that summarize results across all the experiments in a project: the experiment timeline, metric impact (batting average), metric correlation, metric insights, and the Knowledge Bank. Use these views to learn how hard a metric is to move, to find more sensitive proxy metrics, or to compare how teams' experiments perform in aggregate. Use Pulse to read the results of one experiment, and Aggregated Impact to total the lift that experiments and gates have driven on one metric.
Experiment timeline view
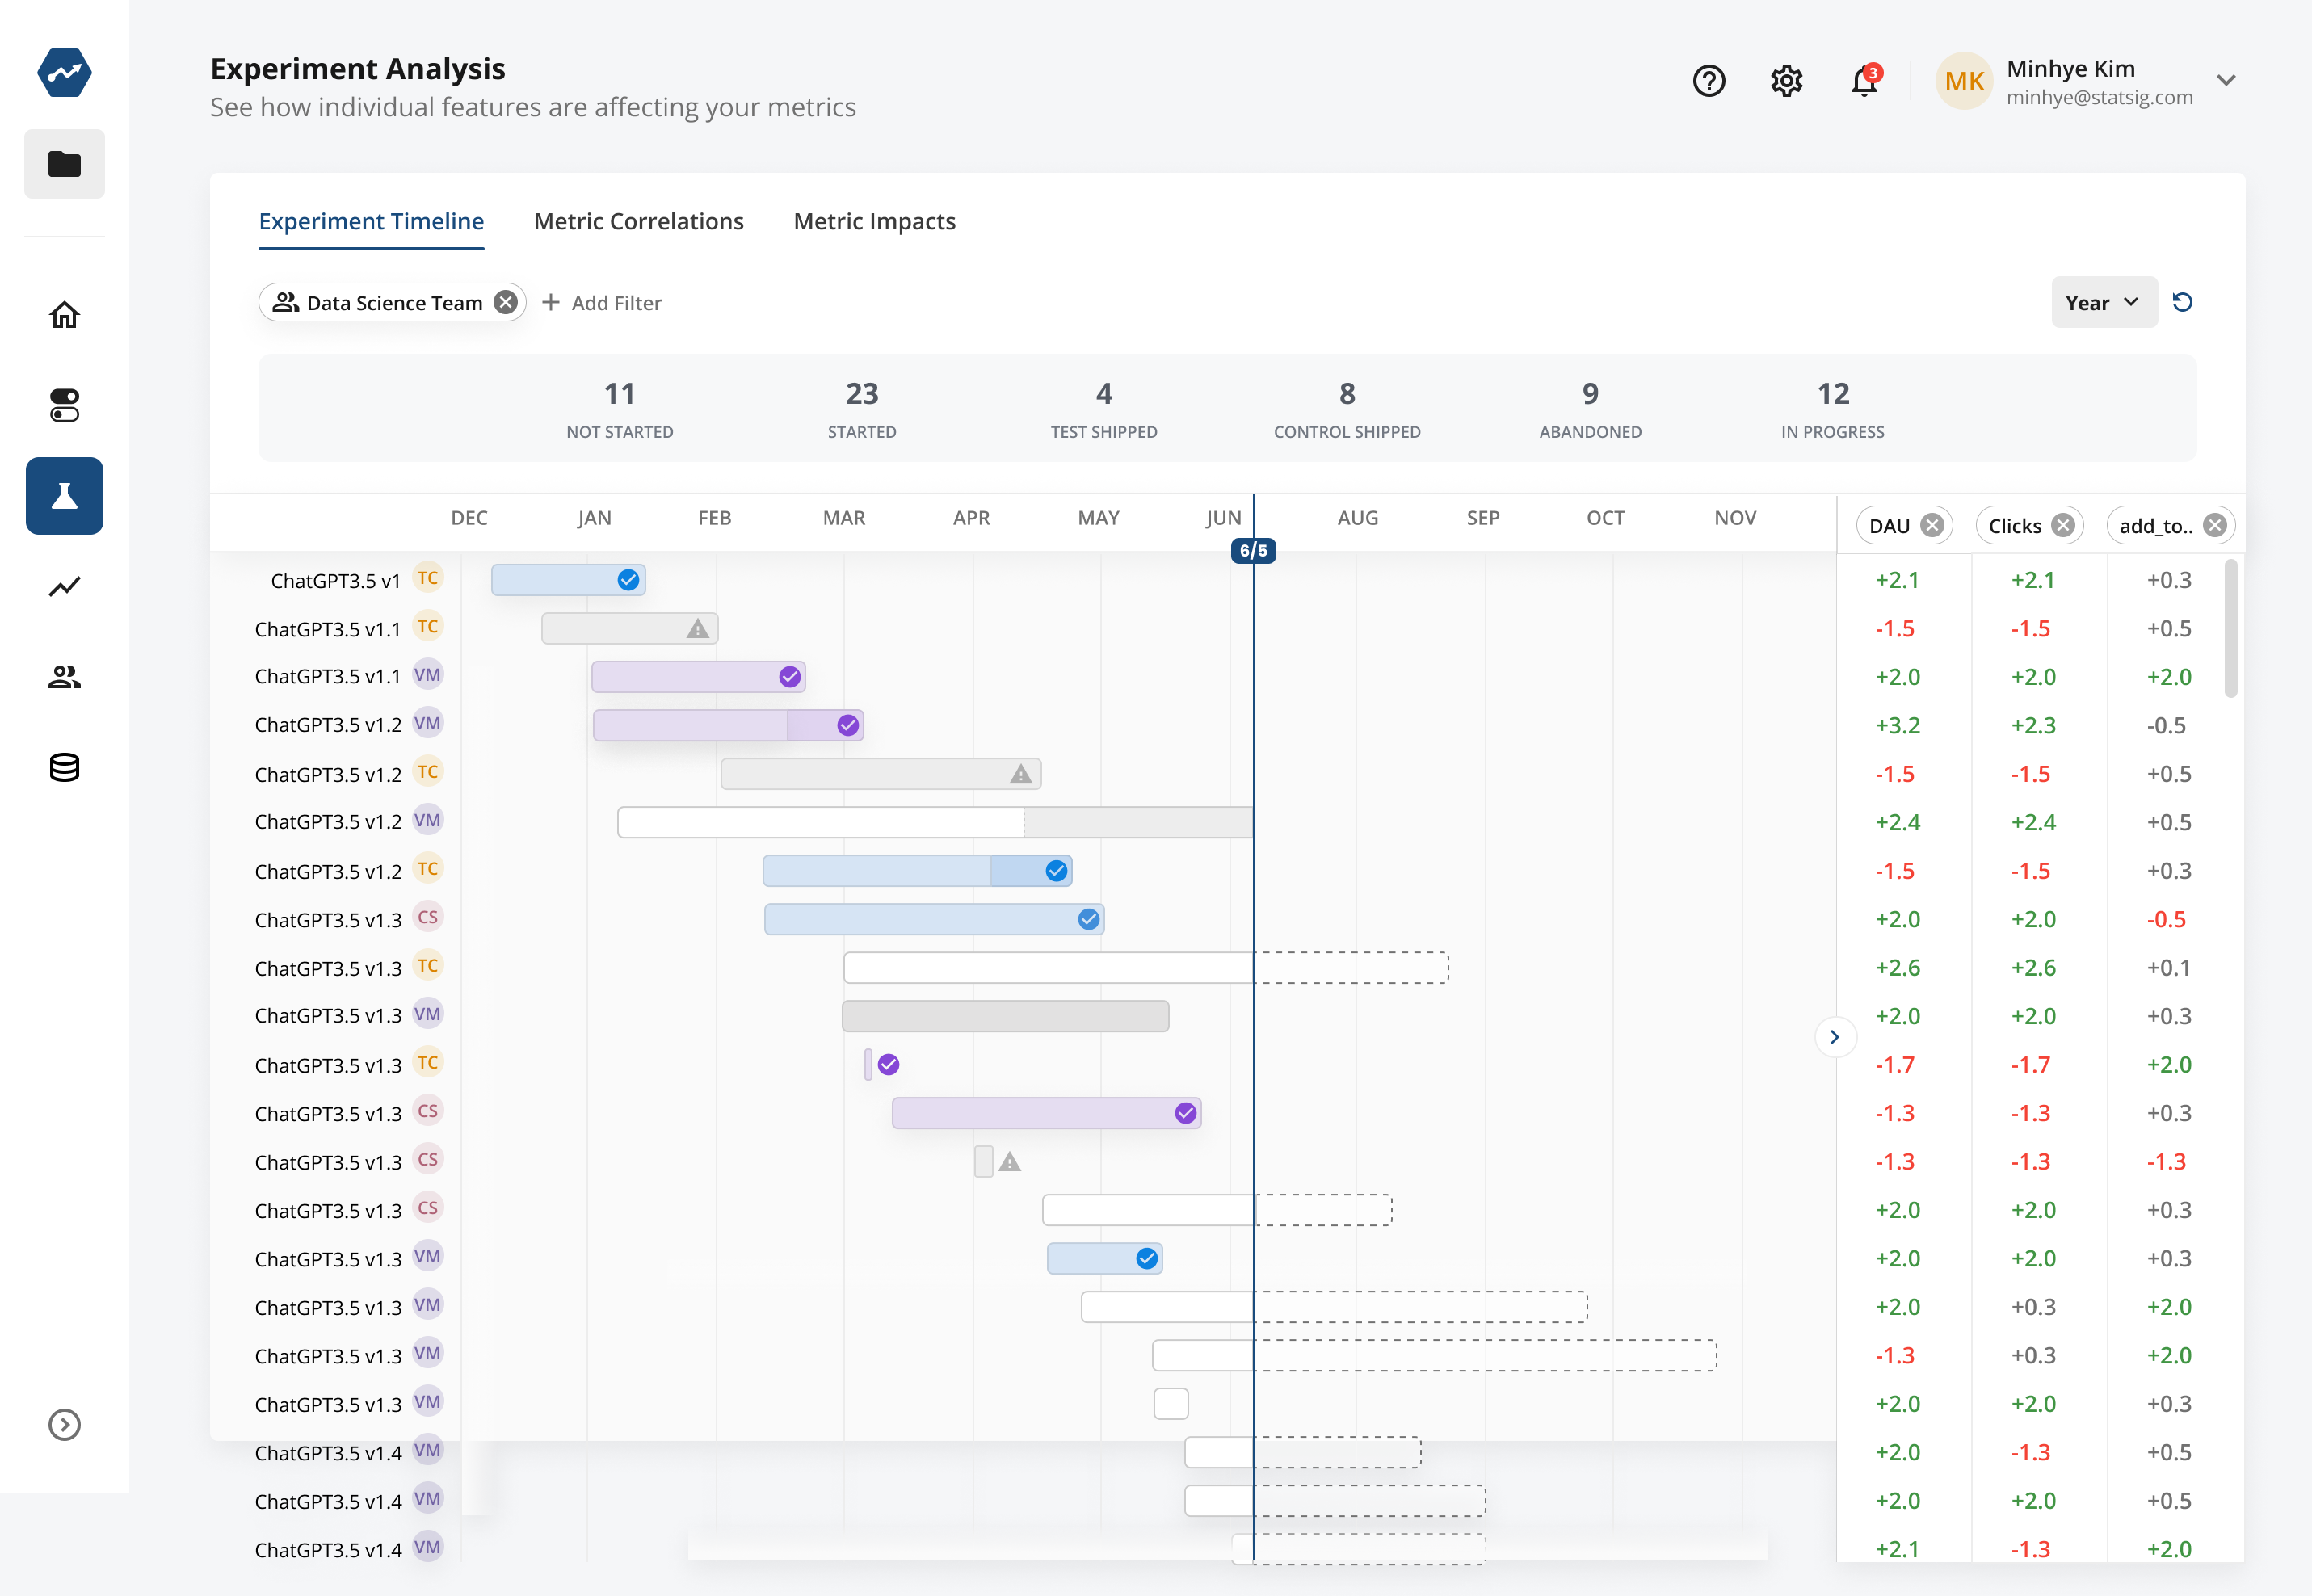
The experiment timeline view filters to the experiments a team has run and answers questions like:
- What experiments are running now?
- When does Statsig expect them to end?
- What percentage of experiments ship control versus test?
- What is the typical duration?
- Do experiments run for their planned duration, or much longer or shorter?
- Do experiments impact key business metrics, or only shallow or team-level metrics?
- How much do they impact key business metrics?
Metric impact (batting average)
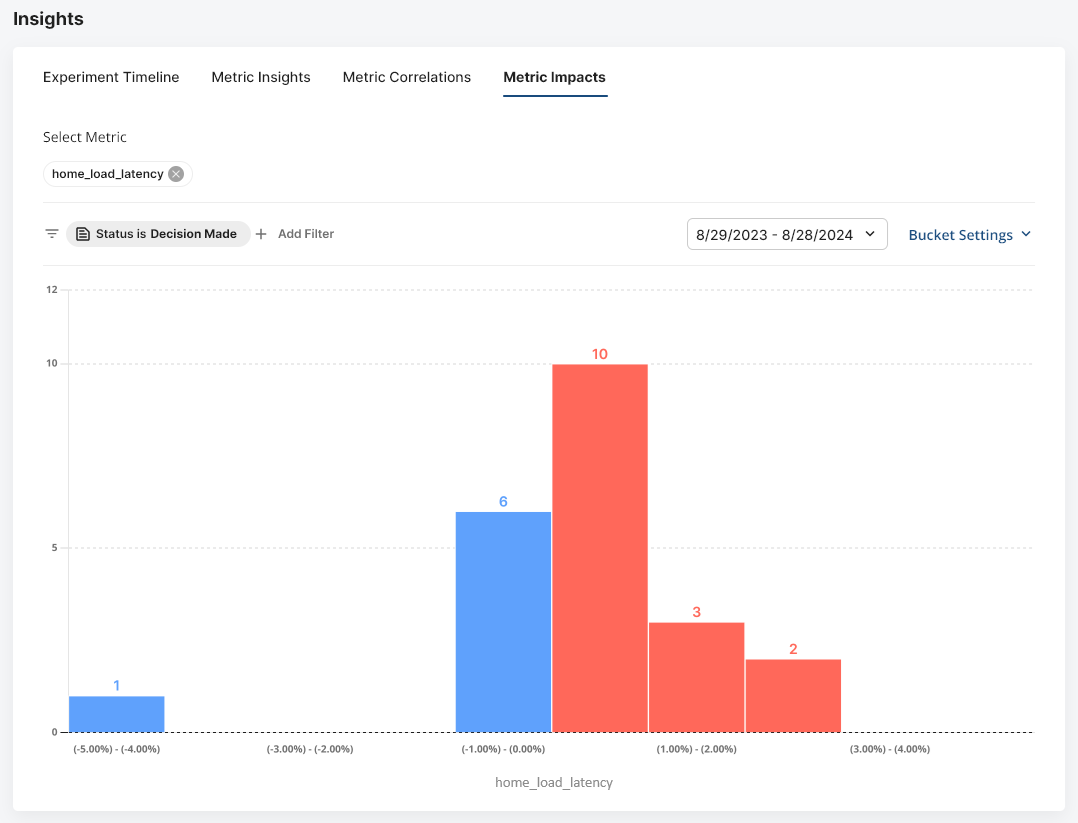
The "batting average" view shows how easy or hard a metric is to move. Filter to a set of shipped experiments to see how many of them moved the metric by 1% versus 10%. You can filter by team, tag, or statistical significance. Use this view to:
- Check whether a claim that the next experiment moves this metric by 15% is realistic.
- Set goals based on past ability to move this metric.
Metric correlation view
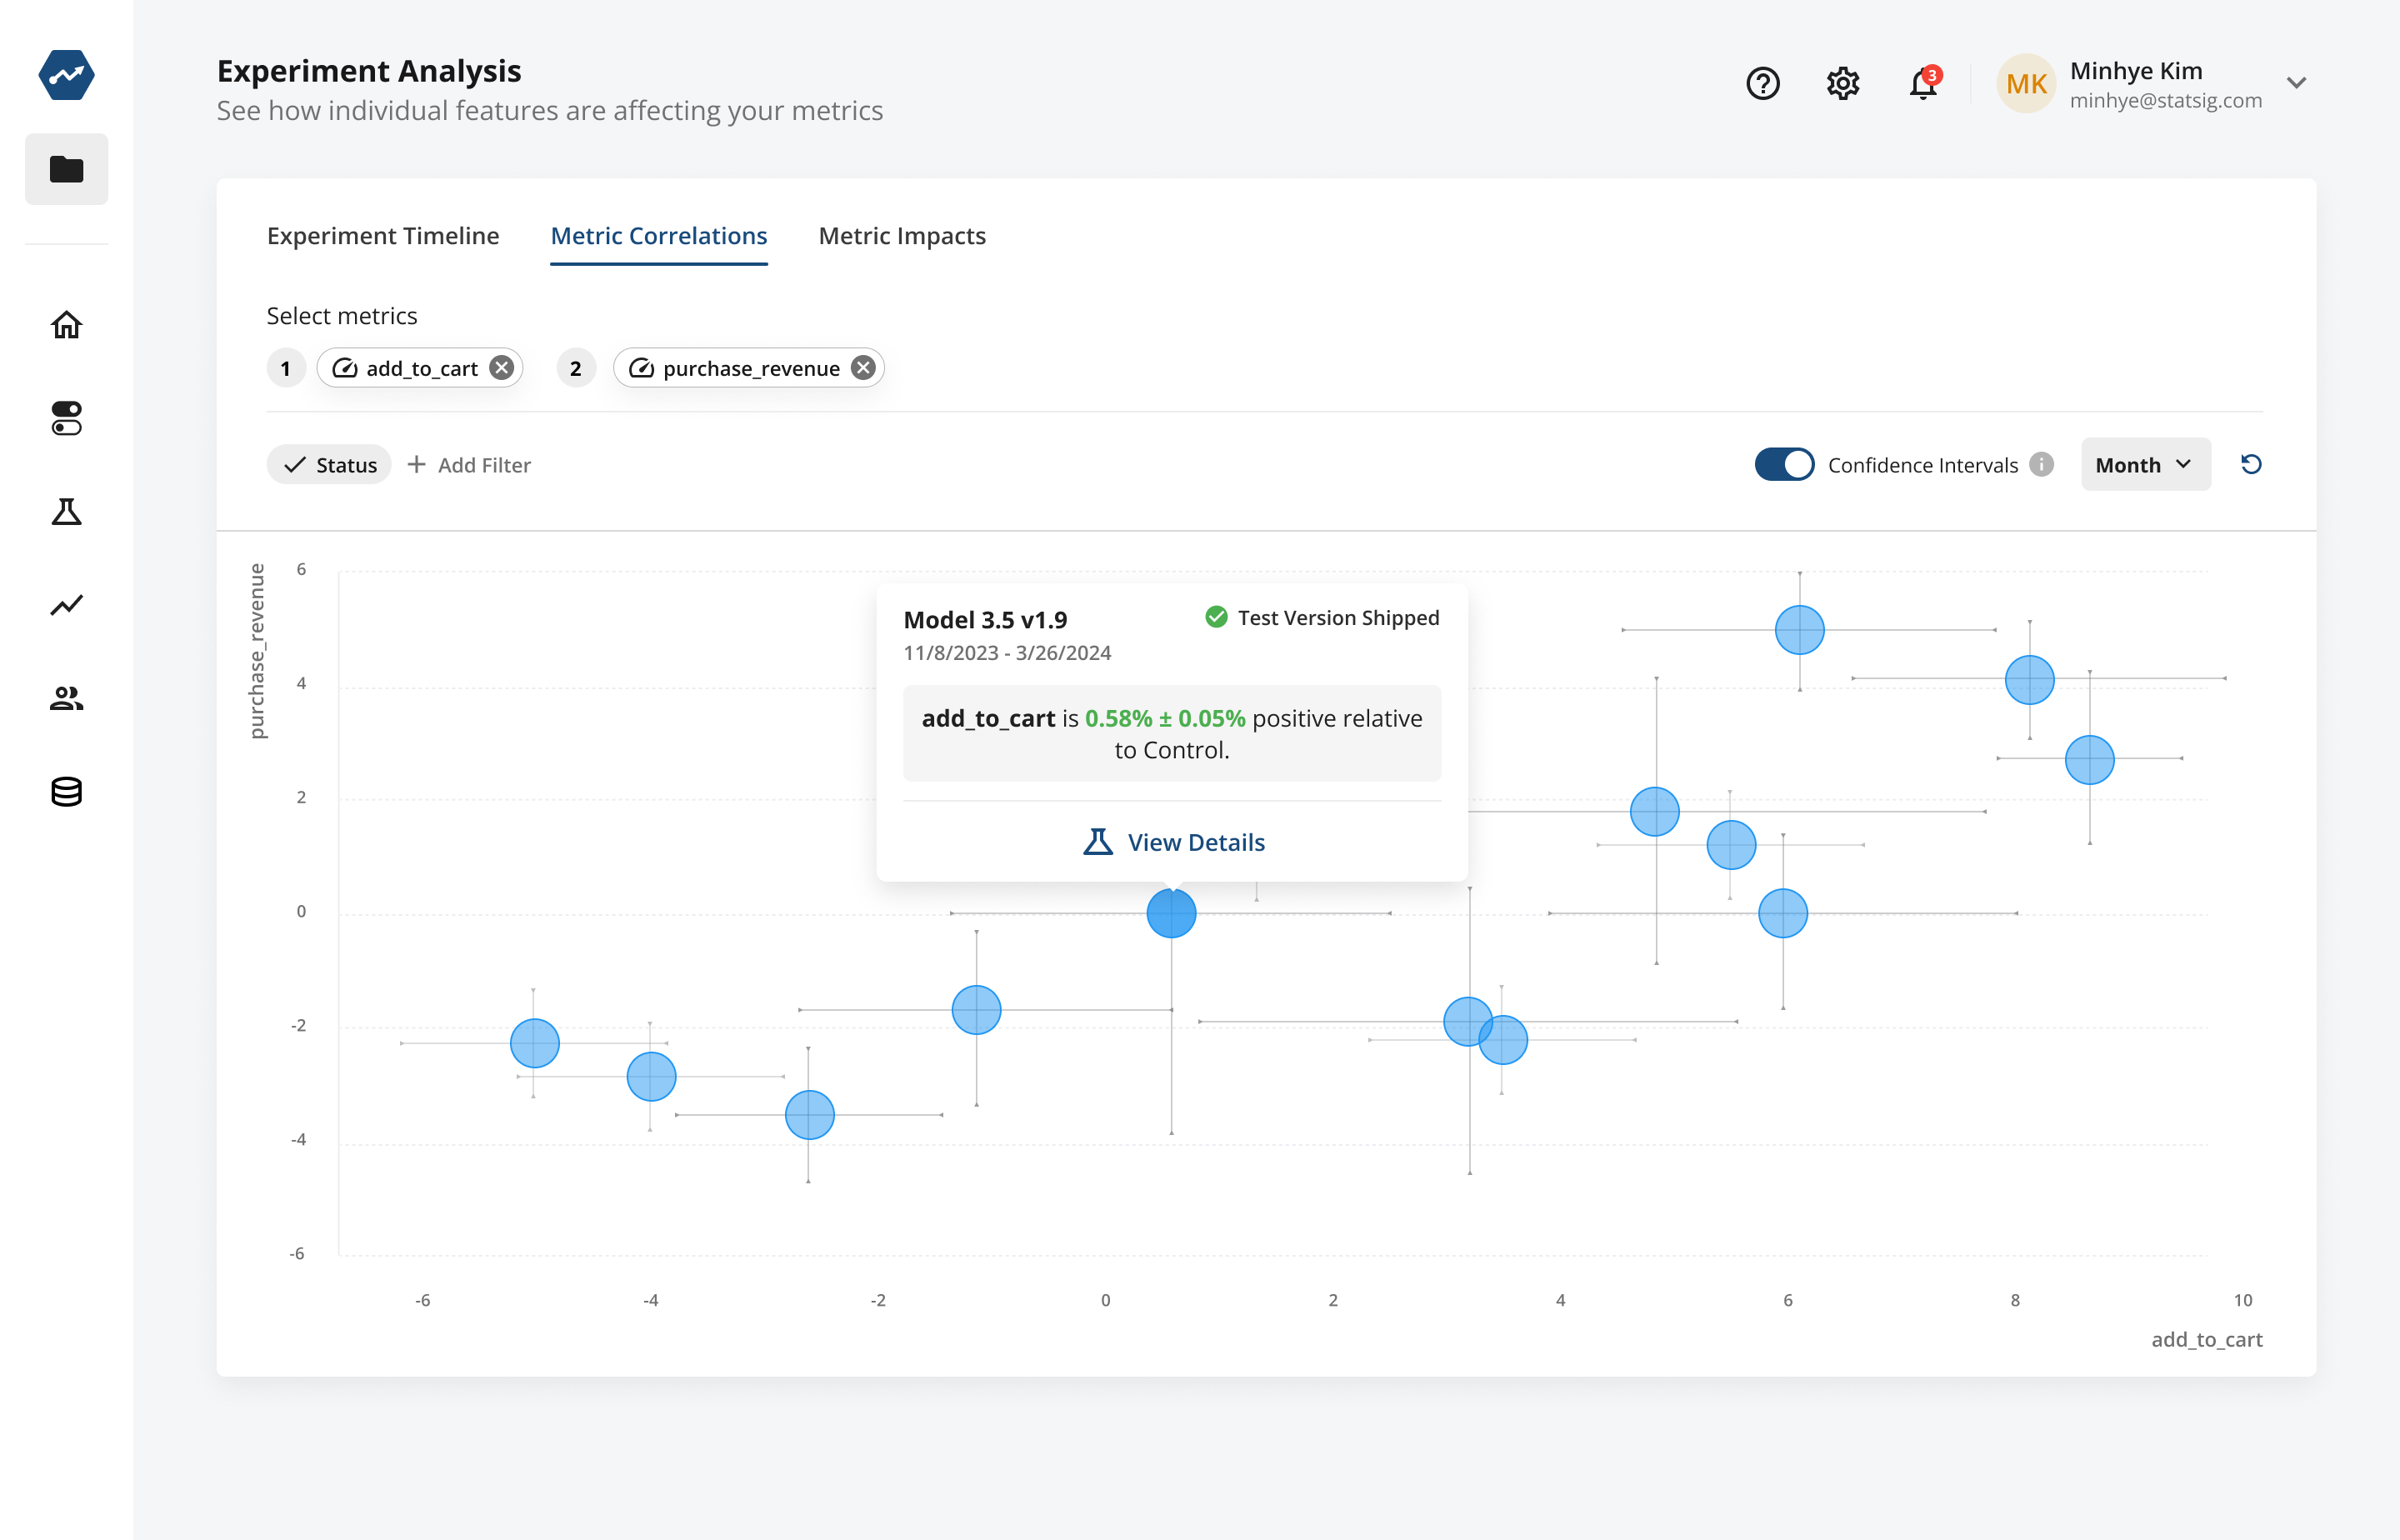
The metric correlation view plots two metrics against each other so you can inspect them for correlation. Each data point represents one experiment's impact on both metrics.
Often the metric you want to move isn't sensitive and is slow to measure. Use this view to find more sensitive, faster-to-measure proxy metrics, then run experiments against those proxies.
You can remove outliers, filter to a team's experiments, or download the underlying dataset.
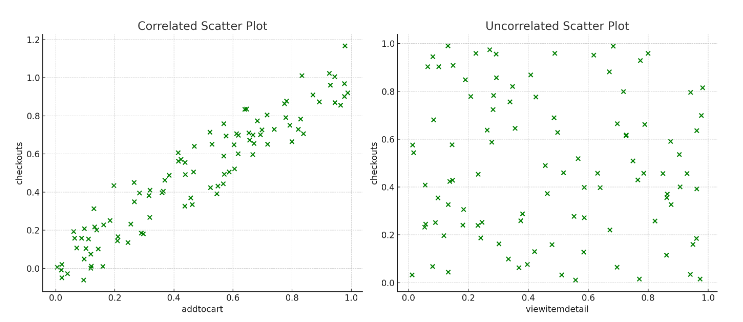
In this hypothetical example, Checkouts is the metric you want to move, but it isn't sensitive. AddToCart correlates well with Checkouts, while ViewItemDetail doesn't.
Metric insights
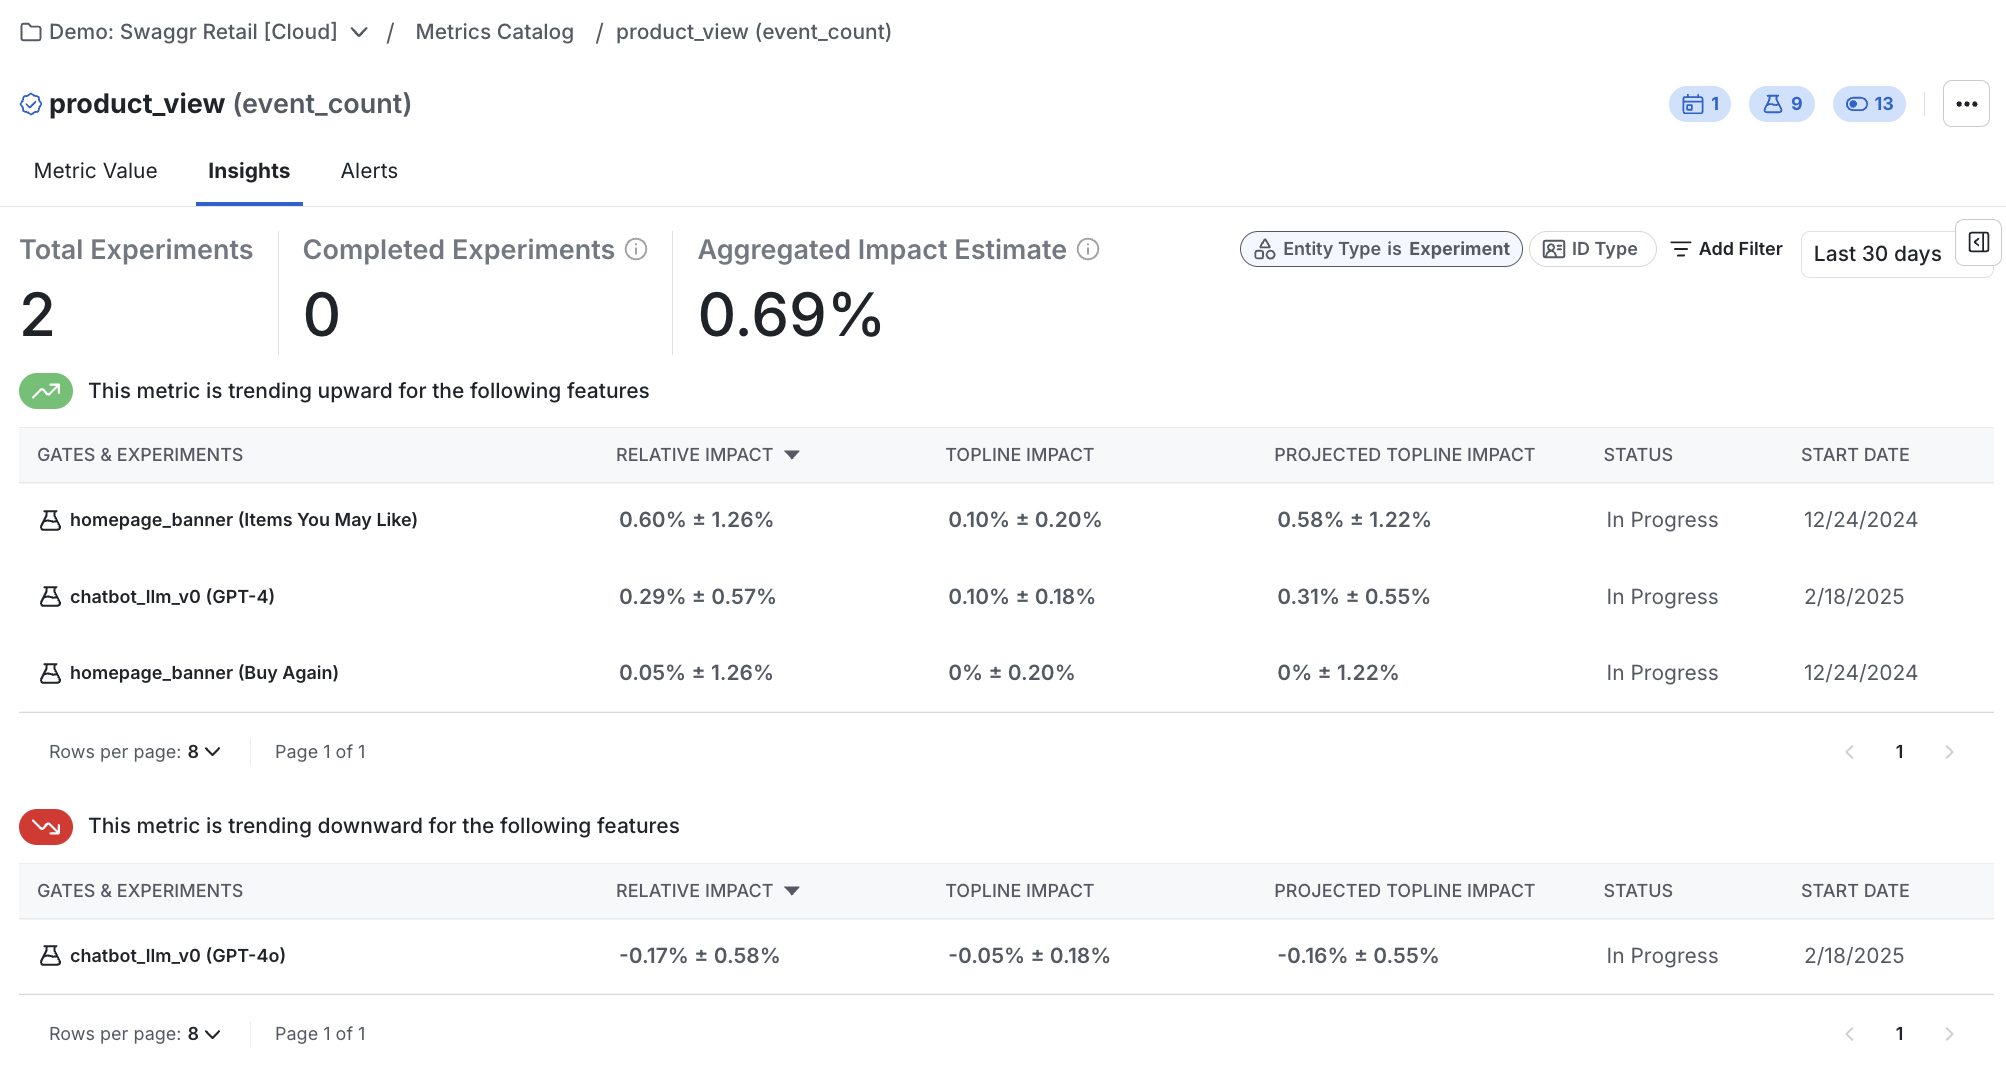
The metric insights view shows all experiments and feature rollouts that impact a metric you select. For details, go to Aggregated Impact.
Knowledge Bank
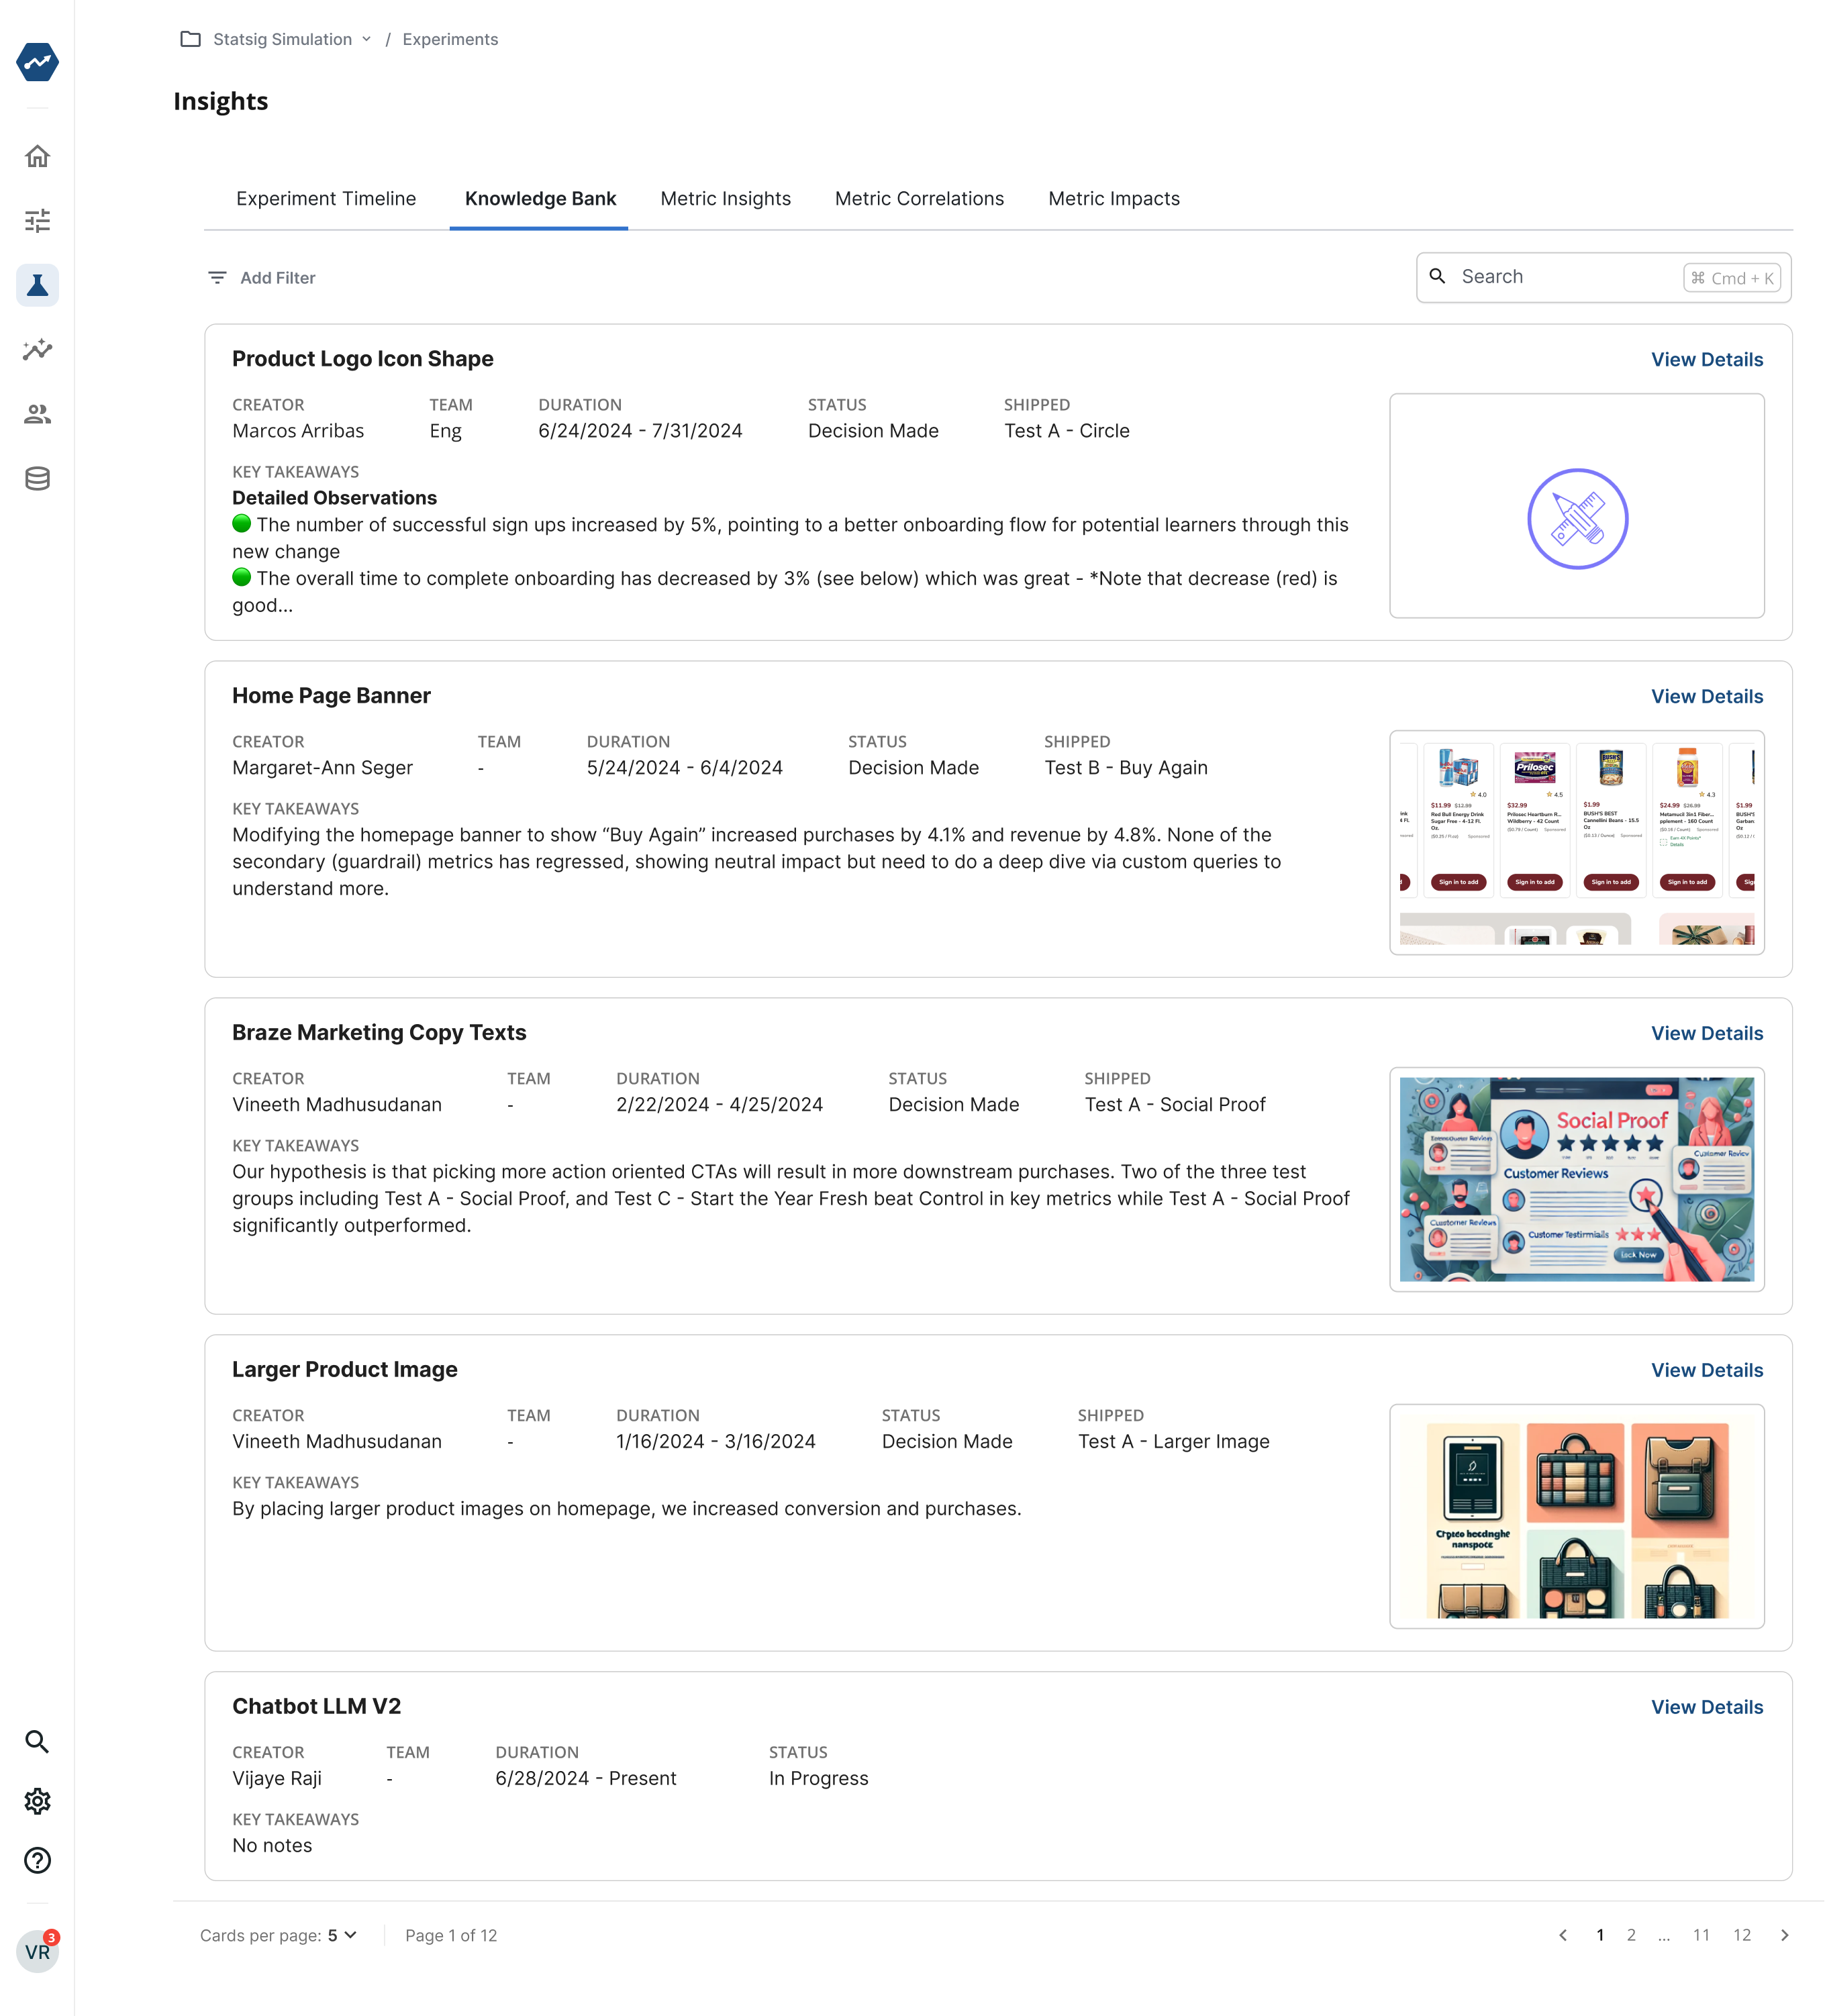
The Knowledge Bank is a searchable repository of experiment learnings across teams. Use it to find shipped, healthy experiments, review past work, and get ideas for new experiments.
New team members can explore the experiments a team ran or search by topic. The meta-analysis views offer structured ways to review your experiment corpus; use the Knowledge Bank when you need free-text search.
Was this helpful?