For AI agents: a documentation index is available at /llms.txt. Append .md to any page URL for markdown, or send Accept: text/markdown.
How to Read Experiment Results (Formerly "Pulse")
Read and interpret Statsig experiment results, including scorecards, primary metrics, lift, confidence intervals, and statistical significance indicators.
The Results tab shows how each experiment group performed on your primary and secondary metrics: the relative lift, its confidence interval, and whether the result is statistically significant. Use it to check exposures and the Scorecard for a running or completed experiment. To filter or group results by a dimension the Scorecard doesn't show, use a custom Explore query instead.
Cumulative exposures
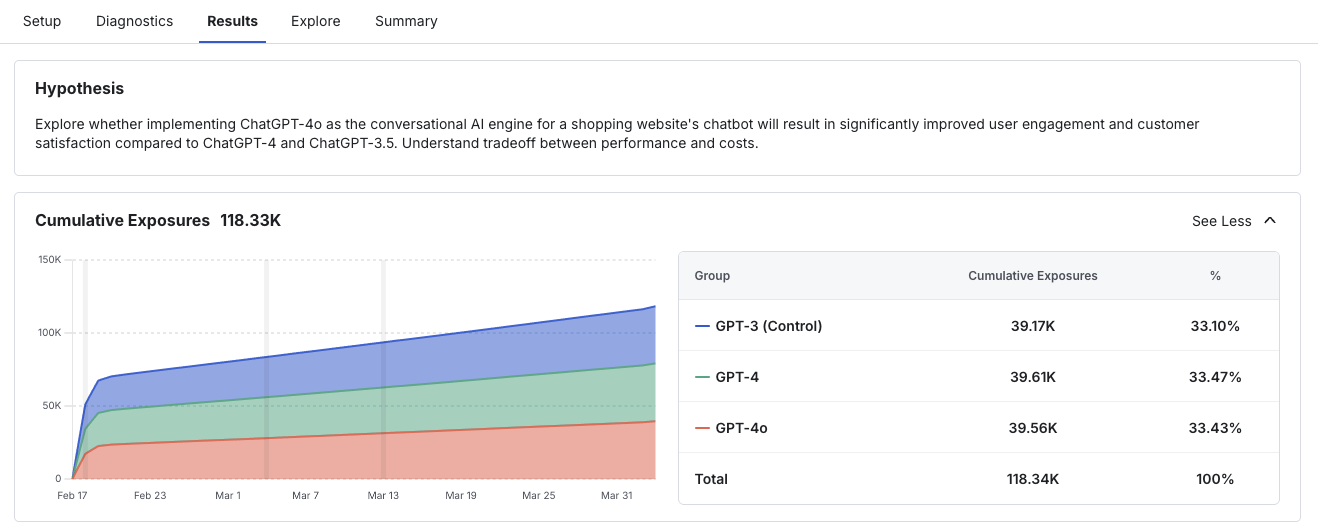
The Cumulative Exposures chart shows exposures: the unique experimental units enrolled in the experiment, typically unique users, or devices for device-level experiments. The timeline shows when the experiment started and how many exposures Statsig enrolled each day. Use this chart to verify the rate at which users entered each group, the total number exposed, and whether the target ratio matches what you configured in experiment setup. Select See More to expand the chart.
Scorecard
The experiment Scorecard shows the metric lifts for all primary and secondary metrics you set up at experiment creation.
Real-time results in the first 24 hours
For up to the first 24 hours after you start your experiment, before the first daily metric results run, Statsig calculates the Scorecard hourly. This hourly calculation applies only to Statsig Cloud. For Warehouse Native projects, reload results on demand or set up a daily schedule. Use the real-time Scorecard to confirm that Statsig calculates exposures and metrics as expected, and to debug your experiment or gate setup.
Don't make any experiment decisions based on real-time results data in this first 24-hour window. Call experiments only after the experiment reaches its target duration, which is when your primary metrics reach experimental power. For more information about target duration, refer to Target Duration.
Until the first daily run, the real-time view differs from daily results in the following ways:
- Metric lifts don't have confidence intervals.
- There's no time-series view of metric trends.
- There's no projected topline impact analysis.
- You can't apply advanced statistical treatments such as CUPED or sequential testing.
Daily Scorecard results
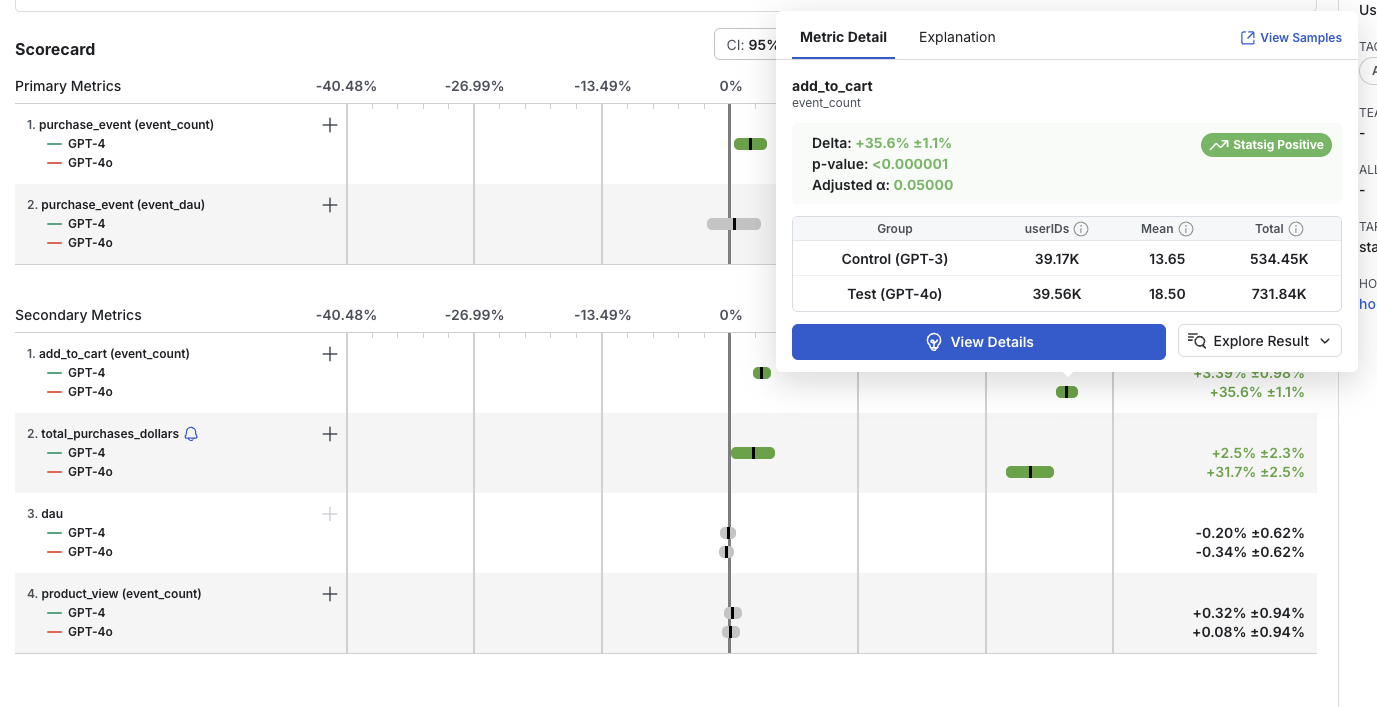
The daily results run calculates the difference between randomization groups (for example, test and control) across your metric suite and applies a statistical test to the results. Refer to Statsig's stats engine for details.
For every metric, Statsig shows you:
- The calculated relative difference (Delta %).
- The confidence interval.
- Whether the result is statistically significant. Positive lifts are green, negative lifts are red, and non-significant results are grey.
The formula for calculating lift is:
Delta(%) = (Test - Control) / Control
Statsig reports confidence intervals at the selected significance level (95% by default). In a typical two-sided Z-test, Statsig shows the confidence interval as +/- 1.96 * standard error.
Statsig automatically applies 99.9% winsorization to event_count, event_count_custom, and sum metrics. Winsorization caps extreme outlier values to reduce their impact on experiment results. For metrics in the Scorecard or Monitoring Metrics sections of your experiment or gate, you can also apply optional statistical treatments: CUPED (pre-experiment bias reduction) and sequential-testing-adjusted confidence intervals.
90-day compute window
By default, Statsig computes experiment results for only the first 90 days of your experiment. Statsig notifies you by email as you approach the 90-day cap. At that point, you can extend the compute window by 30 days at a time. If the experiment runs beyond the compute window, Statsig stops adding new users to the experiment's results. Analysis for users already exposed continues until you make a decision on the experiment.
This calculation window only affects whether Statsig includes a user in the experiment's analysis. It doesn't affect the experience each user receives: new users still receive the experience for the group Statsig randomizes them into.
Experiment results views
Select Display Options on the Results tab to choose how the Scorecard renders metric lifts.
| View | What it shows |
|---|---|
| Cumulative results (default) | The aggregate difference between experiment groups, with the corresponding confidence intervals. Hover over a metric to view the raw statistics behind the lift calculation and the topline impact. |
| Table view | The same data as the cumulative view, in a table with additional fields. |
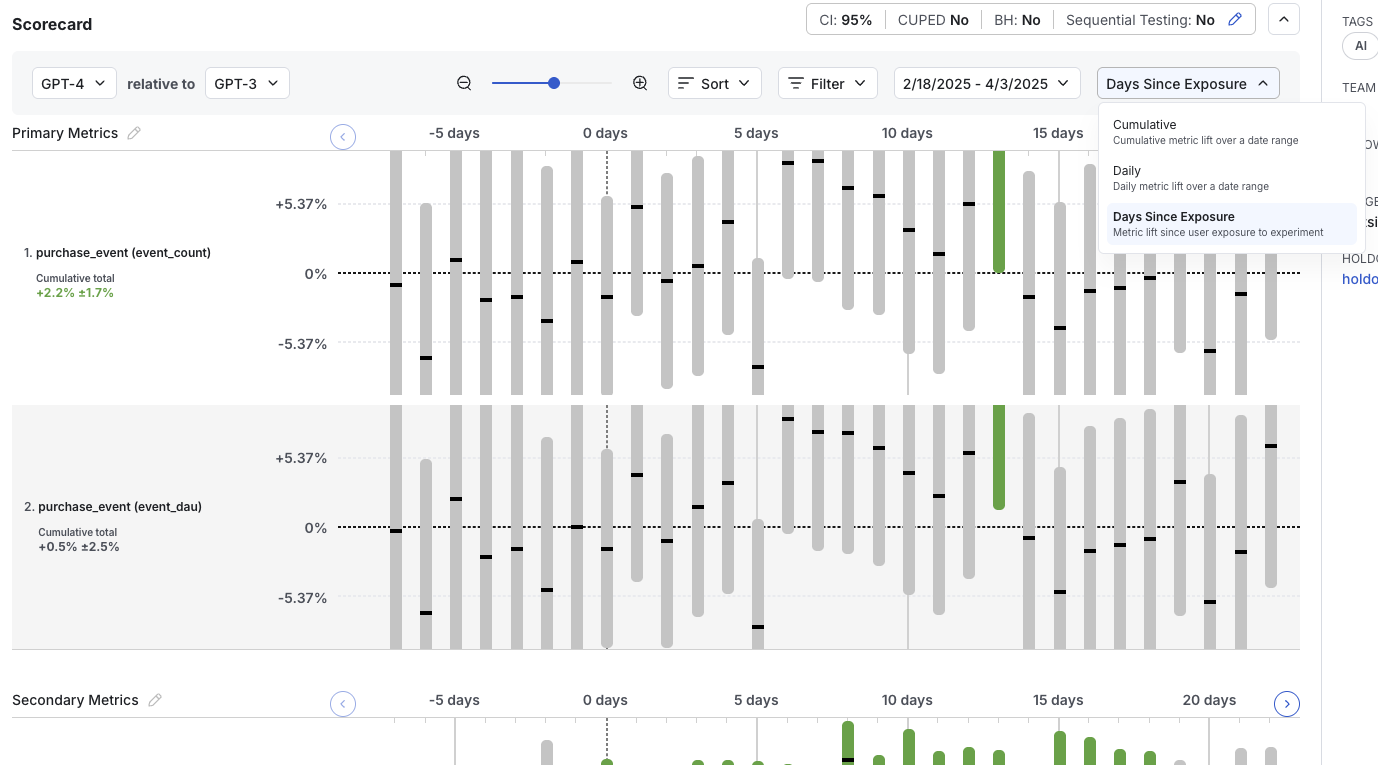
| Daily results | The difference between experiment groups, aggregated by days since the experiment started. |
| Days since exposure | The difference between experiment groups, aggregated by days since each user's exposure to the experiment. |
The Display Options panel also includes:
- Data: Choose the value to display, such as Relative Delta.
- Zoom: Adjust the zoom level of the chart.
- Sort By and Organize By: Control the order and grouping of the metrics.
- Filters: Filter the displayed metrics by tag or filter group.
Dimensions
You can break down a Scorecard metric by a user dimension or by an event dimension.
User dimensions
User dimensions are user-level attributes that are either part of the user object you log or additional metadata that Statsig extracts. Examples include operating system, country, and region.
To filter or group by user dimensions, create a custom Explore query on the Explore tab. For example, view results for users in the US, or for users on iOS grouped by country.
Event dimensions
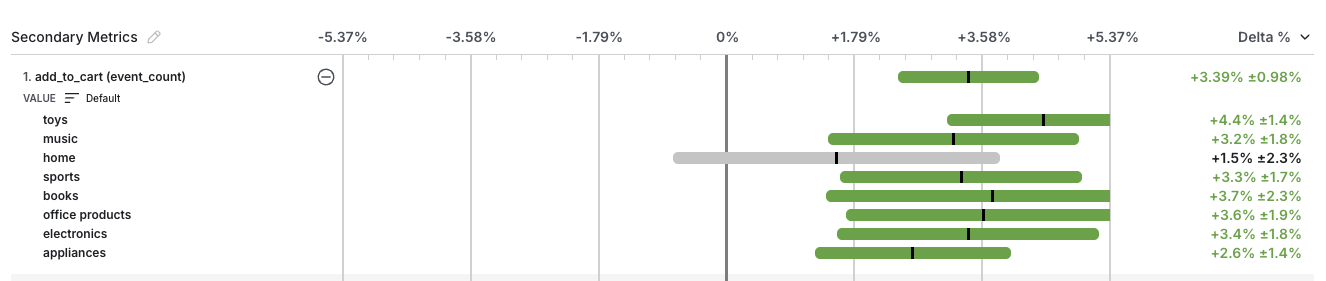
Event dimensions are the value or metadata logged as part of the custom event that defines the metric. To break a metric down by categories specific to that metric, specify the dimension in the value or metadata attribute when you log the source event. For example, when you log a "click" event, you can also log the target category in the value attribute. Statsig automatically generates results for each category in addition to the top-level metric.
To view breakdowns for all categories within a metric, select the (+) sign next to the metric.
Significance level settings
Open the Comparison & Stats panel to view Scorecard results at different significance levels and adjust the statistical settings at any time. To open it, select the pencil icon next to the Test and Control summary row on the Scorecard. The panel also includes Compare and relative-to group pickers that control which groups Statsig compares.
- Apply Benjamini-Hochberg Procedure per Variant: Reduces the probability of false positives by adjusting the significance level for multiple comparisons. Refer to Benjamini-Hochberg Procedure for details.
- Confidence Interval: Changes the confidence interval displayed with the metric deltas. Choose a lower confidence interval (for example, 80%) when you accept a higher false-positive rate in exchange for faster, directional results.
- CUPED: Toggle CUPED on or off. This setting applies only to Scorecard metrics; Statsig doesn't apply CUPED to non-Scorecard metrics.
- Sequential Testing: Applies a correction to p-values and confidence intervals to reduce the increased false positive rate caused by evaluating results before the target completion date. This setting appears only for experiments with a set target duration.
- SPRT: Toggle the Sequential Probability Ratio Test (SPRT) on or off. SPRT is a sequential testing methodology that supports unlimited peeking without alpha-spending or confidence-interval penalties. Refer to Sequential Probability Ratio Tests for details, including its configuration options.
- Power Parameter: Appears when SPRT is on. Sets the target statistical power (1 − β) that Statsig uses to compute the SPRT decision boundaries. The default is 80%; choose from 80%, 90%, 95%, 98%, or 99%. This isn't the per-metric effect size: set the Minimum Detectable Effect (MDE) and Cohen's d separately during experiment setup, as described in Power analysis and setting Cohen's d.
Restarting results
If your experiment has stopped computing results, select Restart to resume updates. Understand how Restart behaves before you proceed:
- A Restart isn't a Reset of your experiment. A Restart doesn't re-salt (re-randomize) units, and all users continue to receive the same group assignments.
- Statsig begins computing experiment results from the restart point, so your metric results start over. Old results may still appear in time series and Explore query views, but Statsig doesn't carry them forward or update them.
- Your Cumulative Exposures chart updates based on new exposures. The duration of the pause in computations determines whether the chart starts over from zero or includes past exposures.
To avoid needing a Restart, extend experiments while they're running. Watch for email alerts from Statsig and check your experiments regularly.
Was this helpful?