Warehouse Native Quickstart
Quick start guide for Statsig Warehouse Native: connect your warehouse, define a metric source, run an A/A test, and analyze your first results.
Statsig Warehouse Native connects to a table in your warehouse, builds metrics on top of it, and computes experiment results. This quickstart walks through connecting your data, configuring a metric, and reading your first results.
All you need is a table in your warehouse that has metric or event logging data.
Step 1: Connect your warehouse
Statsig uses your warehouse to store and analyze your experiment data; you have total control and visibility over the data itself. To connect your warehouse, go to your warehouse's setup page.
Step 2: Connect to data
To connect your event or metric data, you create a Metric Source. Go to the Metric Sources page and click Create to make a new Metric Source.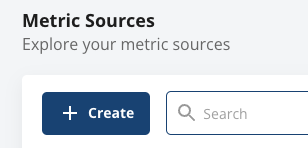
If you have a table, use the Table metric source type and put in the path to your table. Otherwise, you can write a query to access or generate some test data.
Press Analyze to generate samples from your table, then map required columns (Timestamp and UserID) so Statsig can connect your metric data to your assignment data.
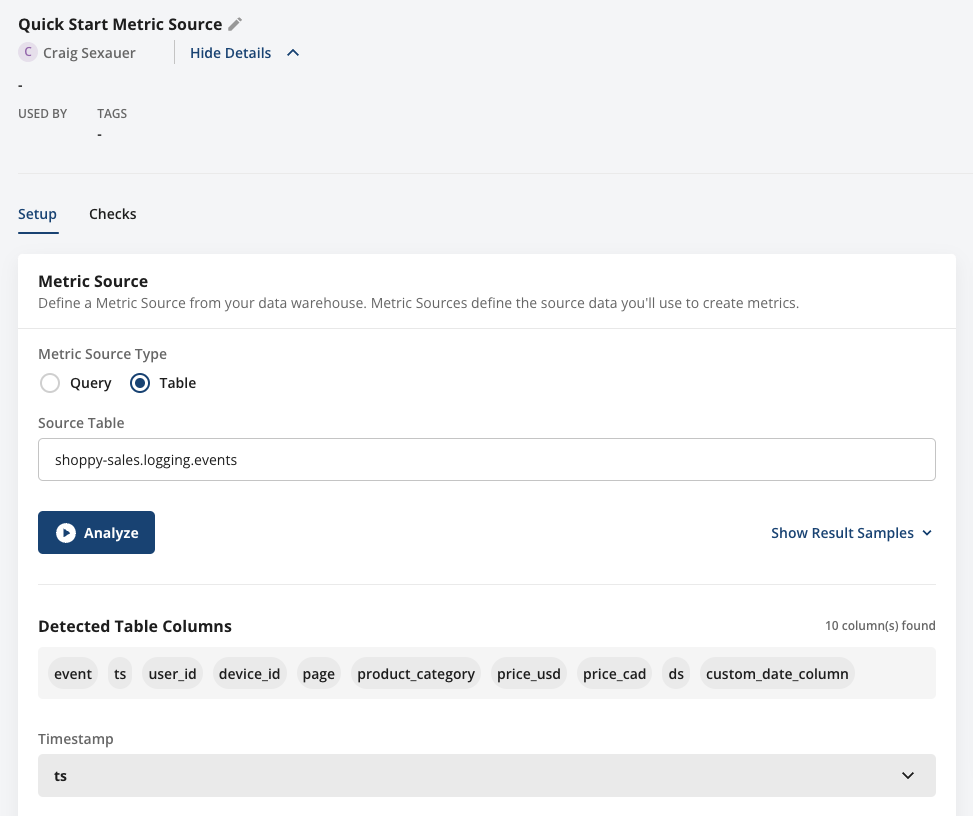
Save your changes, and you've connected to your data!
Step 3: Make a metric
Now that you've connected to data, you can build metrics on top of this data. You can configure metrics programmatically later; for now, go to your Metrics Catalog and click Create to make a new metric.
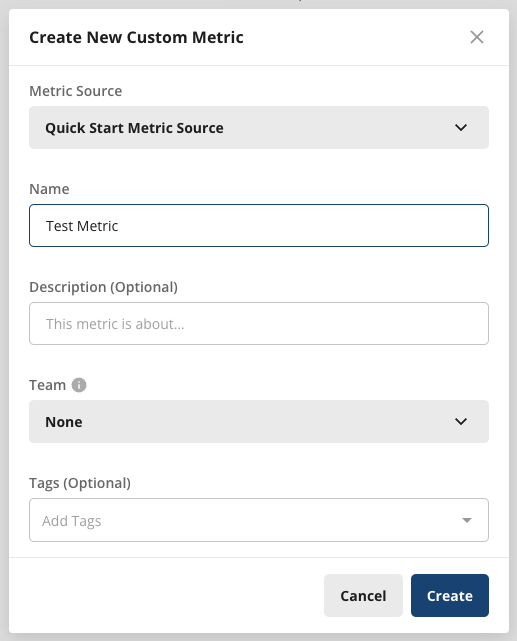
Point to the metric source you configured, name your metric, and press Create. Pressing Create takes you to the new metric's page, where you can configure the metric.
To get started, Statsig recommends making a count metric. A count metric counts the number of rows in your metric source. A count metric is useful for event logging. For example, you might filter to a "purchase" event to count the number of times users purchased an item.Select "Count" and save, or pause here to explore the options.
Step 4: Connect an experiment
Next, you connect to experiment data. If you have a table with exposures you've already logged, use that. Ensure you've logged the same identifier there as you used in your metric source.
Otherwise, you can quickly follow the guide to setting up an A/A test, using the same data you used for your exposures. An A/A test should generate a neutral experiment result.Go to Assignment Sources and create a new one.
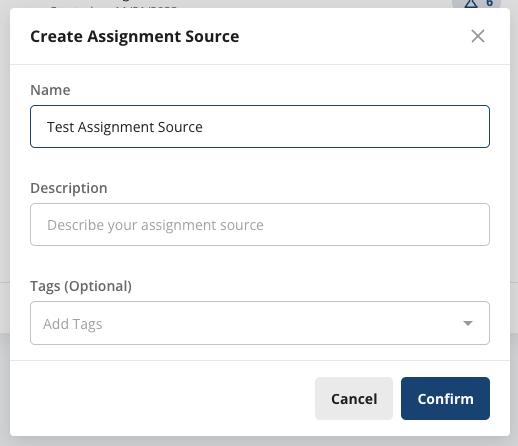
If using an AA test, follow the instructions to randomly assign users to groups. If you're using existing assignments, write a query to pull the data from your logs and map the unit, group, experiment, and timestamp columns.

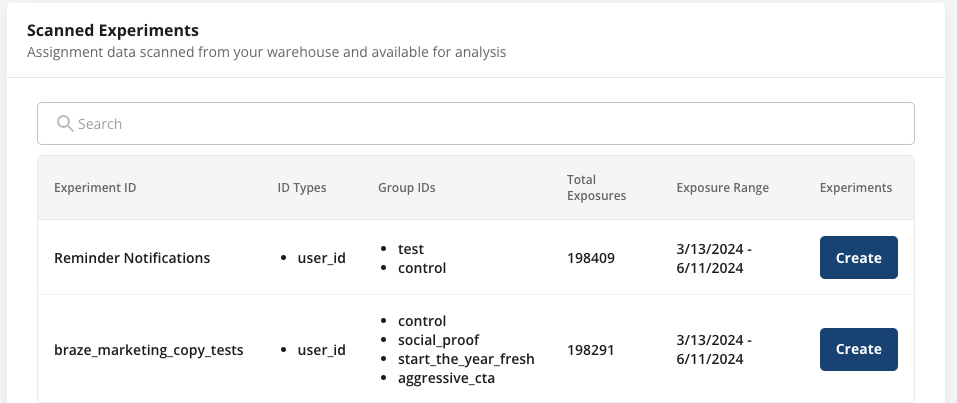
Pressing Save and Scan saves your new source and detects experiments that exist on the source. The scan takes seconds to a few minutes. After it finishes, scroll down to look through the experiments Statsig found.
Step 5: Analyze your experiment
Press Create on your experiment of interest to start creating your experiment.
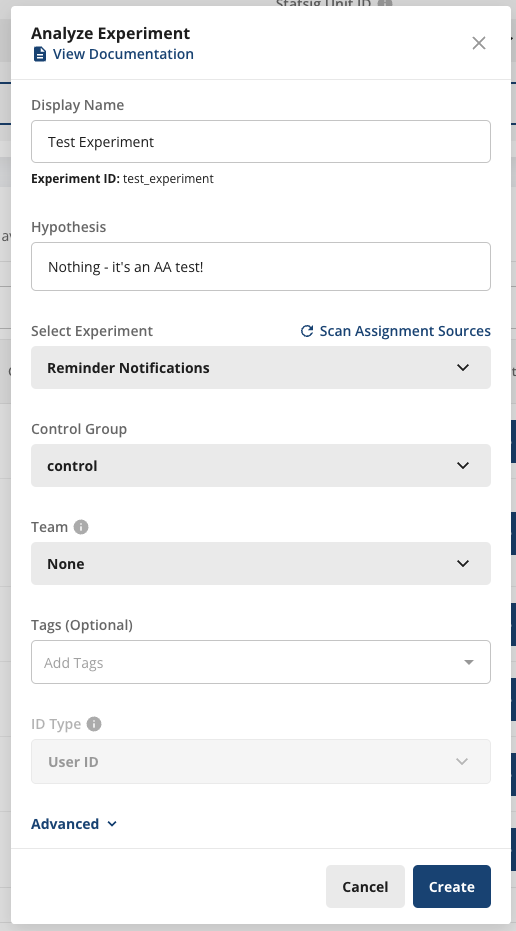
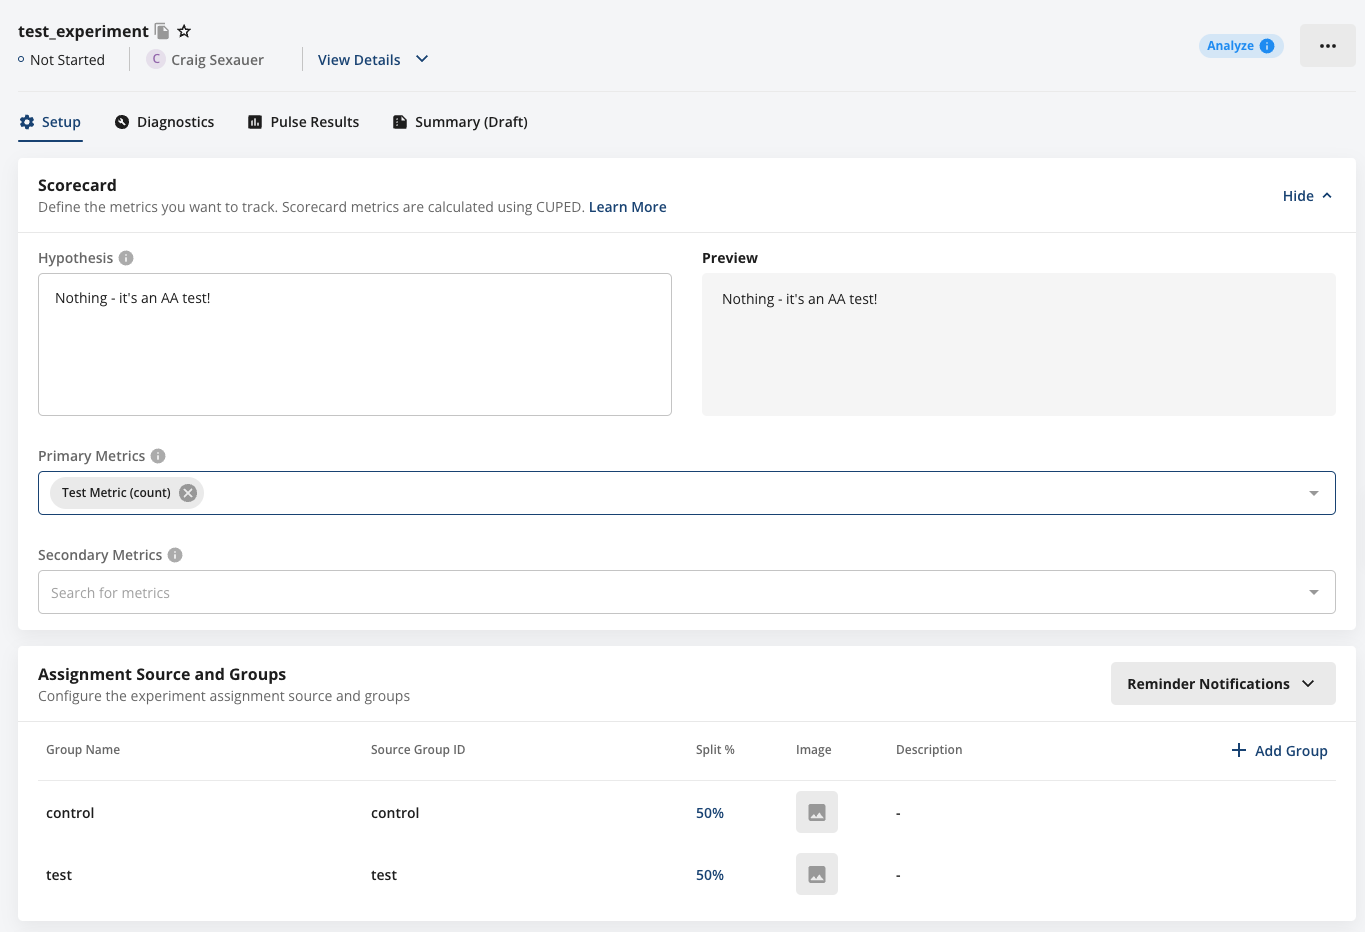
Add a display name and hypothesis, then press Create. Pressing Create takes you to the final setup step, where you specify the metrics for your experiment. Choose the metric you created in step 3.
Statsig automatically detects the group split, but if the detected split is incorrect you can manually adjust it to the intended value.
Press Save and Analyze, and Statsig starts calculating Pulse Results. You can track the progress in the loading bar at the bottom of the experiment's results page.
Step 6: Read results
If everything worked, you should see:
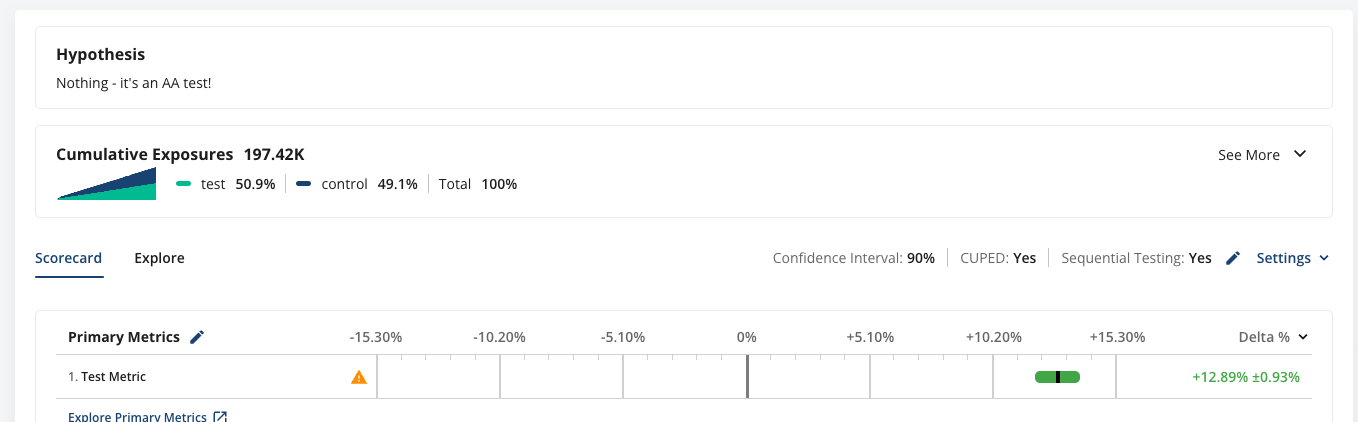
- Your hypothesis. The hypothesis lives at the top of the results page to give context and guide interpretation of the results.
- Cumulative exposures. Cumulative exposures show the number of unique units exposed to each group, and the balance between groups.
- Your scorecard. The scorecard shows a summary of the observed differences in metrics between your experiment groups, with access to additional views and raw statistics.
Explore the product and docs to learn more about these features:
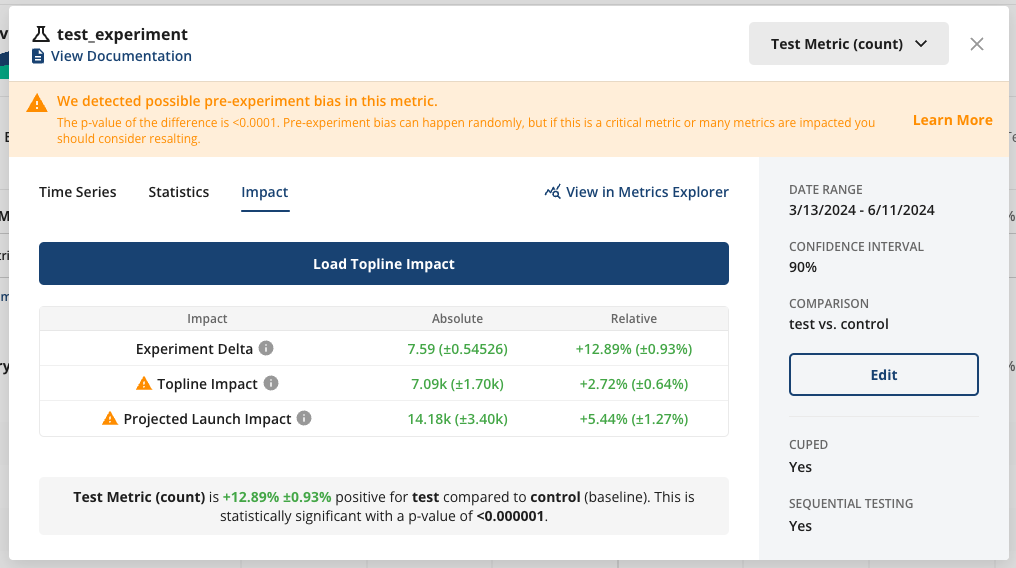
- Click into a result's error bar to view raw statistics, timeseries, and projected timeline impact.
- Hover over a metric to get detailed context on its inputs and how Statsig calculated the pulse result.
- Go to the Diagnostics tab to view the checks Statsig automatically ran to validate your experiment results.
- Select the reloaded timestamp to view the run time and query cost of your Pulse analysis, and the SQL queries used to calculate the results.
- Go to the Explore tab to start filtering data, exploring results by dimensions, or running other follow-up analyses.
- Go to the Summary tab to start putting together a report to share the results of your analysis.
- Start a discussion or add context, either in the Discussion tab or with in-context comments on top of the results themselves.
The example experiment wasn't an AA test, and there was an experimental impact. The result is statistically significant, with an estimated lift of +12.89% ±0.93% from control to test. Select the result to view additional details, such as the expected change to the overall topline metric value if the experiment ships.
You've completed the Quick Start guide.
Was this helpful?