Pipeline Overview
Understand what we're running on your warehouse
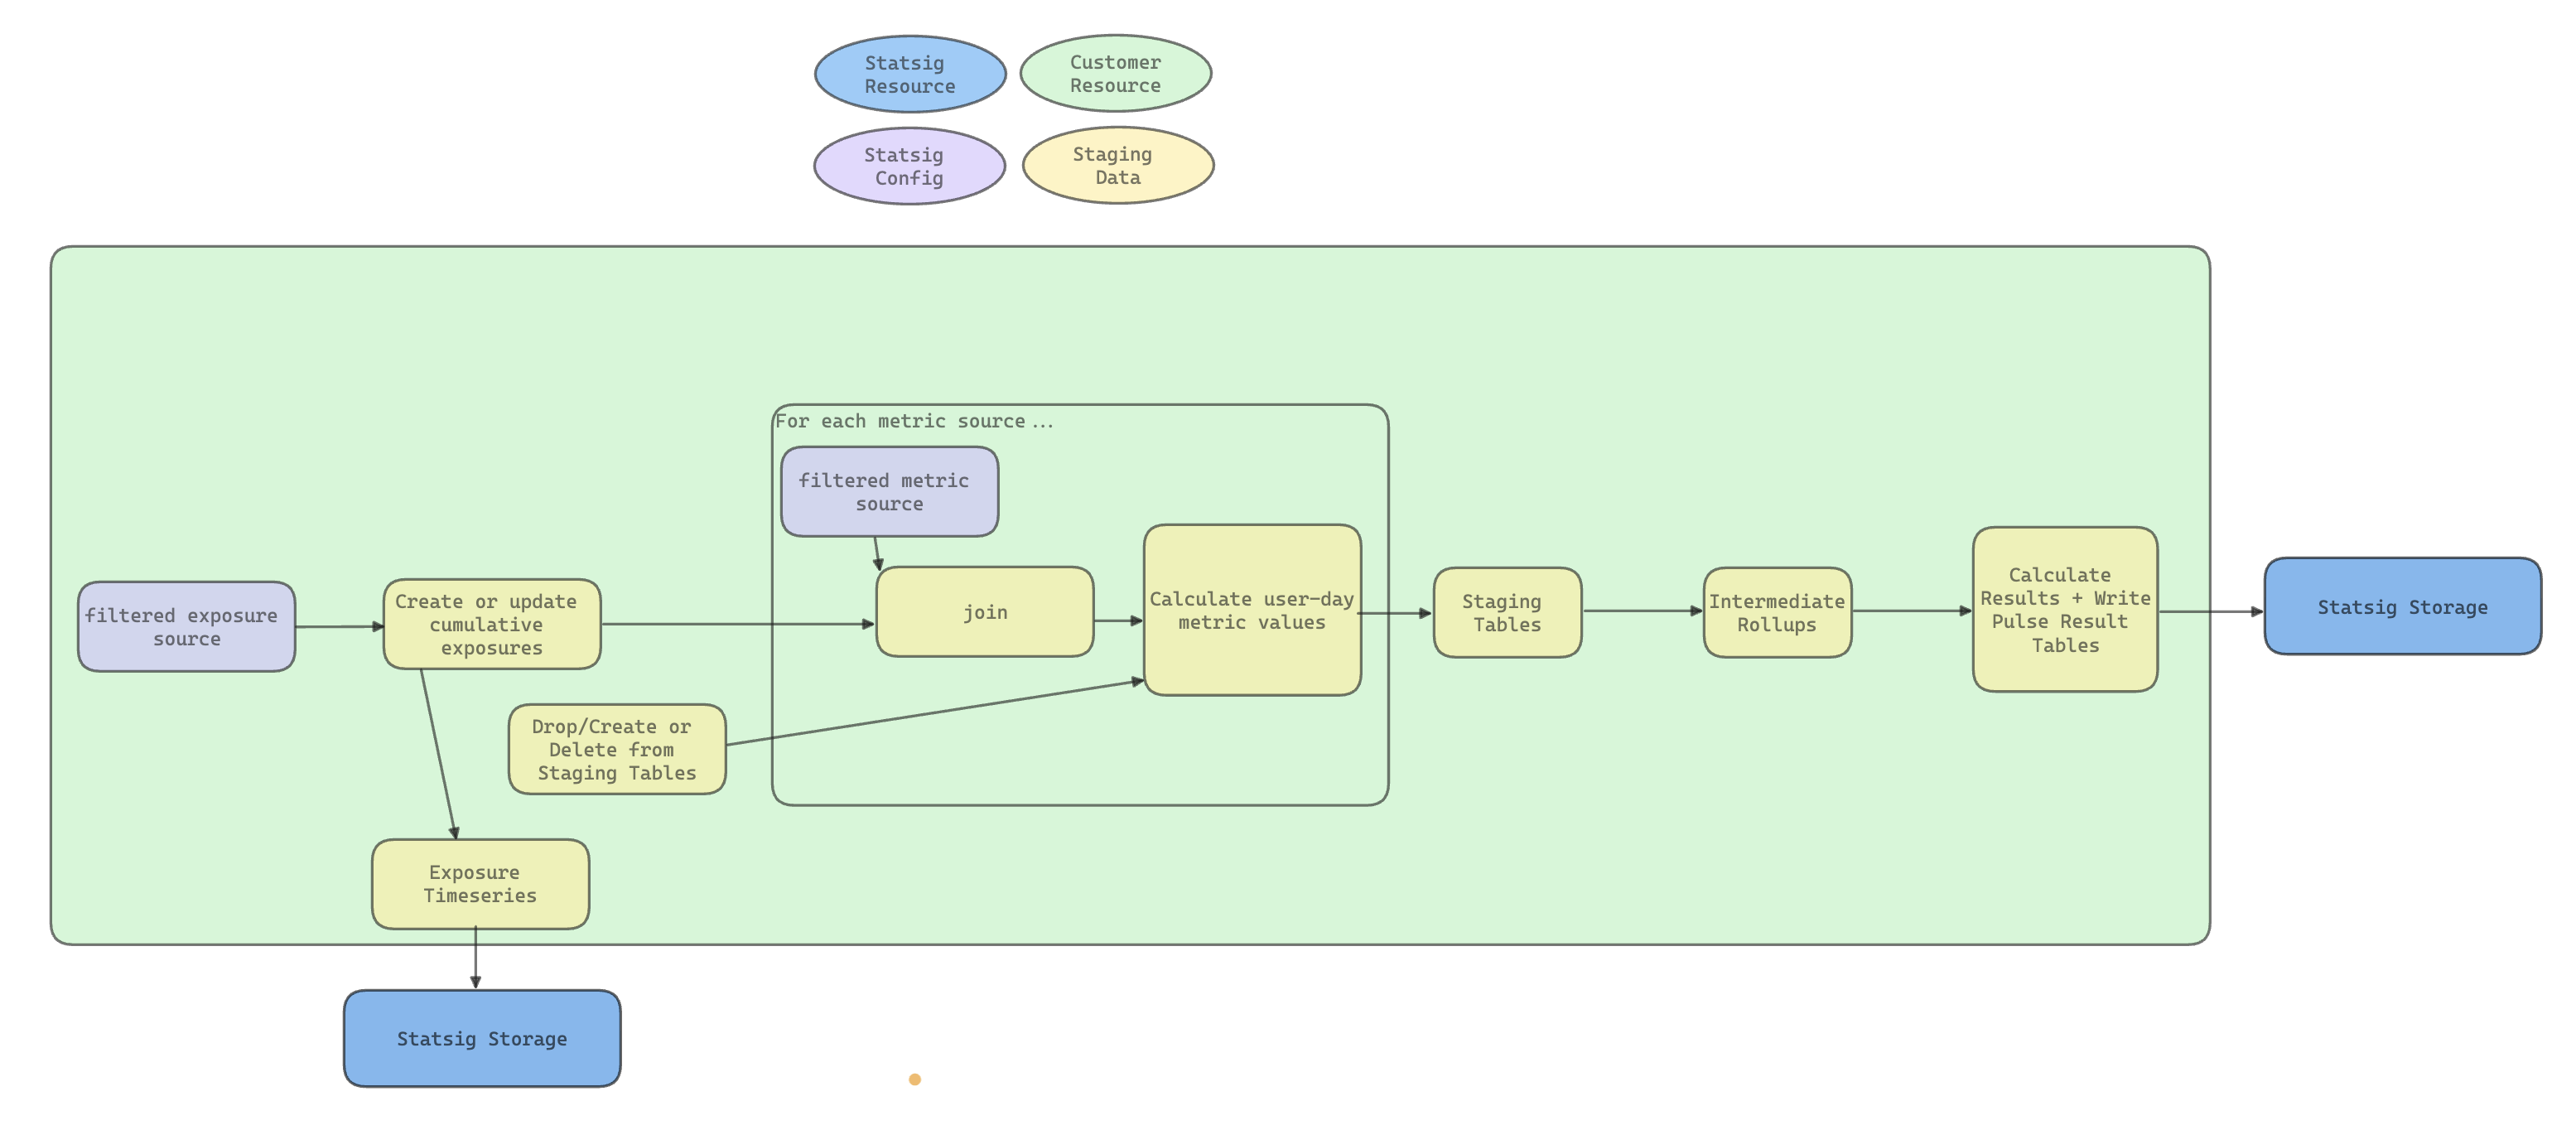
Statsig Warehouse Native runs a pipeline in your warehouse that turns raw exposure and metric data into experiment results, from identifying users' first exposures through calculating group-level summary statistics.
Main steps
The main steps in the pipeline are:
- Identifying users' first exposures
- Annotating Metric Sources with exposure data
- Creating metric-user-day level staging data
- Running intermediate rollups for better performance
- Calculating group-level summary Statistics
Types of DAGs
Statsig lets you run your pipeline in a few different ways:
- A Full Refresh totally restates the experiment's data and calculates it from scratch. This is useful for starting an experiment, or if underlying data has changed.
- An Incremental Refresh appends new data to your experiment data. This reduces the cost of running scheduled updates to your results.
- A Metric refresh lets you update a specific metric in case you changed a definition, or want to add new metrics to your analysis.
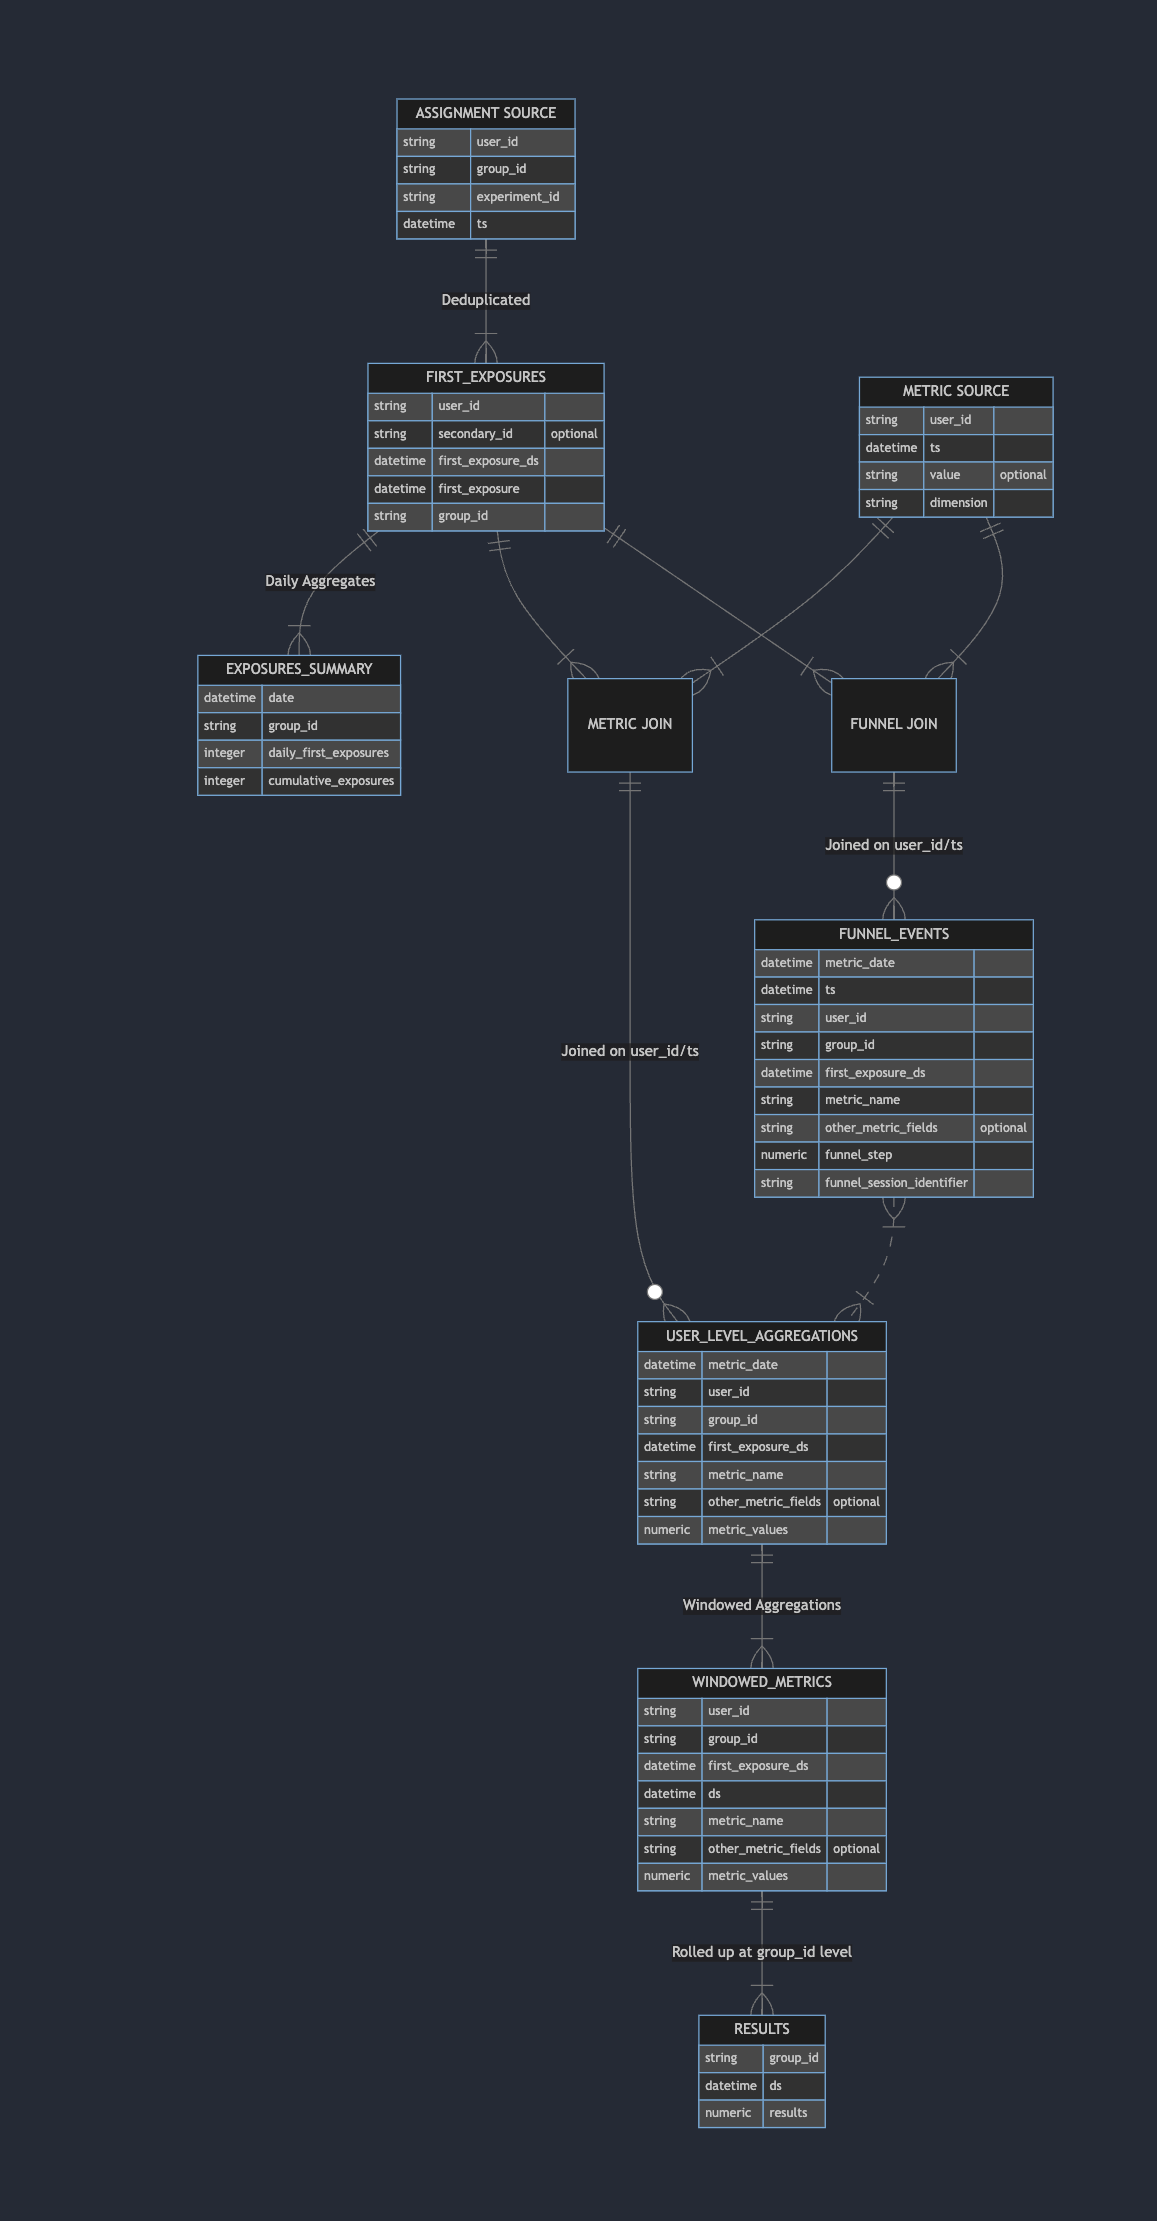
Artifacts and entity relationships
Statsig generates and stores the following tables in your warehouse per-experiment. You have full access to these data sources for your own analysis, models, or visualizations. For experiments, experiment_id is the name of the experiment; for Feature Gates, experiment_id is the name of the gate along with the specific rule ID (for example, chatbot_llm_model_switch_31e9jwlgO1bSSznKntb2gp_exposures_summary).
This is not an exhaustive list, but it includes most of the core result and staging tables useful for your own analysis.
These are internal tables and change as the product evolves. Statsig documents changes here.
| Table | Description | Notes |
|---|---|---|
first_exposures_<experiment_id> | Deduplicated and stitched (for experiments with ID resolution) first exposure events | Useful for ad-hoc analysis |
exposures_summary_<experiment_id> | Timeseries of exposures per group for display in Pulse | |
unit_day_metrics_<experiment_id> | User-day level metric aggregations table | Useful for ad-hoc analysis |
unit_covariate_metrics_<experiment_id> | User-level pre-experiment aggregations for regression adjustment/CUPED | |
funnel_events_<experiment_id> | Staging table for running funnel analysis | |
percentile_values_<experiment_id> | Staging table for running percentile analysis | |
distinct_values_<experiment_id> | Staging table for running count distinct analysis | |
windowed_metrics_<experiment_id> | Staging table for generating running totals when restating Pulse | |
ratio_aggregations_<experiment_id> | Staging table for generating running totals when restating Pulse | |
results_<rollup>_<experiment_id> | Outputs of Statistical Analysis for different rollups (e.g. daily, days-since-exposure, cumulative, 7-day). Exported to Statsig | Pulse inputs - useful for replicating Statistical analysis |
ratio_results_<rollup>_<experiment_id> | Outputs of Statistical Analysis for ratio metrics in different rollups (e.g. daily, days-since-exposure, cumulative, 7-day). Exported to Statsig | Pulse inputs - useful for replicating Statistical analysis |
The high-level relationships and contents of these tables appear in the entity relationship diagram below. Refer to the Main steps diagram above for scheduling details.
Other jobs
Alongside and inside this main flow, Statsig also:
- Runs Health Checks and a Summary View for exposures
- Calculates top dimensions for dimensional metrics
- Calculates funnel steps
- Runs CUPED and Winsorization procedures during the group-level summaries to reduce variance and outlier influence
- Calculates inputs to the Delta Method to avoid bias on Ratio and Mean metrics
Statsig generates experiment-level tables, making it easy to run follow-up analyses on specific experiments.
Visibility
Select the history icon on your pulse results to see the jobs and IDs Statsig ran for each pulse reload, along with compute time and cost.
This information is also visible in your warehouse's own history and usage management. Having the costs in the console is useful for cross-functional experimentation teams running the analysis.
Exposure export table
Statsig dedupes and records production exposures into the forwarded exposures table configured in your warehouse Data Connection. This table contains each user's first exposure to an experiment. For feature gates, Statsig dedupes and records exposures for partial rollouts (for example, 5% or 50% rollouts, but not 0% or 100% rollouts).
| Column Name | Data Type | Description |
|---|---|---|
| experiment_id | string | The identifier for the gate/experiment |
| group_id | string | groupID for experiments; ruleID+Pass/Fail for gates |
| group_name | string | Name of the experiment group (e.g. Control vs Test) |
| user_id | string | The ID passed in as the Statsig userID |
| stable_id | string | Statsig Client SDK managed stable device identifier |
| [your custom ids] | string | One column for every custom unitID you use on Statsig |
| timestamp | timestamp | Timestamp of the first exposure |
| user_dimensions | object | Warehouse specific object with all the user dimensions |
Statsig populates user_dimensions in the daily deduplicated export. Fast-forwarded exposure rows can omit some fields in this object until the next daily load.
Common fields in user_dimensions
user_dimensions contains user attributes captured alongside the first exposure. The exact shape can vary by SDK and project configuration, but these are some of the most common fields you may see:
| Field | Description | Notes |
|---|---|---|
os | Normalized operating system name | Canonical OS field on the exposure side. |
os_version | Operating system version | Derived from SDK metadata or user agent parsing. |
browser_name | Browser name | Derived from SDK metadata or user agent parsing. |
browser_version | Browser version | Derived from SDK metadata or user agent parsing. |
device_model | Device model | Forwarded or inferred when available. |
ip | IP address | Present when available from the SDK or request context. |
country | Country | Derived from request context or IP lookup. |
locale | Locale | Forwarded or inferred when available. |
language | Language | Forwarded or inferred when available. |
appVersion | Application version | Forwarded when present on the SDK user object. |
sessionID | Session identifier | Forwarded when present on the SDK user object. |
appIdentifier | Application identifier | Forwarded when present on the SDK user object. |
Additional non-null fields from the SDK user object may also appear in user_dimensions. Statsig typically exports custom IDs as dedicated top-level columns in the exposure table rather than querying them from this object.
Statsig uses input fields such as deviceOS and systemName to derive the exported os field. If you want to analyze operating system on forwarded exposures, query user_dimensions.os.
Event export table
If you log custom events through a Statsig SDK, Statsig also forwards those events into a configurable table in your warehouse. This is the table used when Warehouse Native customers rely on Statsig SDK logging for outcome events.
- Use
user_objectfor user fields associated with the event. - Use
statsig_metadatafor SDK and exposure-processing metadata. - Use
company_metadatafor the event metadata payload you logged.
| Column Name | Data Type | Description |
|---|---|---|
| user_id | string | The ID passed in as the Statsig userID |
| stable_id | string | Statsig Client SDK managed stable device identifier |
| [your custom ids] | string | One column for every custom unitID you use on Statsig |
| timestamp | timestamp | Event timestamp |
| event_name | string | Name of the logged custom event |
| event_value | string | Optional event value |
| user_object | object | Warehouse specific object containing user fields associated with the event |
| statsig_metadata | object | Warehouse specific object containing Statsig SDK and exposure metadata |
| company_metadata | object | Event metadata payload logged with the event |
Common fields in user_object
user_object contains user fields associated with the event. It often includes the same common fields as user_dimensions, plus any additional non-null fields sent on the SDK user object.
| Field | Description | Notes |
|---|---|---|
os | Normalized operating system name | Canonical OS field on the event-side user object. |
os_version | Operating system version | Derived from SDK metadata or user agent parsing. |
browser_name | Browser name | Derived from SDK metadata or user agent parsing. |
browser_version | Browser version | Derived from SDK metadata or user agent parsing. |
device_model | Device model | Derived from deviceModel when provided. |
ip | IP address | Present when available from the SDK or request context. |
city | City | Added when geographic inference is available. |
state | State or region | Added when geographic inference is available. |
country | Country | Derived from request context or IP lookup. |
locale | Locale | Forwarded or inferred when available. |
language | Language | Forwarded or inferred when available. |
appVersion | Application version | Forwarded when present on the SDK user object. |
sessionID | Session identifier | Forwarded when present on the SDK user object. |
appIdentifier | Application identifier | Forwarded when present on the SDK user object. |
Common fields in statsig_metadata
statsig_metadata contains SDK-level and exposure-processing metadata associated with the event. These are some of the most common customer-facing fields:
| Field | Description | Notes |
|---|---|---|
deviceType | High-level device category | Derived from the normalized OS, for example Desktop or Mobile. |
targetAppID | Target app identifier | SDK target app metadata. |
statsigTier | Statsig environment tier | For example prod or staging. |
keyEnvironment | SDK key environment | Environment associated with the SDK key. |
keyID | SDK key identifier | Useful for debugging ingestion and environment issues. |
samplingRate | Event sampling rate | Present when the event is sampled. |
is_bot | Bot classification | Set when Statsig classifies the event as bot traffic. |
billing_type | Exposure billing classification | Common on exposure-related events. |
groupID | Experiment group identifier | Common on exposure-related events. |
ruleID | Rule identifier | Common on exposure-related events. |
continuous_rollout_id | Continuous rollout identifier | Present for continuous rollout exposures. |
configExposureType | Exposure config type | For example dynamic_config or experiment. |
isSwitchback | Switchback flag | Present when the exposure is associated with a switchback experiment. |
is_autotune | Autotune flag | Present when the exposure is associated with an autotune experiment. |
Other SDK debugging and exposure-processing metadata may also appear in statsig_metadata.
What goes in company_metadata
company_metadata stores the metadata payload logged with the event. This object doesn't have a fixed schema and varies based on the event and your SDK usage. Most event-specific business context, such as price, currency, category, plan, screen, route, or nested objects like cart, items, and context, appears here.
Was this helpful?