Raw Events
Learn how Statsig uses exposure events and custom events from your application to compute metrics and generate experiment results.
Statsig uses the raw events emitted by your application to compute a wide range of product metrics. These events contain the context needed to understand user behavior and infer user intentions.
Types of raw events
Statsig records two types of raw events from your application:
Exposure events track which users Statsig assigns to control and test groups. This exposure data allows Statsig to generate test results so you can evaluate the impact of new features and experiments. Exposure events also allow Statsig to assess the health of an experiment so you can make key decisions based on trustworthy data. Statsig requires exposure events at a minimum to generate experiment results.
Custom events track user actions and any events triggered during use of your application, including events that capture performance (for example, latency) or analytics data (for example, session start). These events allow Statsig to assess overall user engagement in your application, such as daily active users and weekly stickiness. These events also reveal changes in user behavior as you roll out new features and experiments.
When logging custom events, avoid using dot (.) notation in metadata keys. Statsig interprets keys containing dots as nested paths during JSON parsing (e.g., by JSON_VALUE), which can cause the values to parse as NULL.
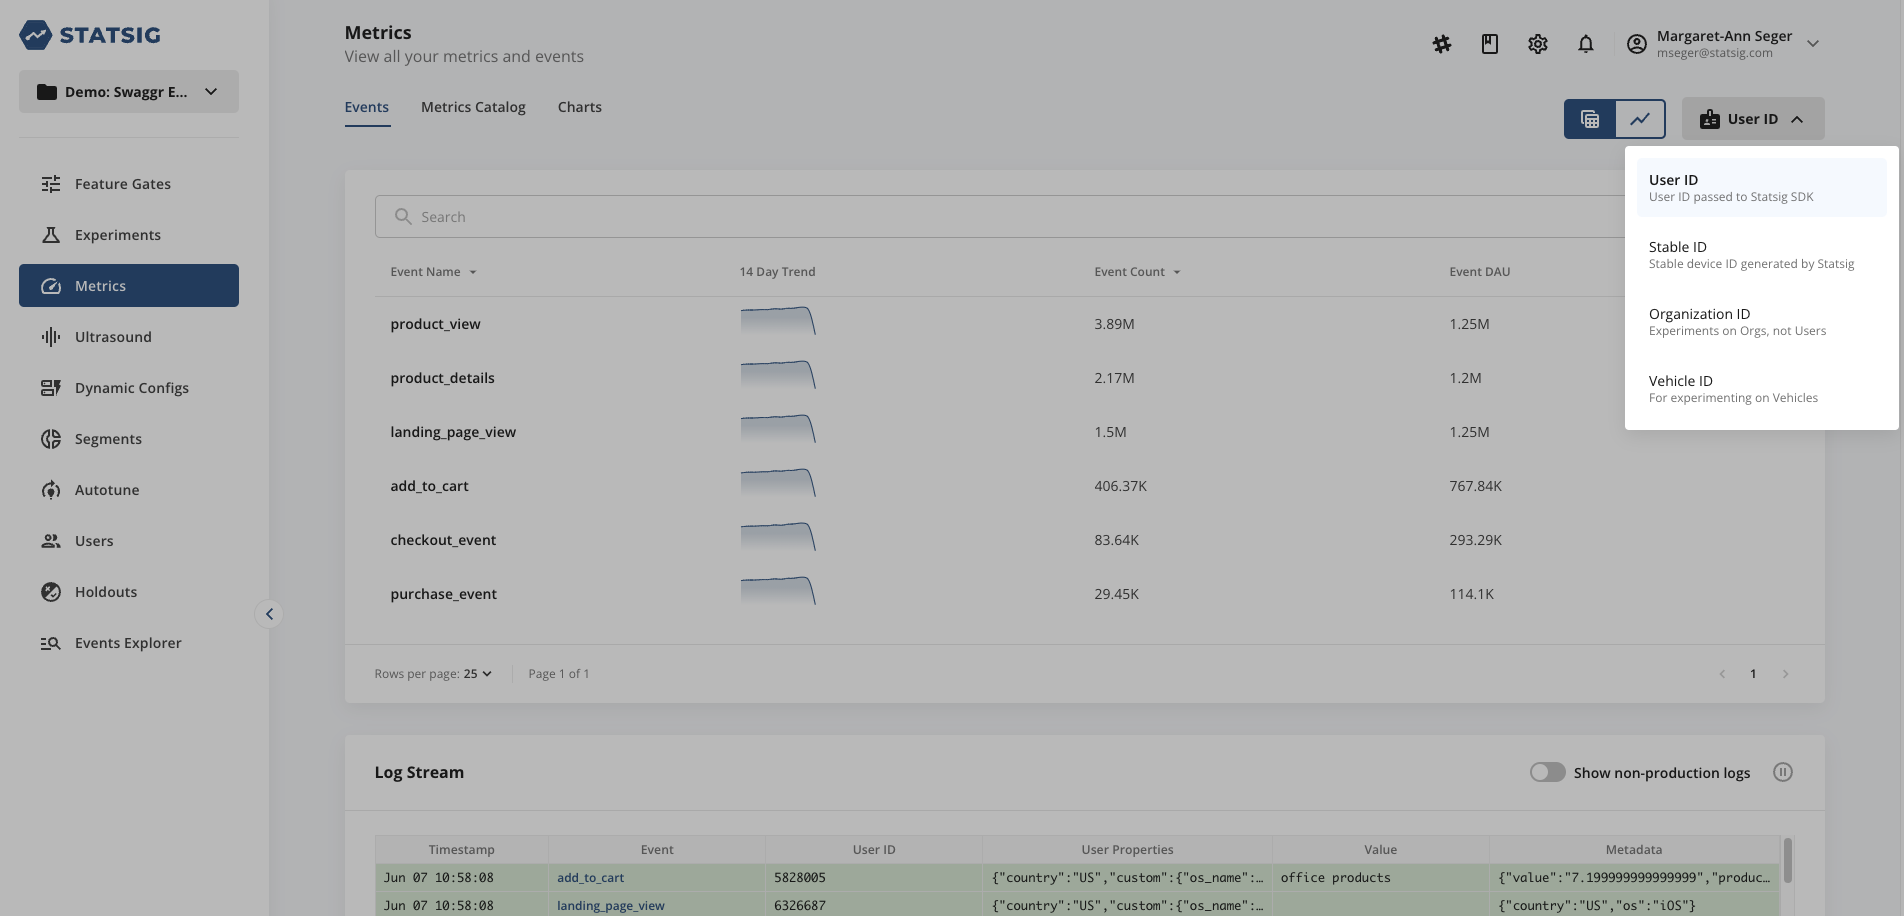
Unit identifiers
You must include at least one unit identifier when you record any raw events with Statsig. Statsig requires the unit identifier for two reasons:
- To ensure that your users receive a consistent application experience when allocated to control or test groups in an experiment
- To join exposure events with all custom events triggered by a given user to compute experiment results
Ingesting raw events
You can send raw events into Statsig in three ways.
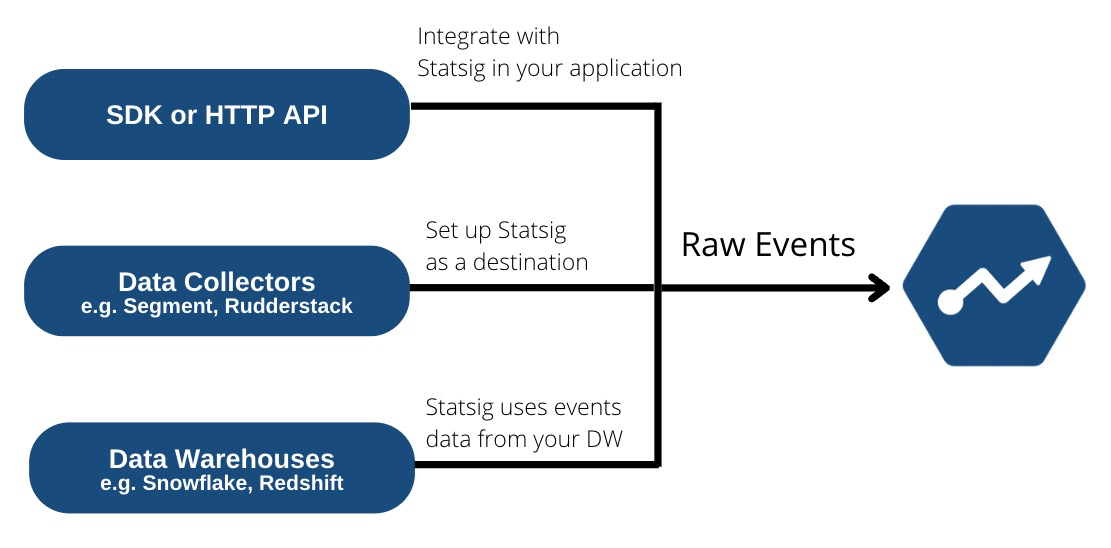
- Integrate with Statsig's client or server SDKs or HTTP API
- Set up Statsig as a destination in a data connector such as Segment, mParticle, RudderStack and Census
- Import from your data warehouse such as Snowflake, BigQuery, and Redshift.
When processing events, Statsig drops event names that contain this regex/character set:
"\\[\]{}<>#=;&$%|\u0000\n\r
Raw events in console
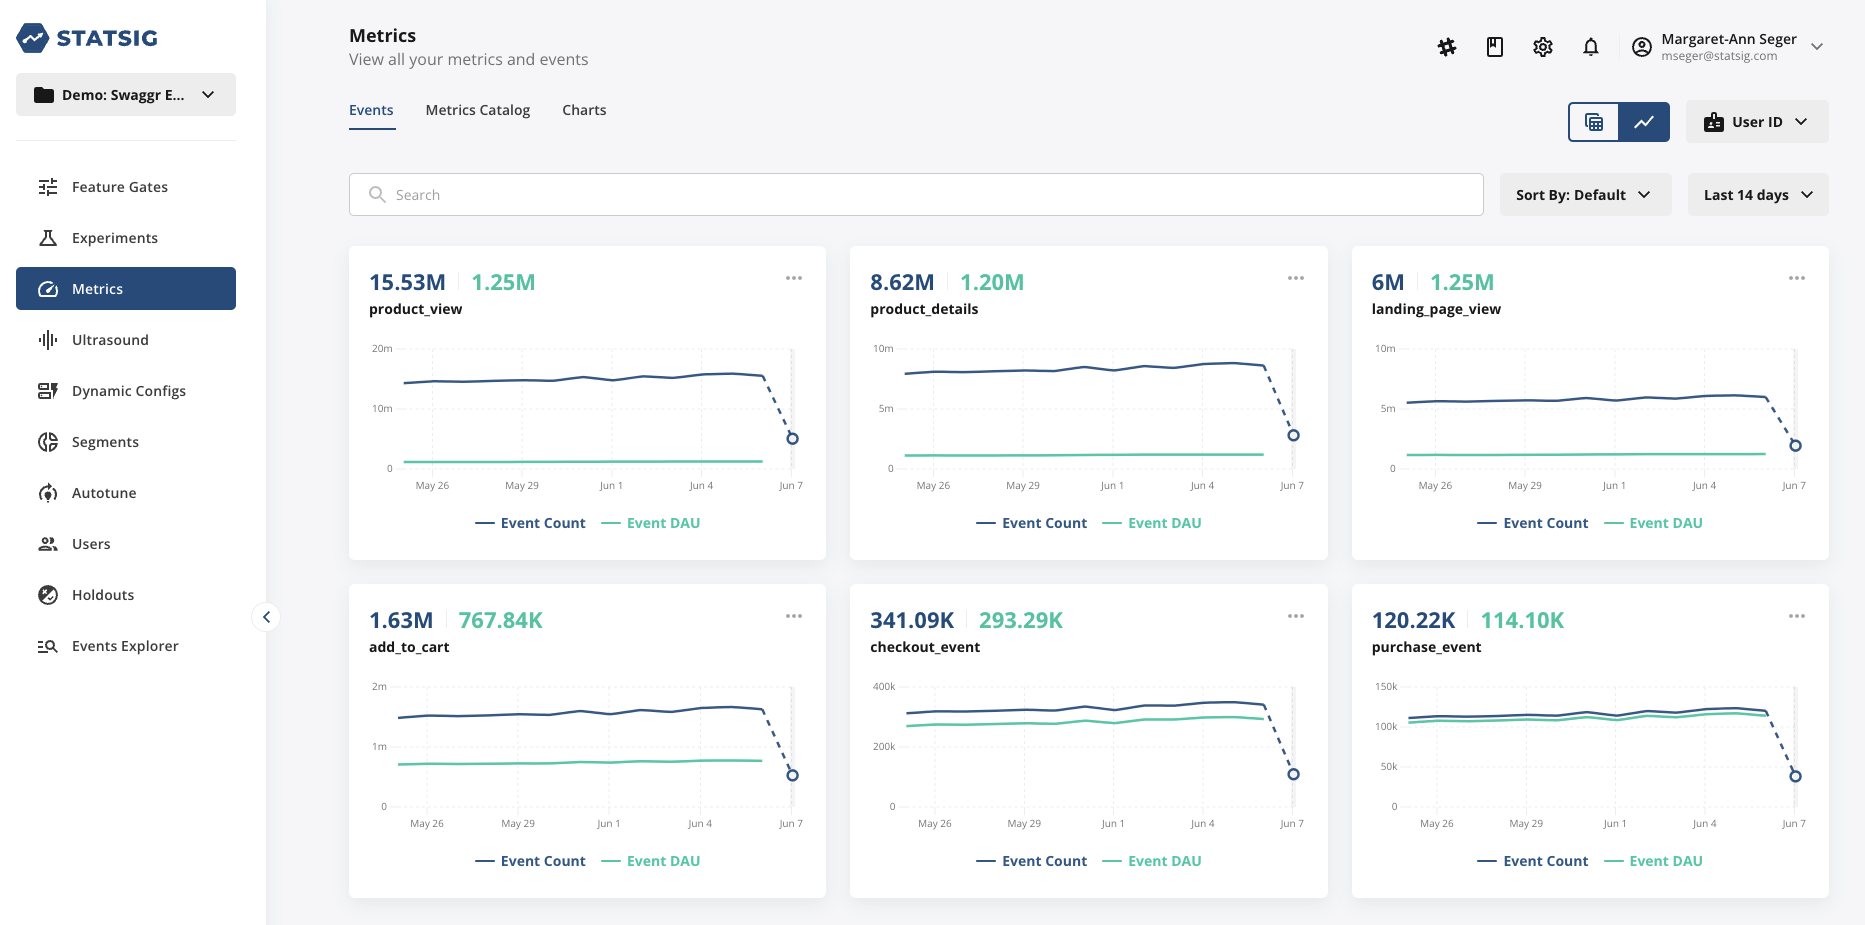
As you ingest custom events, they appear in the Metrics section under the Events tab in the Statsig console.
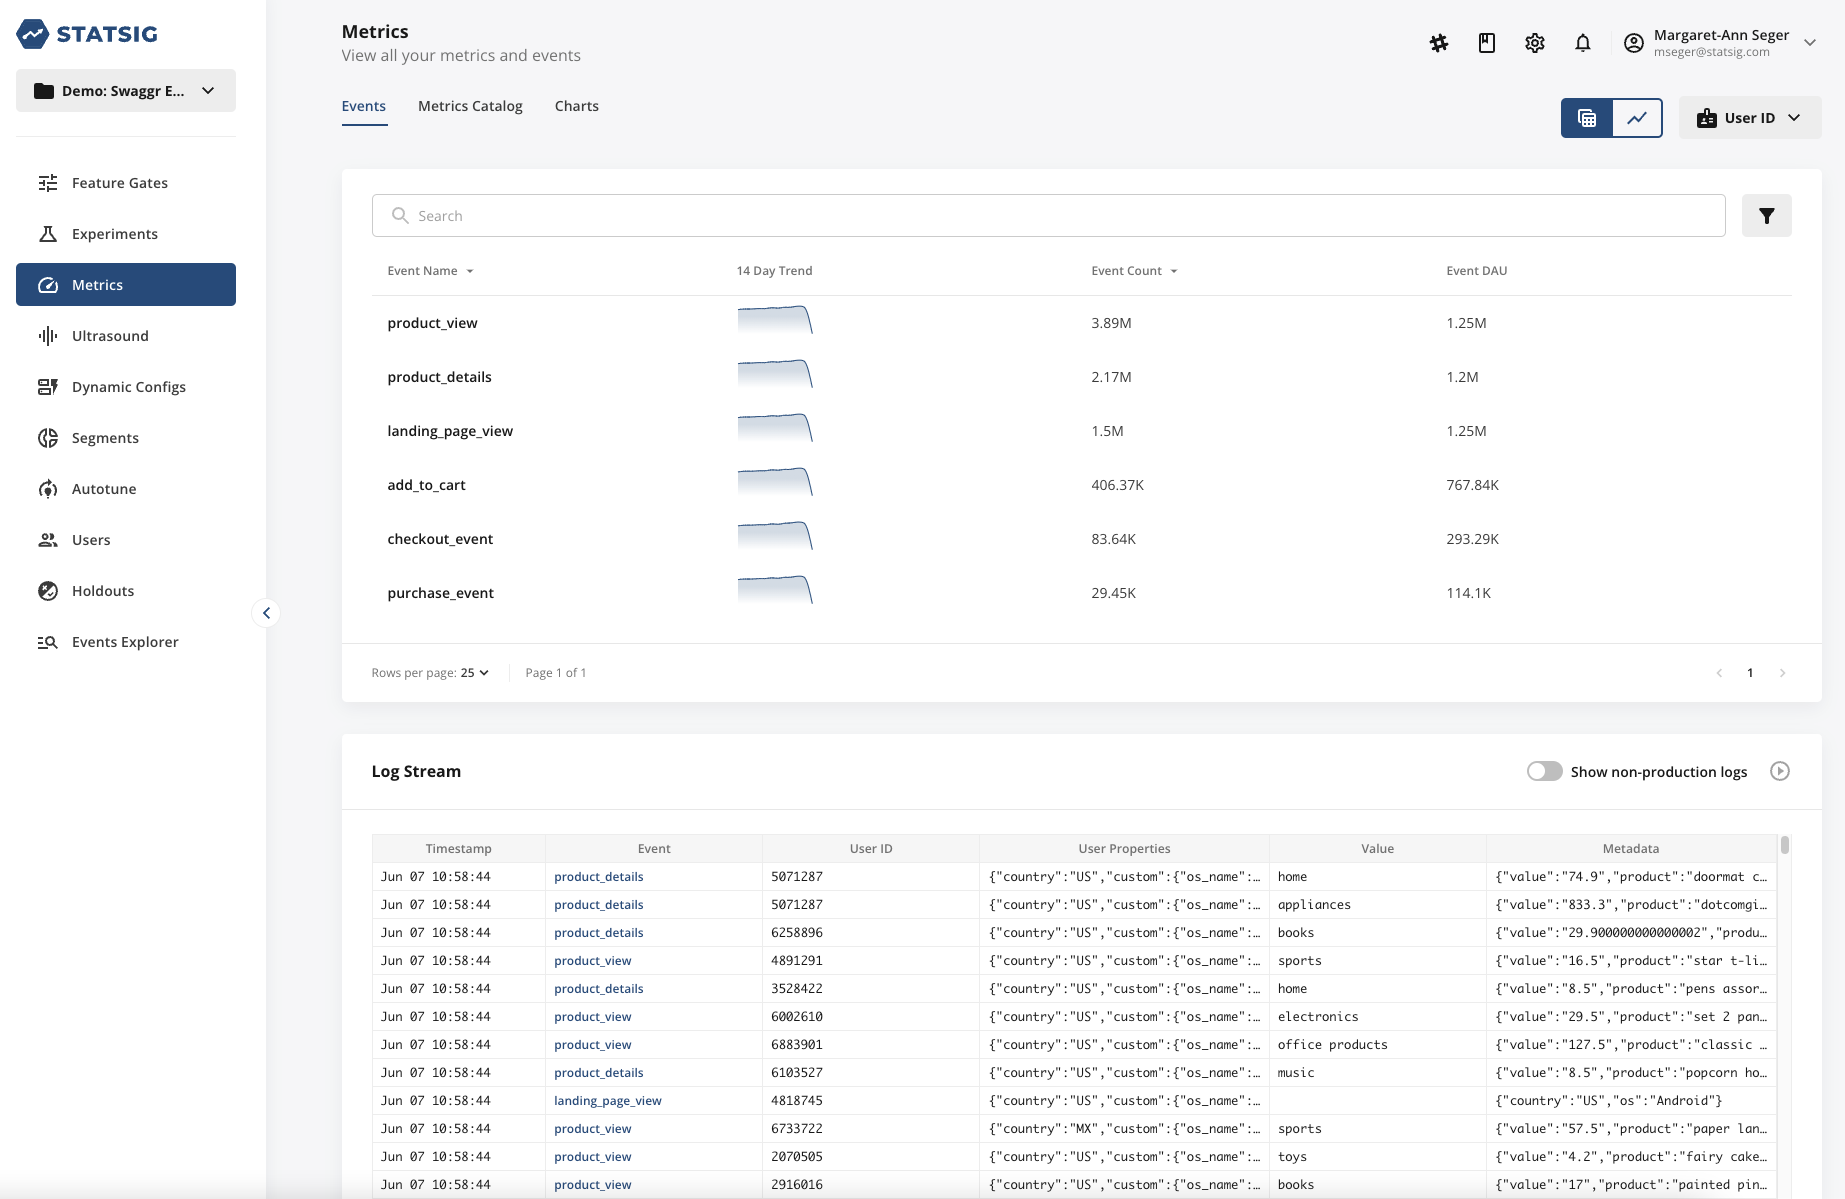
You can toggle between a list view or chart view of your events to view the trend line over time.
Billing
Statsig bills for the two types of raw events described above. Statsig bills only for production environment events.
Statsig records an Exposure Event for billing when you check a user for assignment in a Feature Gate or Experiment, or check for a value using a Dynamic Config.
Statsig doesn't bill the following checks:
- Statsig doesn't bill you for duplicate checks for the same user on the same Feature Gate, Experiment, or Dynamic Config within an hour.
- Statsig doesn't bill you for checks against Features Gates that are disabled.
- Statsig also doesn't bill you for checks for users who are in not participating in an experiment due to the allocation or targeting you have configured.
Statsig records a Custom Event for billing when you log an event using the Statsig SDK (or import from your data warehouse, or ingest from your data collector). Each event may contain multiple unit identifiers and can appear in multiple experiments.
- Statsig bills custom events only once, regardless of how many experiments use them.
Was this helpful?