How Metrics Work on Statsig
Understand the fundamentals of how metrics are calculated and used in Statsig experiments and feature gates.
How metrics work on Statsig
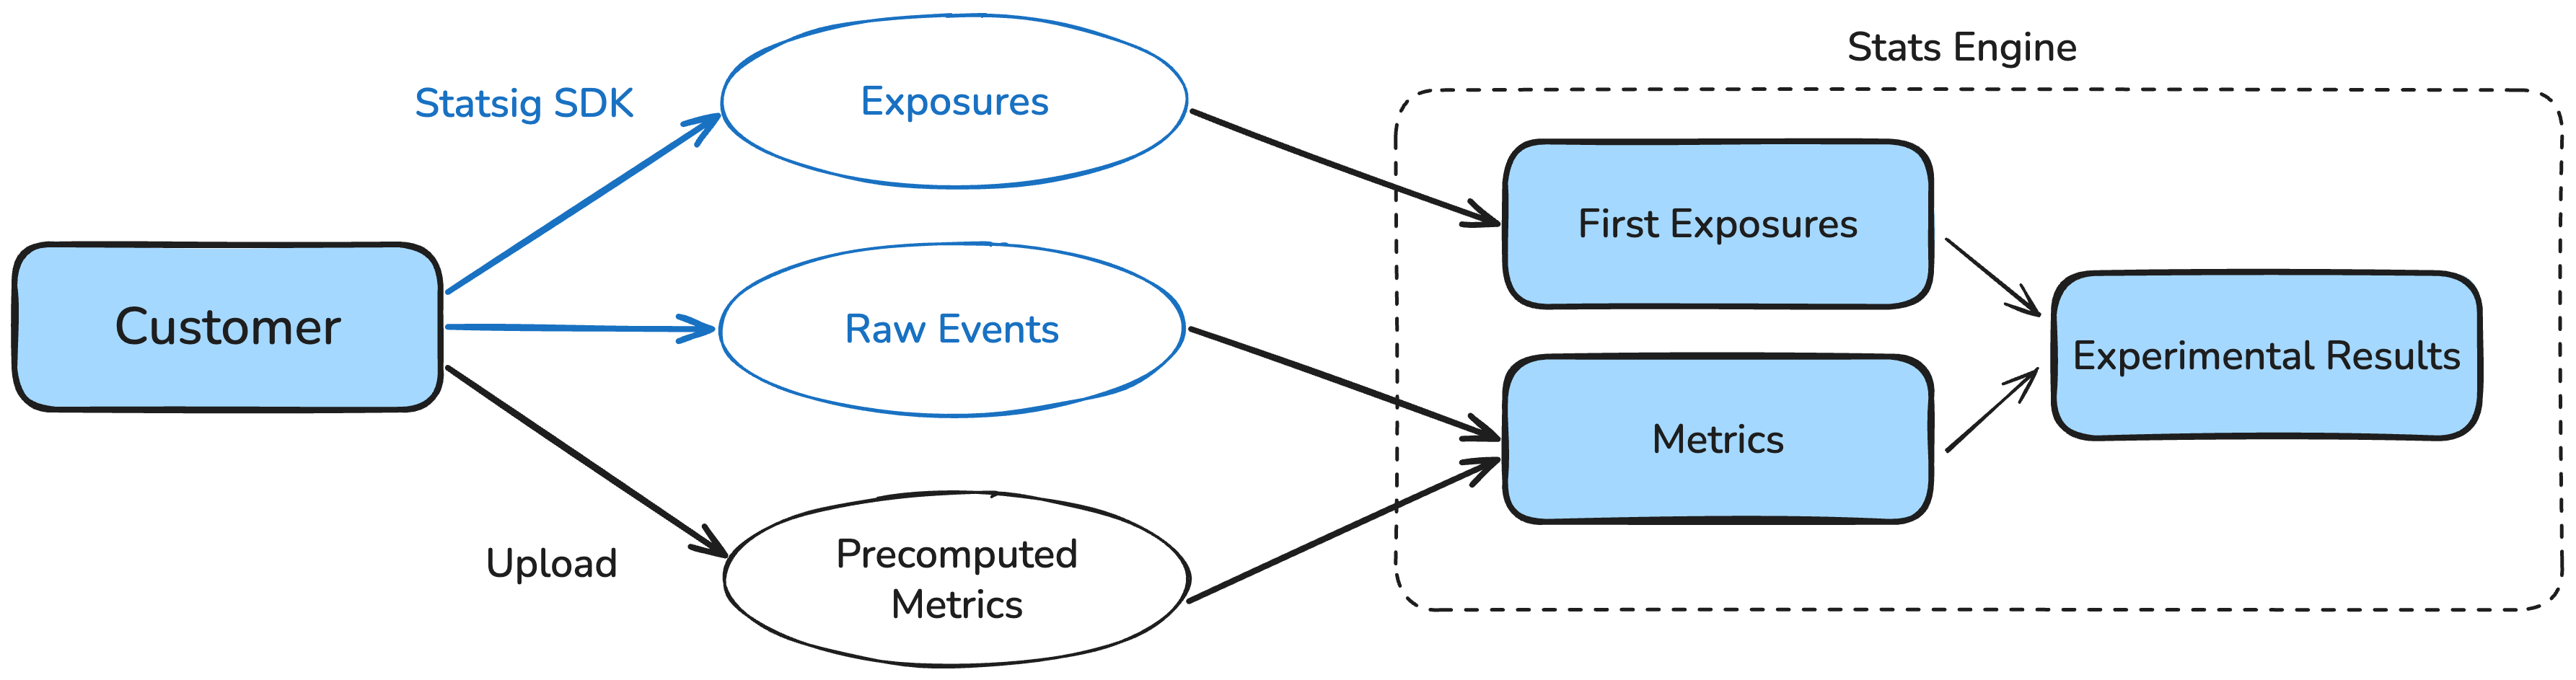
A metric in Statsig is a numeric value that Statsig tracks for each user on a given day. You aggregate this value across your entire user base or a subset, such as the test or control group of an experiment, to measure how your product performs. Statsig's Stats Engine joins these metrics with your exposure events to compute experiment results and analytics.
Warehouse Native users
: You're viewing the Cloud docs for this page. Metrics and experiments behave differently in Warehouse Native. Read more in About Warehouse Native.For example, say one user made two purchases on September 1st, and another made only one. You can aggregate these values across multiple users to calculate the total number of purchases across all users on September 1st.
By default, Statsig computes metrics from logged raw events in the production environment. When testing experiments in lower environments (such as development or staging) with Enable for Environments, you can track cumulative exposures and metric results from those environments. Tracking lower-environment data lets you validate your experiment setup before launching to production. Statsig prioritizes production data for final Pulse result analyses.
Sources of Statsig metrics
There are two fundamental sources of metrics in Statsig:
- Raw Events
- Statsig auto-generates certain metrics such as event_count and user accounting metrics from these events
- You can also define custom metrics using your logged raw events
- Precomputed Metrics: You can provide these pre-computed values to Statsig.
Statsig's Stats Engine joins these metrics with your exposure events from feature gates and experiments to compute experiment results and analytics.
How does Statsig bill events and metrics?
Statsig bills each event (or a row when importing from your data warehouse) once, regardless of how many experiments use the event.
Was this helpful?