Pulse Metrics
Learn how different metric types are computed and interpreted in Pulse experiment results.
Experiments with Statsig use Pulse to compute and communicate results. The metric type affects how Statsig computes and interprets the final result.
Statsig aggregates most metric types across all users in the group. For metric types that use ratios, Statsig aggregates only across participating users (users that have a non-null value for that metric). This article covers the metric types available in experiments and how to interpret their Pulse results.Pulse statistics by metric type
| Metric Type | Total | Mean | Units |
|---|---|---|---|
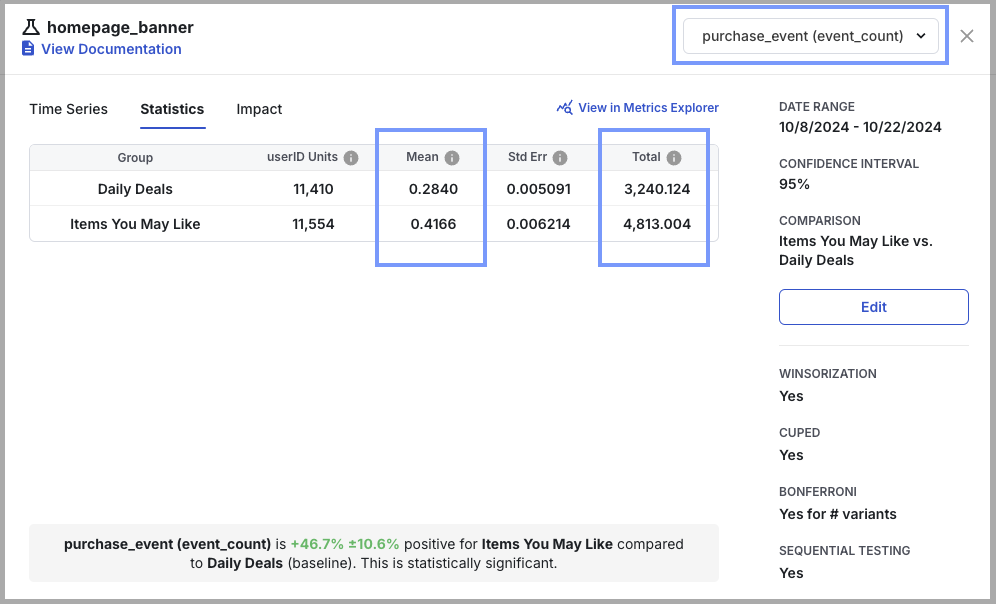
| event_count | Sum of events (99.9% winsorization applied) | Average events per user (99.9% winsorization applied) | All users |
| event_dau | Sum of event DAU (distinct user-day pairs) | Average event_dau value per user per day. Statsig calls this the "Event Participation Rate" because it represents the probability a user is DAU for that event. | All users |
| sum | Total sum of values (99.9% winsorization) | Average value per user (99.9% winsorization) | All users |
| mean | Overall mean value | Overall mean value | Participating users |
| event_user | Count of distinct users that have had the event. | Average metric value per user per day. Depending on Rollup Mode, can be a one-time event or daily participation rate. | All users |
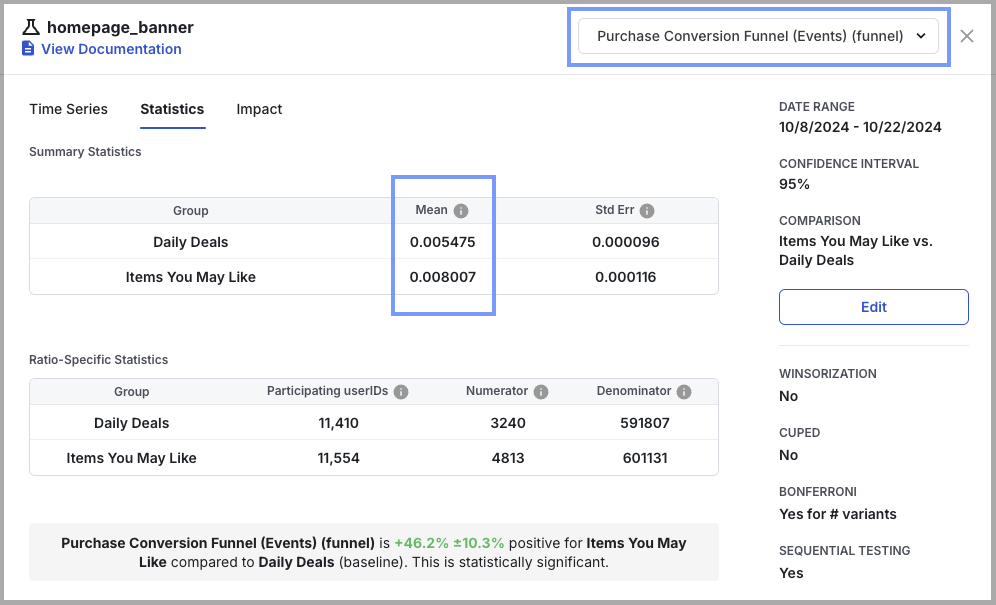
| ratio | Not shown | Overall ratio: sum(numerator values)/sum(denominator values) | Participating users |
| funnel | Not shown | Overall ratio: sum(numerator values)/sum(denominator values) | Participating users |
| user: dau, wau, mau_28day | Not shown | Average metric value per user per day. The probability that a user is xAU | All users |
| user: new_dau, new_wau, new_mau_28day | Count of distinct users that are new xAU at some point in the experiment | Fraction of users that are new xAU | All users |
| user: retention metrics | Overall average retention rate | Overall average retention rate | Participating users |
| user: L7, L14, L28 | Not shown | Average L-ness value per user per day | All users |
| count_distinct | Total number of unique values | Average number of unique values per user | All users |
Some example metric breakdowns in Pulse:
Event count and event DAU in Pulse
event_dau Legacy Support
: event_dau metrics are now in legacy support only, and Statsig no longer creates them for new events. Existing event_dau metrics remain available for any of your new experiments, and Statsig continues to compute them daily. For all new events, you should create an event_user metric to measure daily active users.
- event_count measures the volume of the activity based on count of events triggered
- event_dau measures unique daily users who triggered a given event
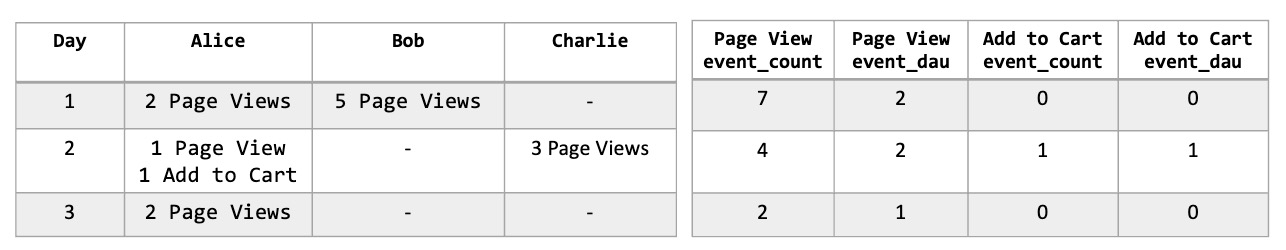
For example, the table below shows the event_count and event_dau metrics for two event types, Page Views and Add to Cart, for three users over three days.
Over the duration of an experiment, Pulse results measure the change in:
- the mean event_count, or the average event count per user
- the mean event_dau, or average active days per user: Statsig calls this the Daily Event Participation Rate
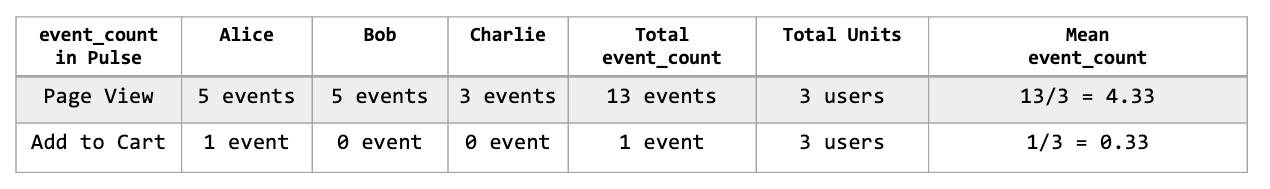
For example, the table below shows the Total event_count, Total Units, and Mean event_count over the same three days as above, now in the context of an experiment.
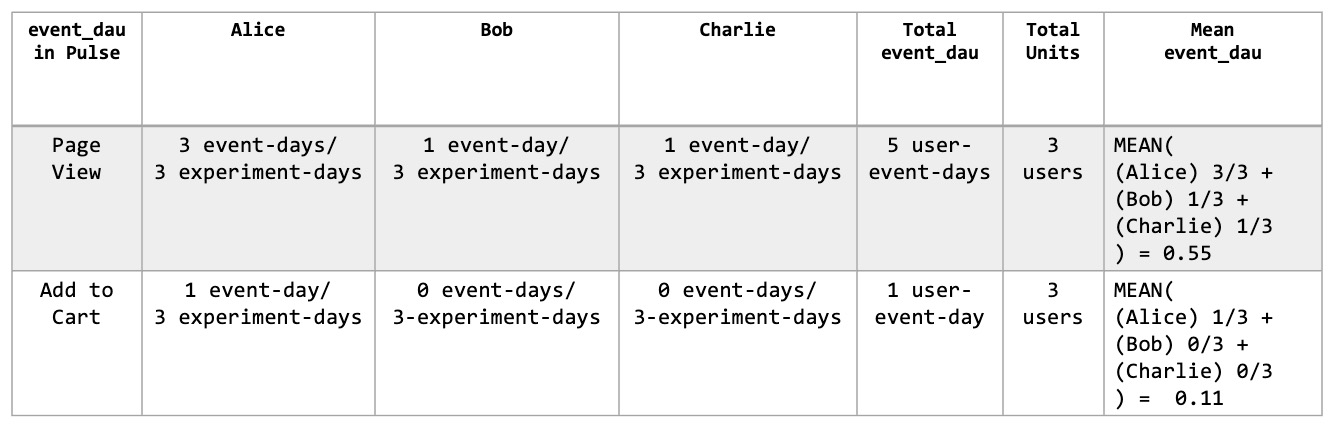
The table below shows the Total event_dau, Total Units, and Mean event_dau over the same three days of the experiment. Alice was active on three days for the Page View event and on one day for the Add to Cart event. Alice's average event_dau is 3/3 for the Page View event and 1/3 for the Add to Cart event. Alice's daily participation rate is 1.00 for the Page View event and 0.33 for the Add to Cart event. Statsig aggregates the average event_dau for each user in the experiment, with each user weighted equally.
To measure engagement changes for a call-to-action link or button, use two metrics. Use event_count to measure the change in average clicks per user, and use event_dau to measure the change in the daily participation rate for the click.
Event Count and Event DAU in Custom Metrics
: When creating a custom ratio metric, use event_count to include all events (counting all events triggered by the same user). Use event_user (or event_dau, if available) to count unique active users on a given day (all events triggered by the same user are counted as one).
Winsorization
To reduce the impact of outliers, Statsig caps event_count and sum metric types at the 99.9th percentile by default. The cap reduces the risk that bots and extreme values skew experiment results.
Statsig computes the 99.9th percentile threshold using all non-zero and non-null metric values. Statsig replaces all values exceeding this limit with the threshold value.
Warehouse Native (WHN) allows for more customization of winsorization by metric and by percentile.
Frequently asked questions
1. Can a ratio metric move in the opposite direction from both the numerator and denominator metrics?
Yes, the ratio can rise while both the numerator and denominator metrics decline. This happens when the denominator falls more than the numerator. Statsig recommends tracking the numerator and denominator as independent metrics when monitoring a ratio metric. Ratio metrics are often subject to statistical noise and can be difficult to use for obtaining a statistically significant result.
2. For ratio metrics, how does Statsig determine participating users?
Statsig computes ratio metrics only for users with a non-zero value in the denominator. A user must trigger the denominator event on a given day to appear in the daily ratio. Statsig excludes users who don't trigger the denominator event during an experiment from the test vs. control comparison.
3. What is the difference between One-Time Event and Daily Participation Rate?
This distinction is relevant only in the context of an experiment. Daily participation rate counts the number of days a user has that event, divided by the number of days the user has been in the experiment. One-time event is a binary metric that checks whether the user has that event at least once during the experiment.
Was this helpful?