Metrics Dashboard
Explore your metrics and events through the Statsig console with real-time visualization and organization tools.
Events
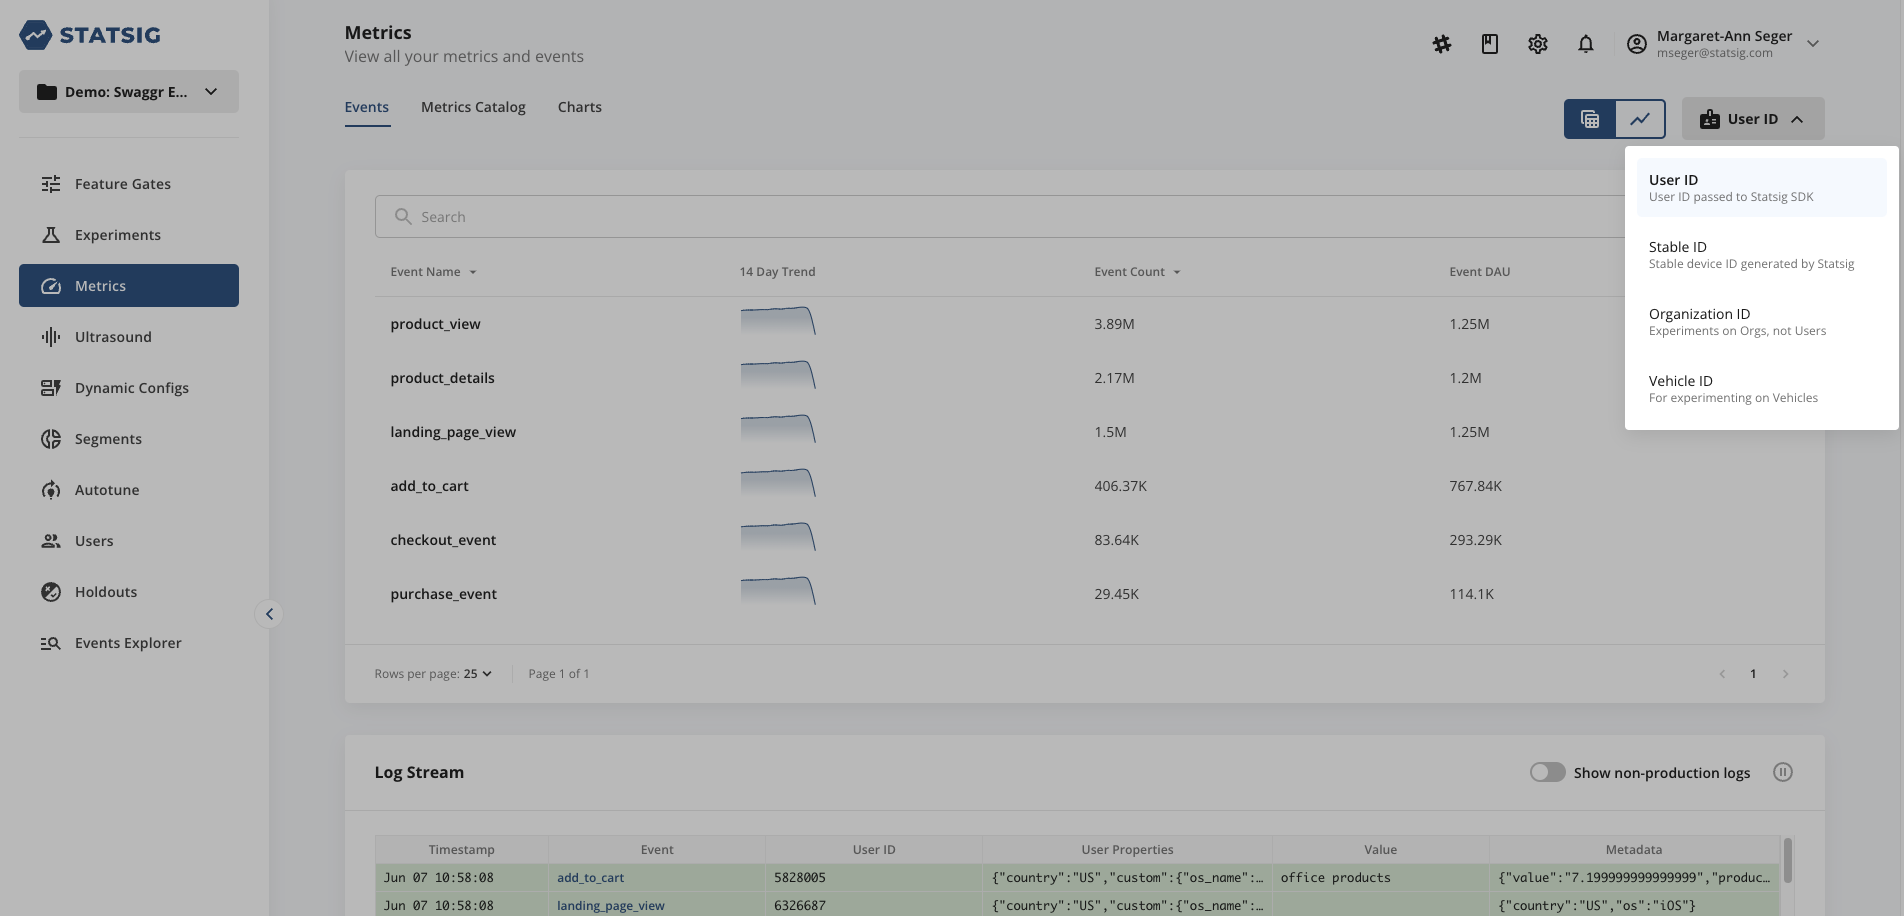
The Metrics console lets you visualize all the events that you have logged in Statsig. The Events tab shows all the events, including a real-time stream of events as they come in.
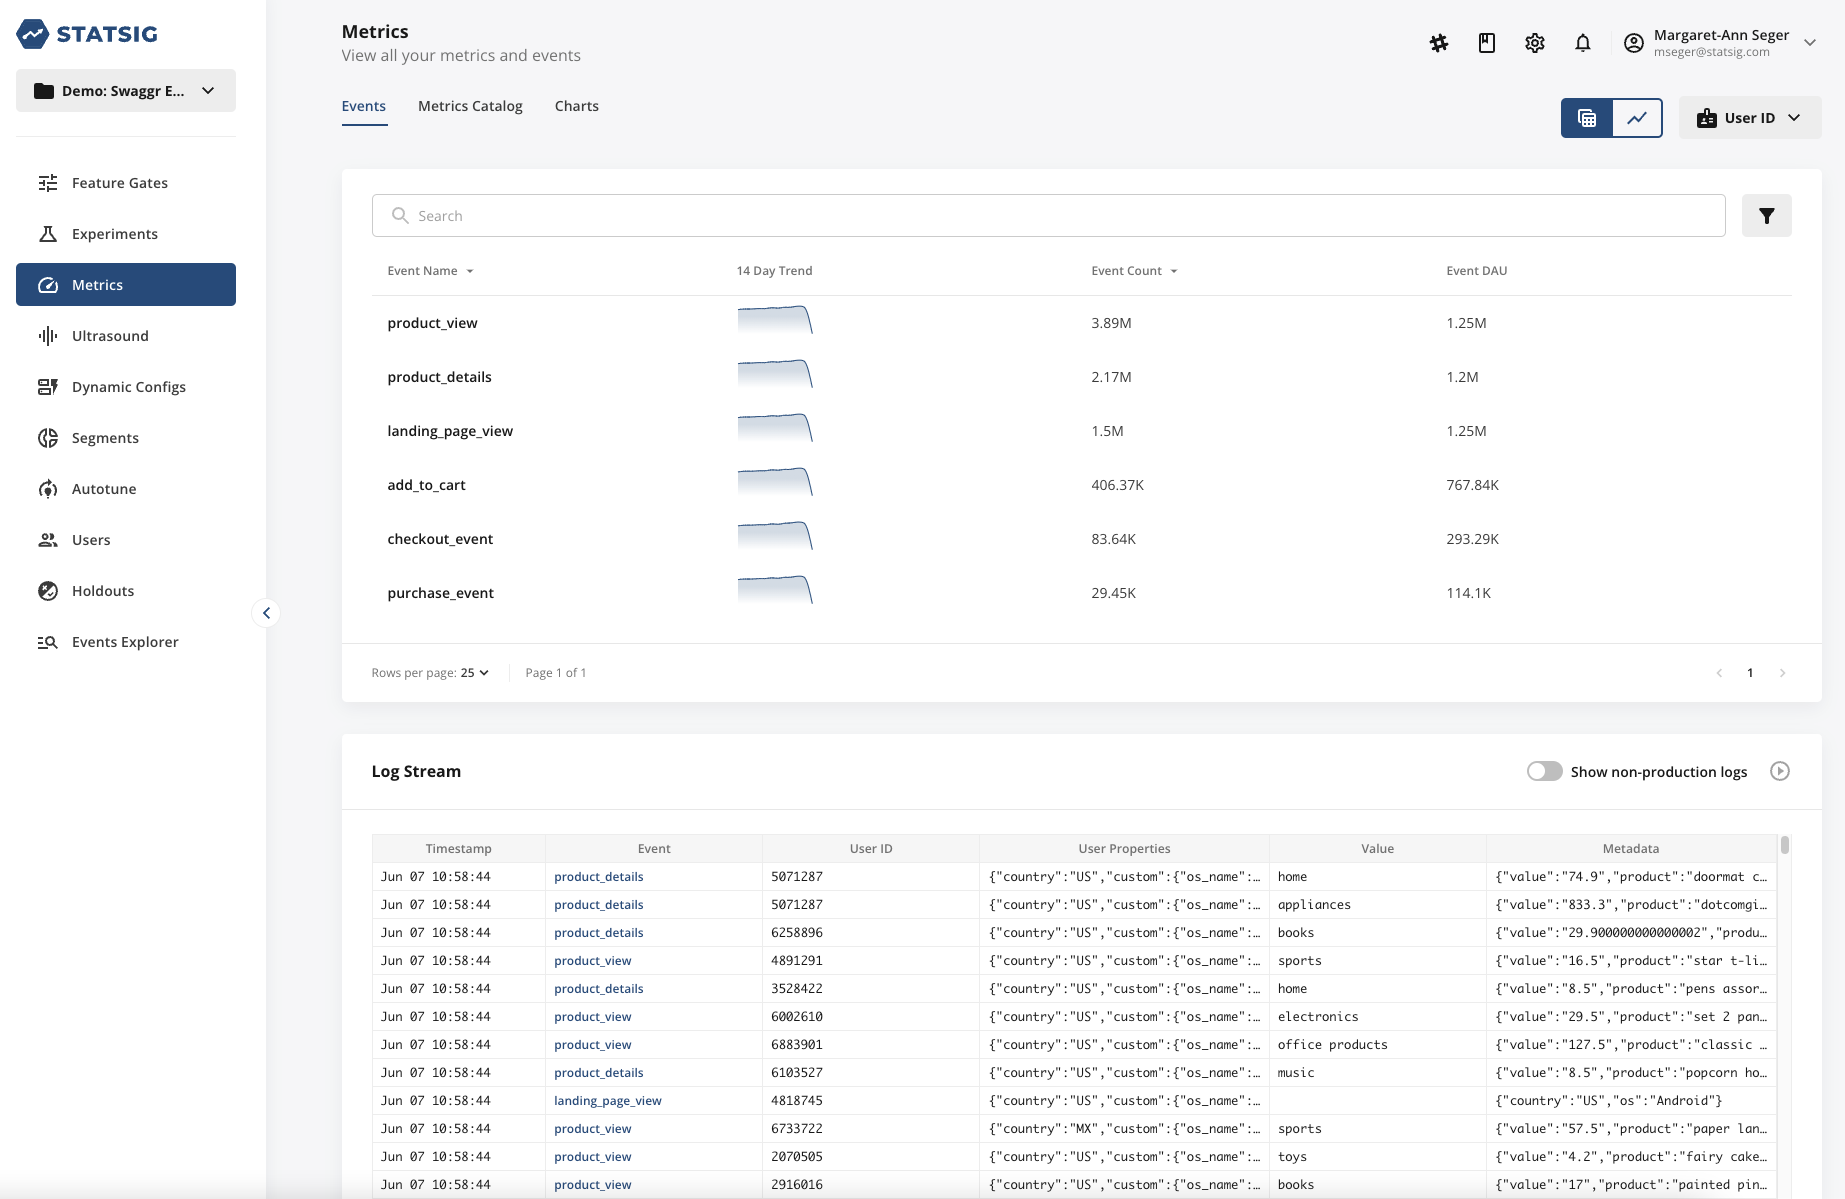
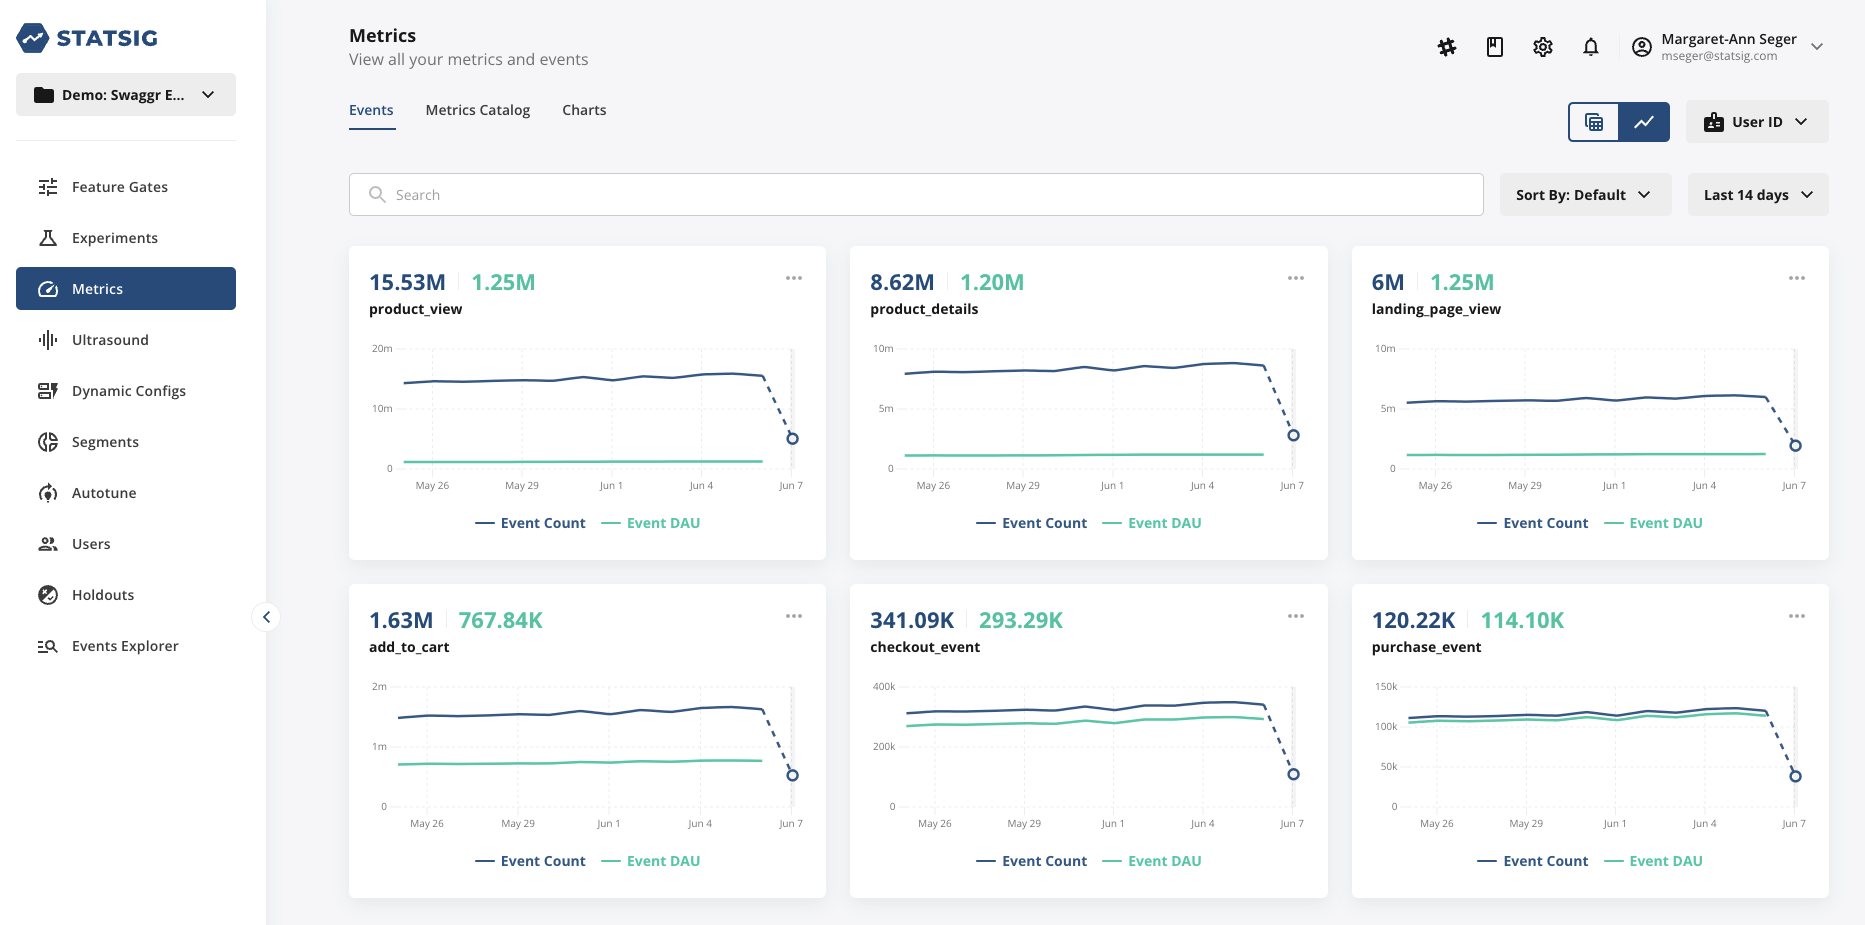
You can toggle between a list view or chart view of your events to view the trend line over time.
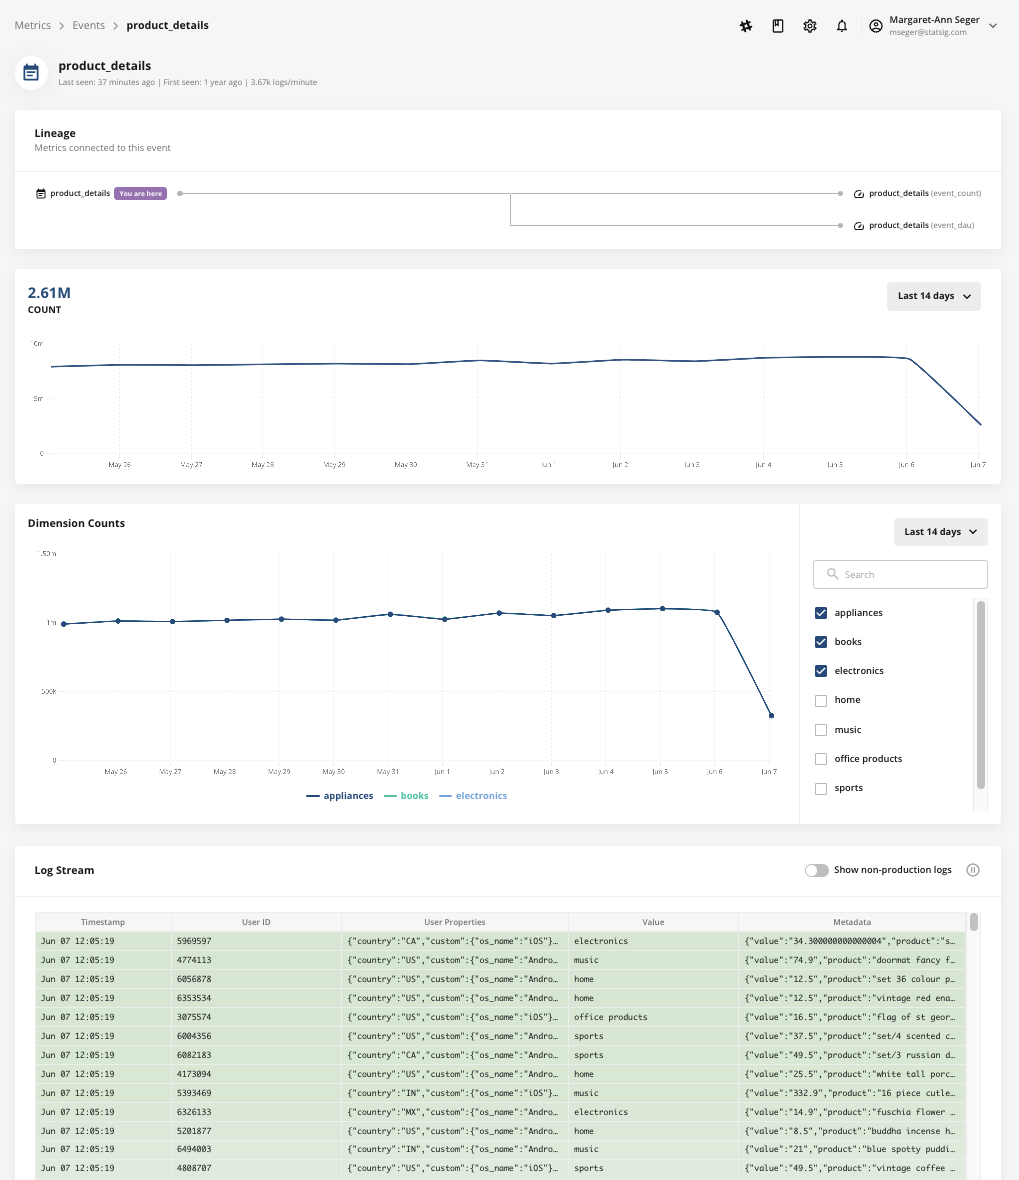
From the Events tab, you can drill into each event to see a detailed view of the logs, broken down by each unique value you logged.
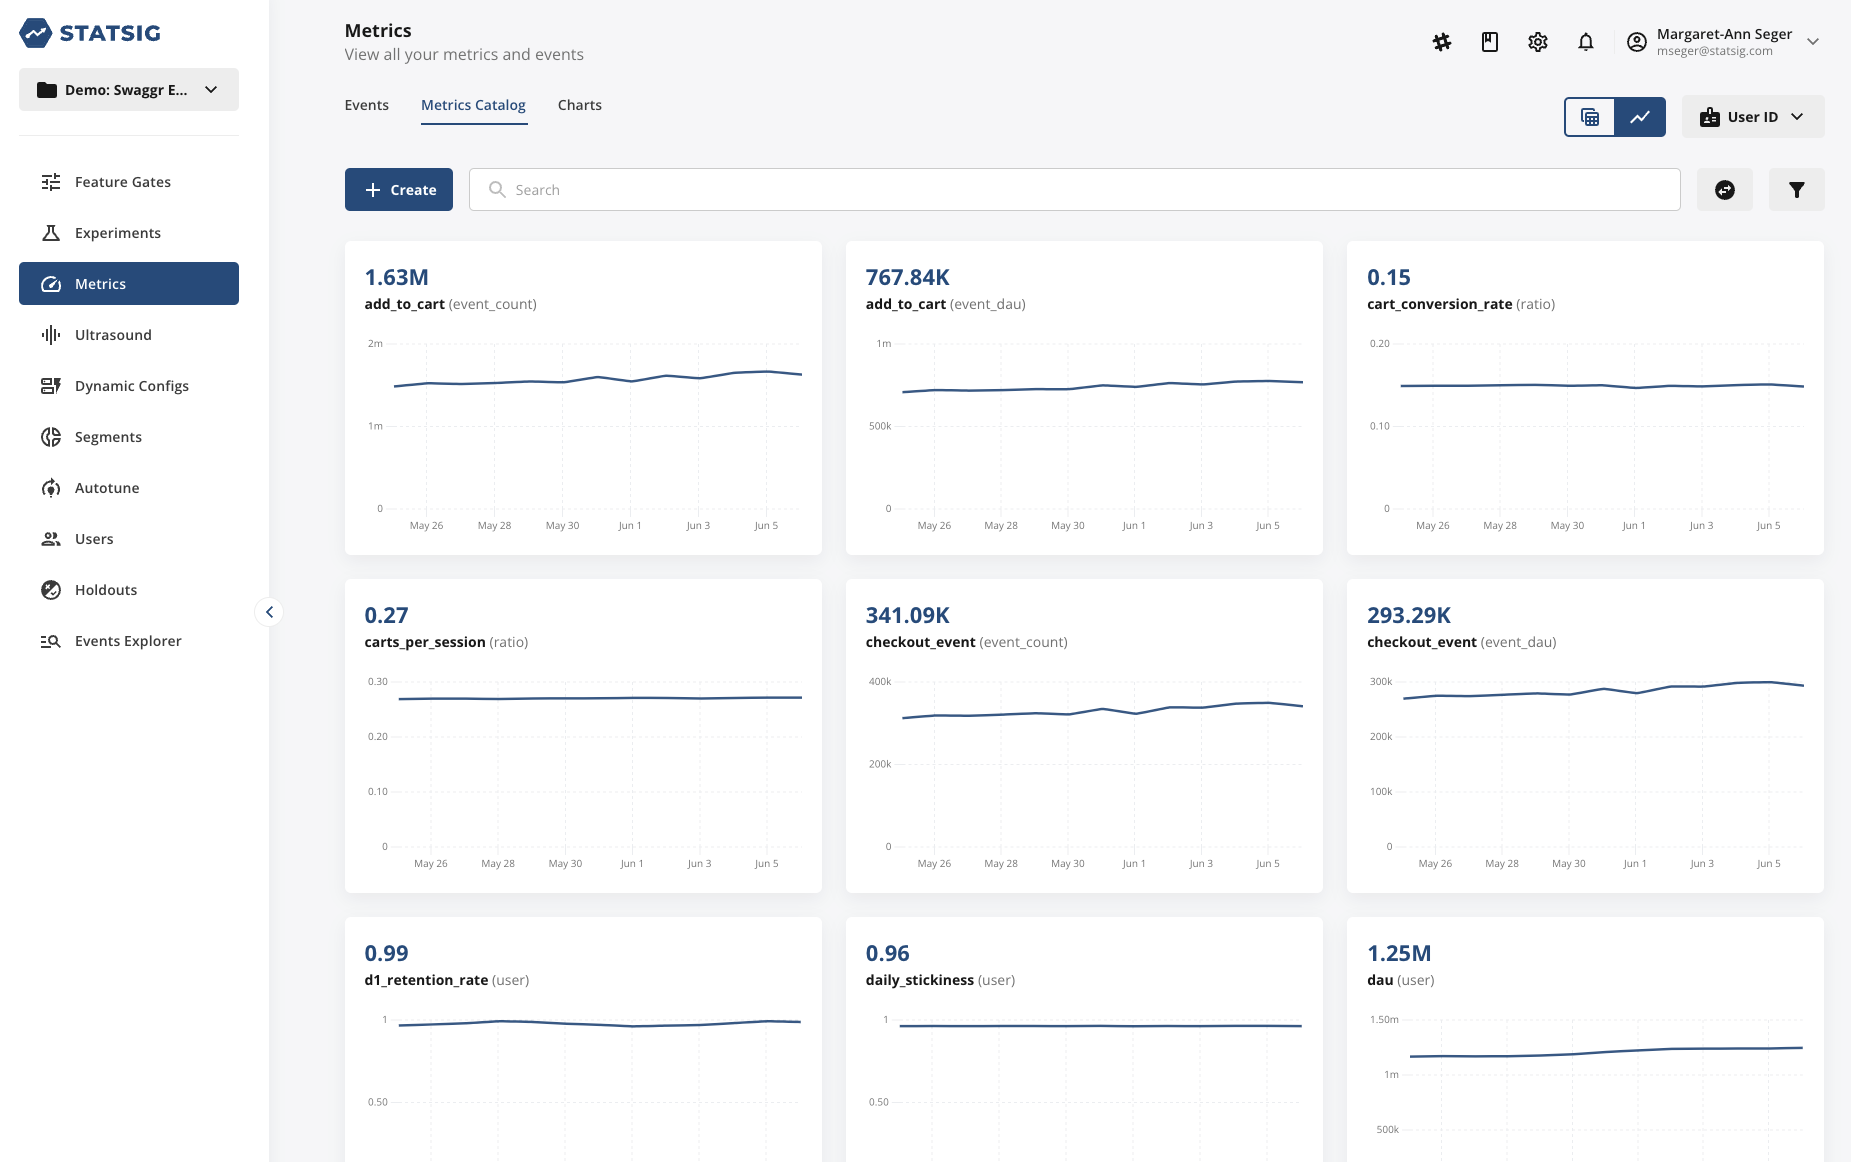
Metrics Catalog
The Metrics Catalog tab lets you search and tag your metrics, as well as create custom metrics. Tags let you organize metrics and create collections grouped by product area, business function, business objective, or any other common attribute. You can also create a collection of guardrail metrics that teams check in every experiment to detect unexpected effects in other parts of the business. After you create a tagged collection, you can filter your experiment results to that collection and focus on the metrics that matter.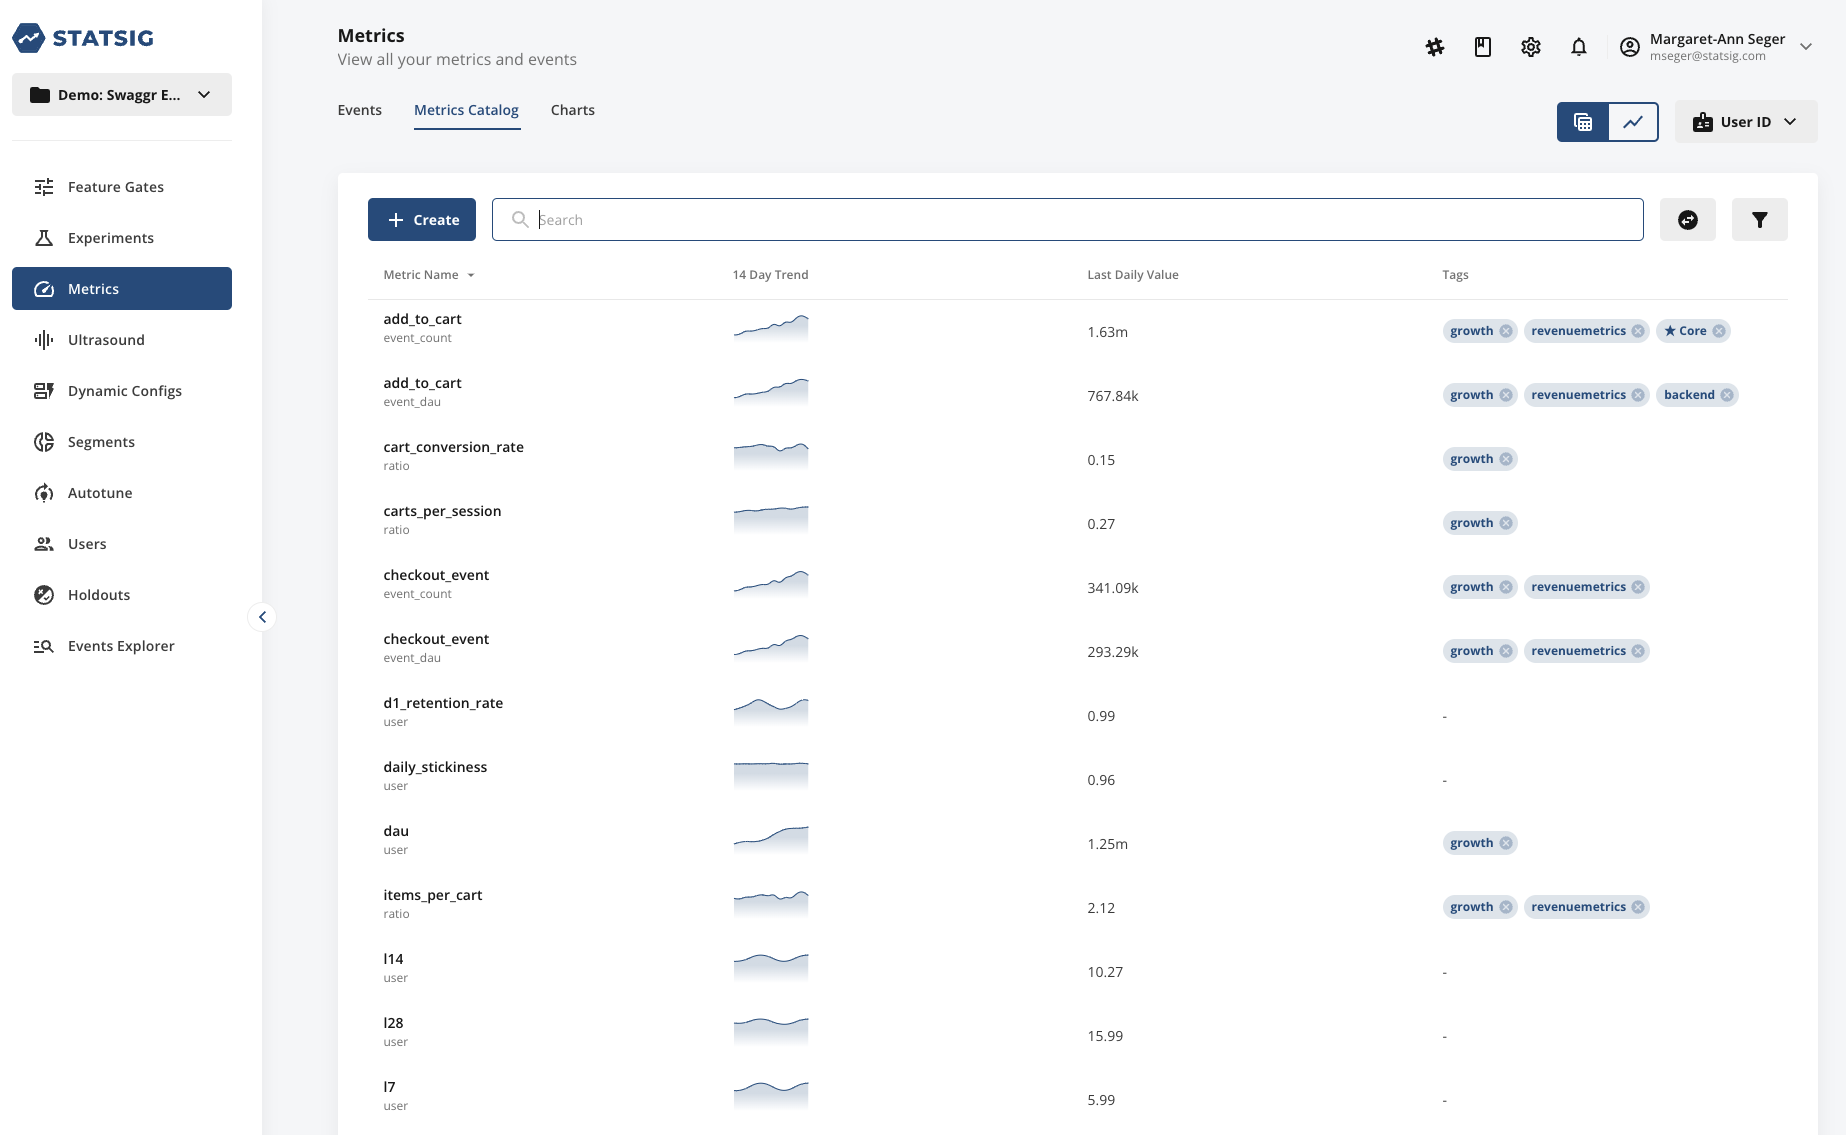
Similar to the Events tab, you can toggle between a list view or chart view of your metrics to view the trend line over time.
Was this helpful?