Offline Evals
Run offline AI evaluations in Statsig to grade model outputs against fixed test sets and catch regressions before exposing changes to real users.
What are offline evals
Offline evals provide quick, automated grading of model outputs on a fixed test set. They catch wins and regressions before you expose changes to any real users. For example, compare a new support bot's replies to human-curated answers to decide if the bot is ready to ship. Use offline evals when you have a fixed test set with ideal answers to grade against. Use online evals instead when you want to grade output on live production traffic without a ground truth to compare against.
Steps to run offline evals on Statsig:
- Create a Prompt that contains the instruction for your task (for example, "Classify tickets as high, medium, or low urgency based on ticket text").
- Upload a sample dataset with example inputs and ideal answers (for example, Ticket1 text to High; Ticket2 text to Low).
- Run your AI on the dataset to produce output (for example, classify each ticket).
- Grade or score the outputs by comparing the ideal answers in the dataset with the AI-generated output.
- Create multiple versions of your prompts, compare scores across versions, and promote the best one to Live.
Create/analyze an offline eval in 10 minutes
1. Create a Prompt within Statsig
This captures the instruction you provide to an LLM to accomplish your task. Use the Statsig Node or Python Server Core SDKs to retrieve this prompt within your app. You can create multiple versions of the prompt as you iterate and choose which one is "live" (retrieved by the SDK).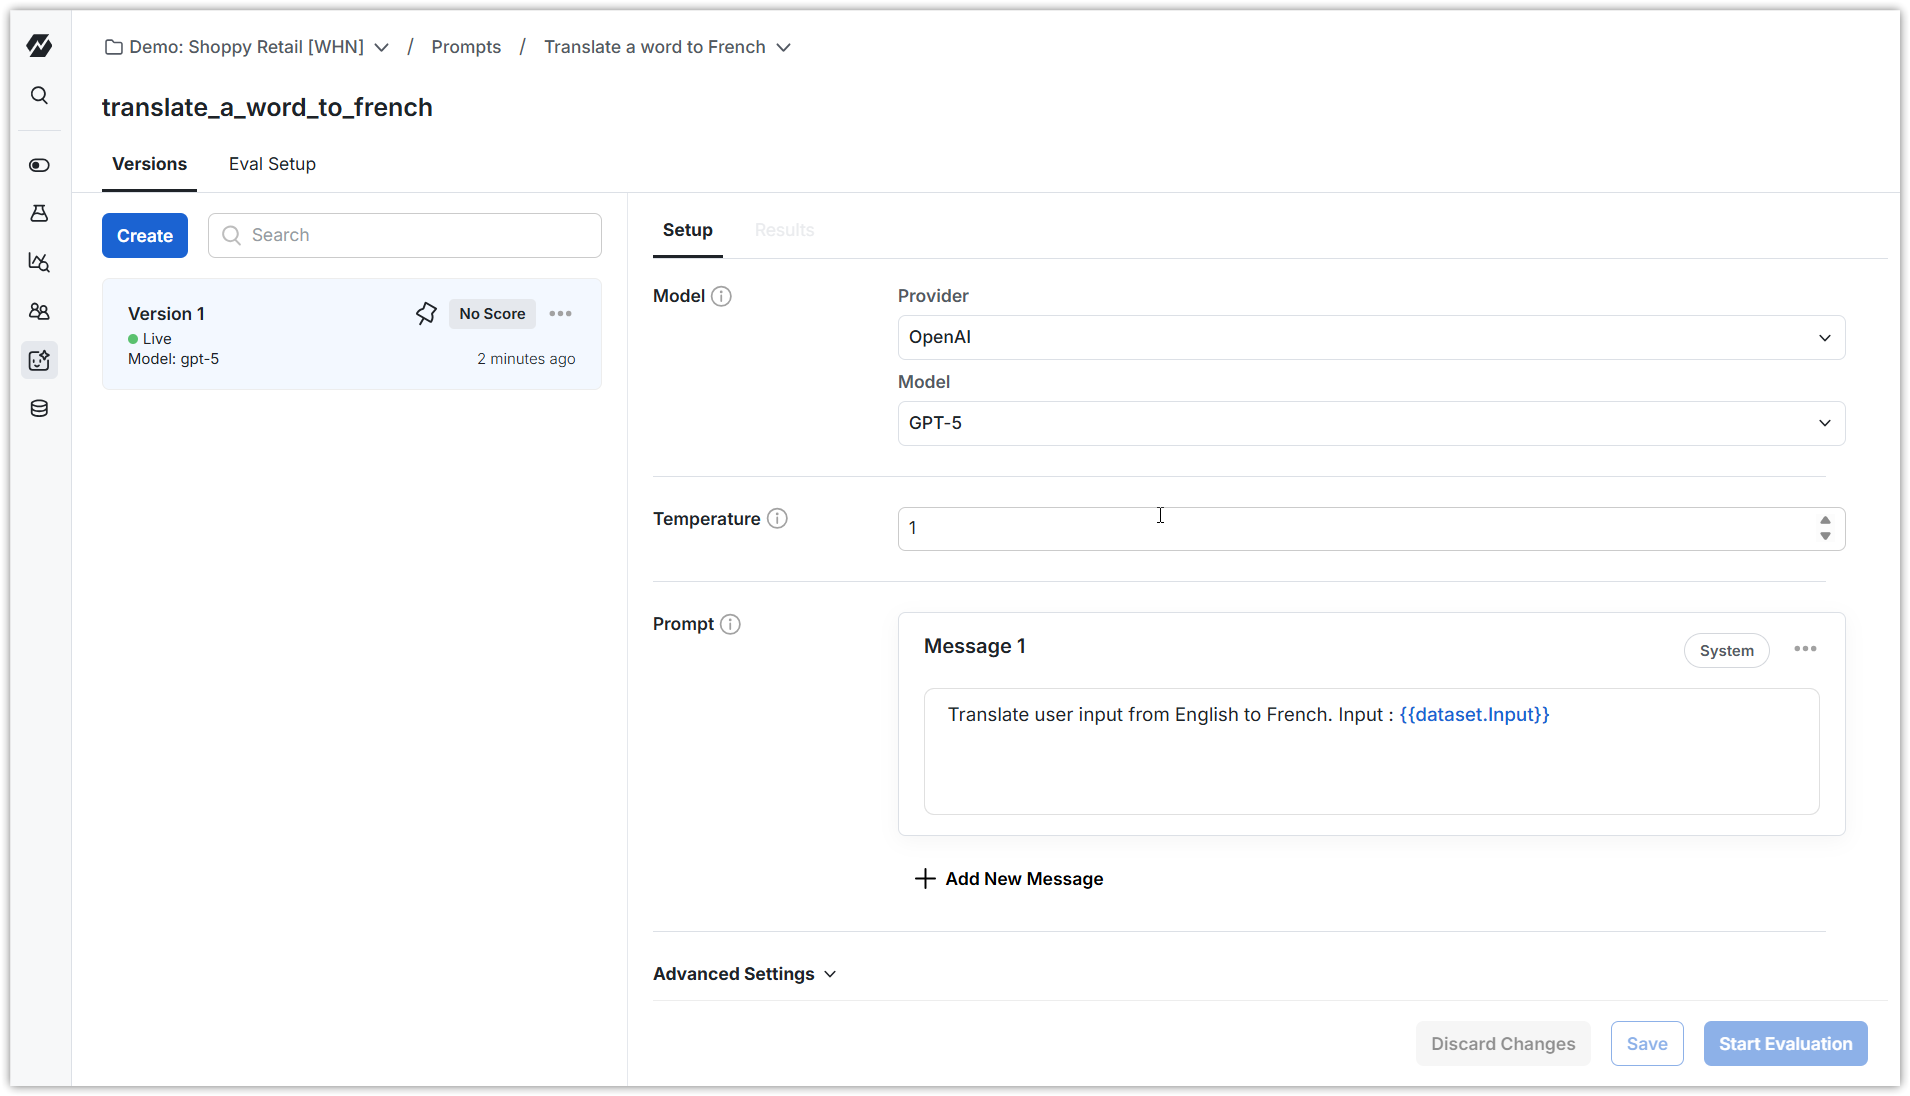
2. Create a dataset you can use to evaluate LLM completions for your prompt
For the example above, this might be a list of words alongside known good translations in French. You can enter small lists manually, or upload a CSV.
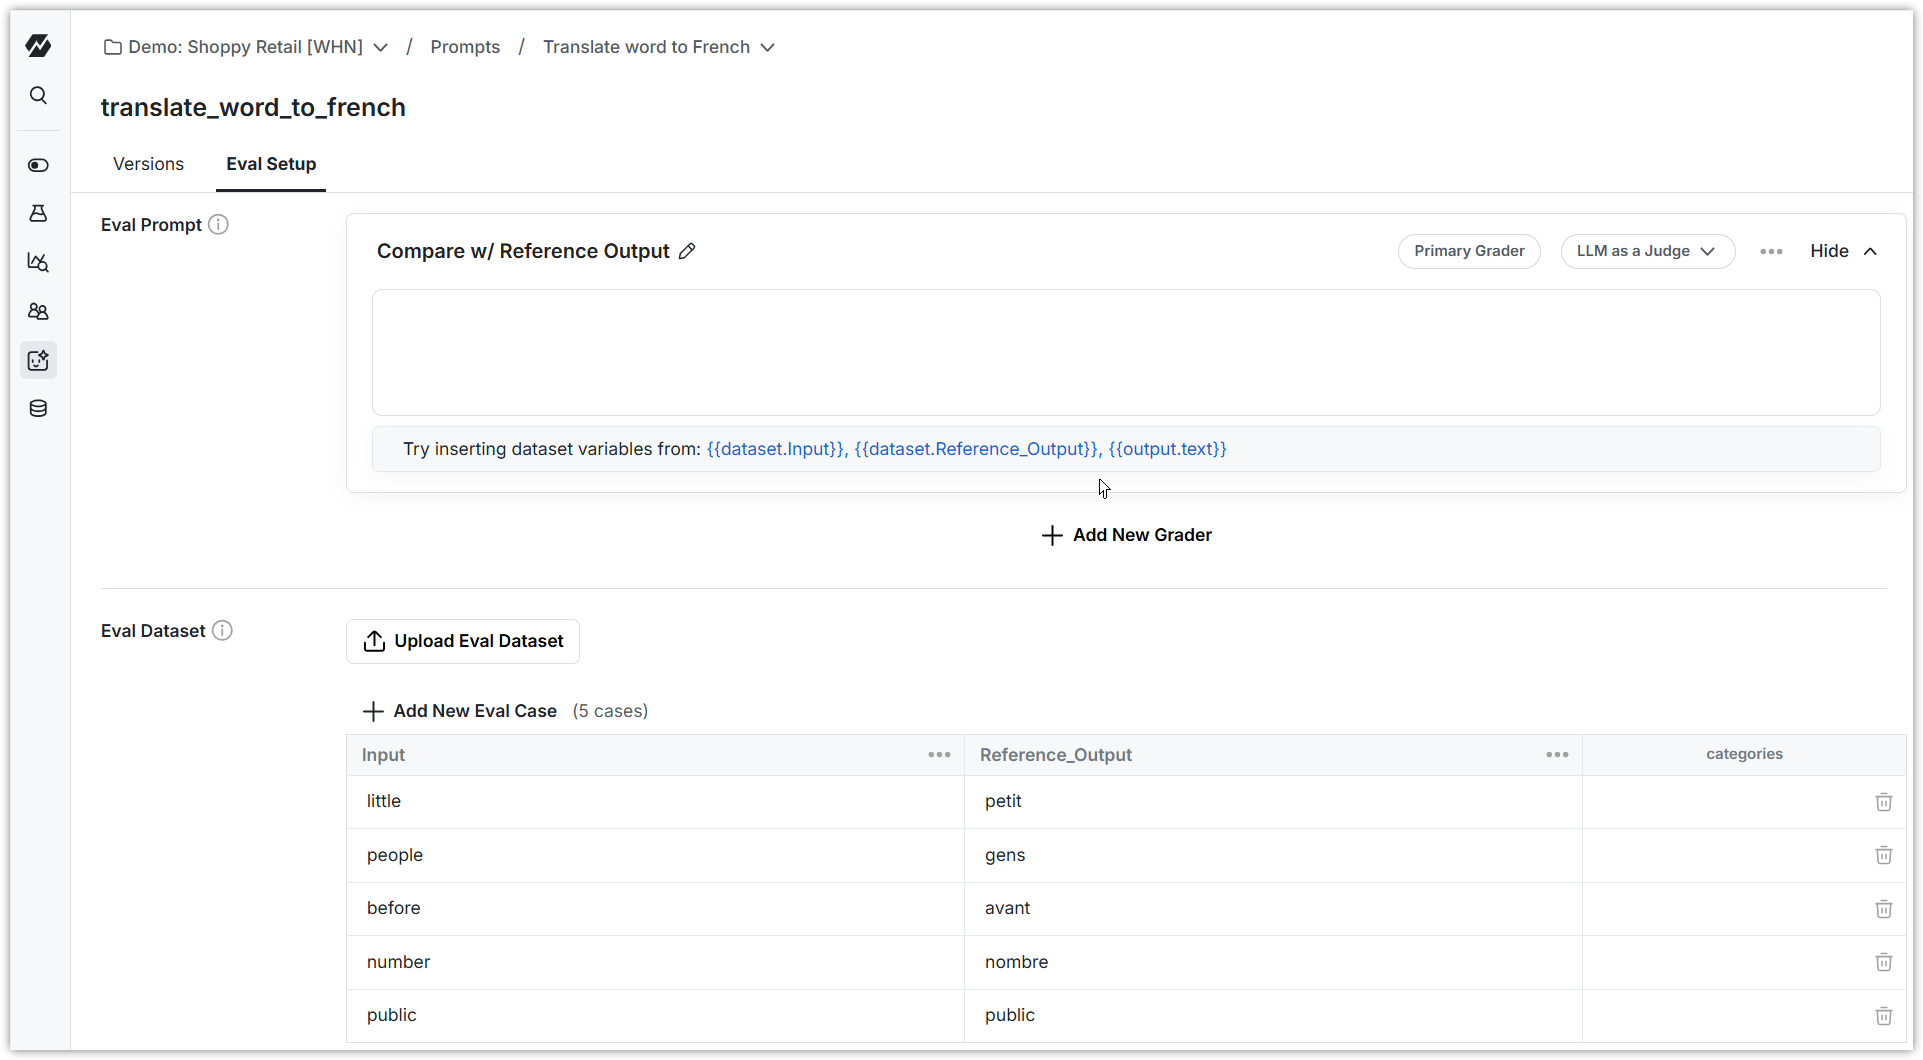
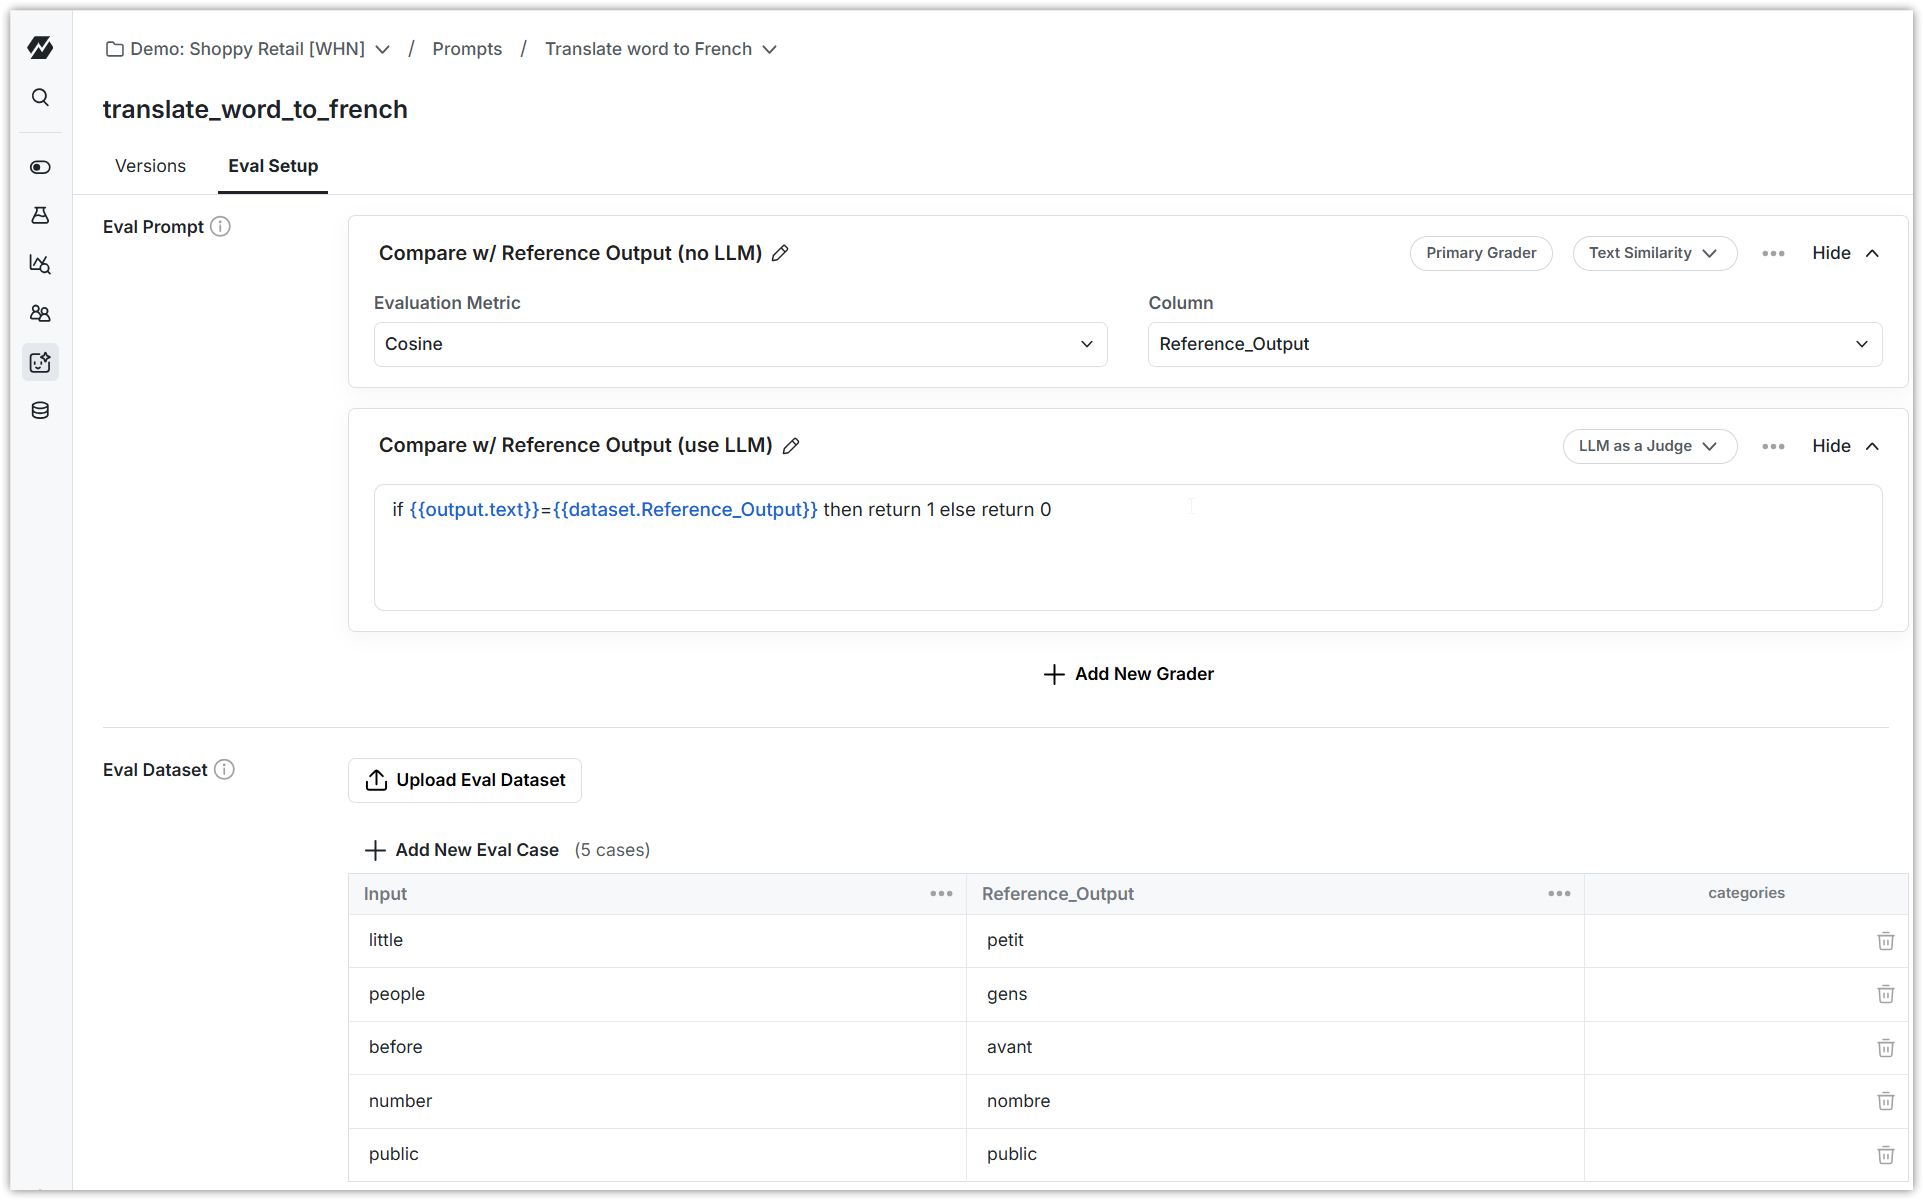
3. Create a grader that grades LLM completions for your prompt
Configure a grader that compares the LLM completion text with the reference output. Use one of the built-in string evaluators, or configure an LLM-as-a-judge evaluator that mimics a human's grading rubric.
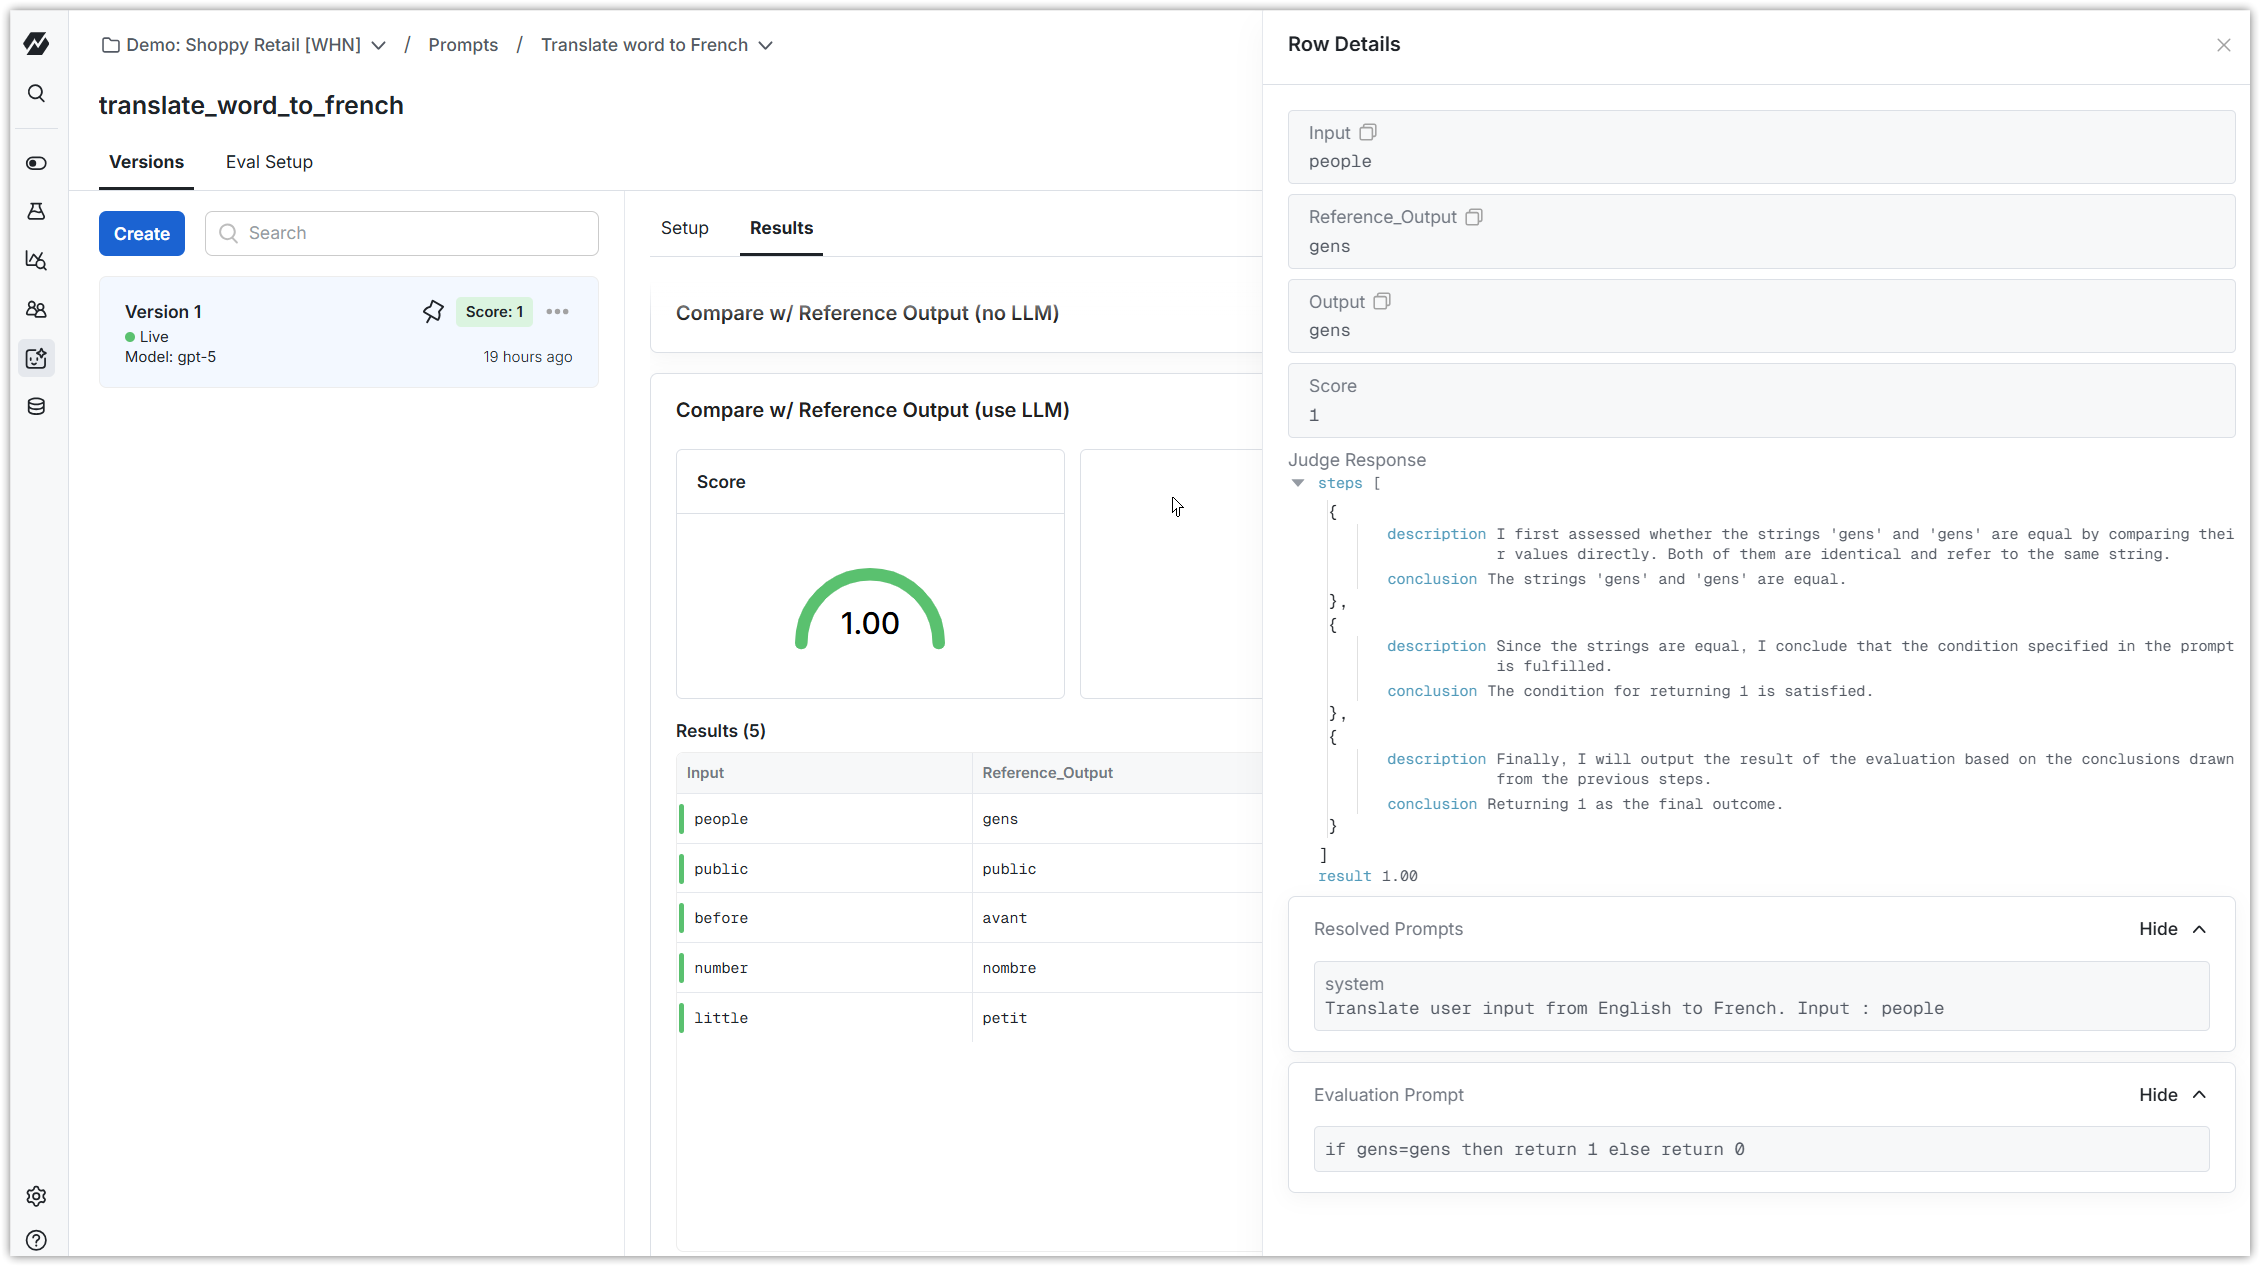
4. Run evaluation
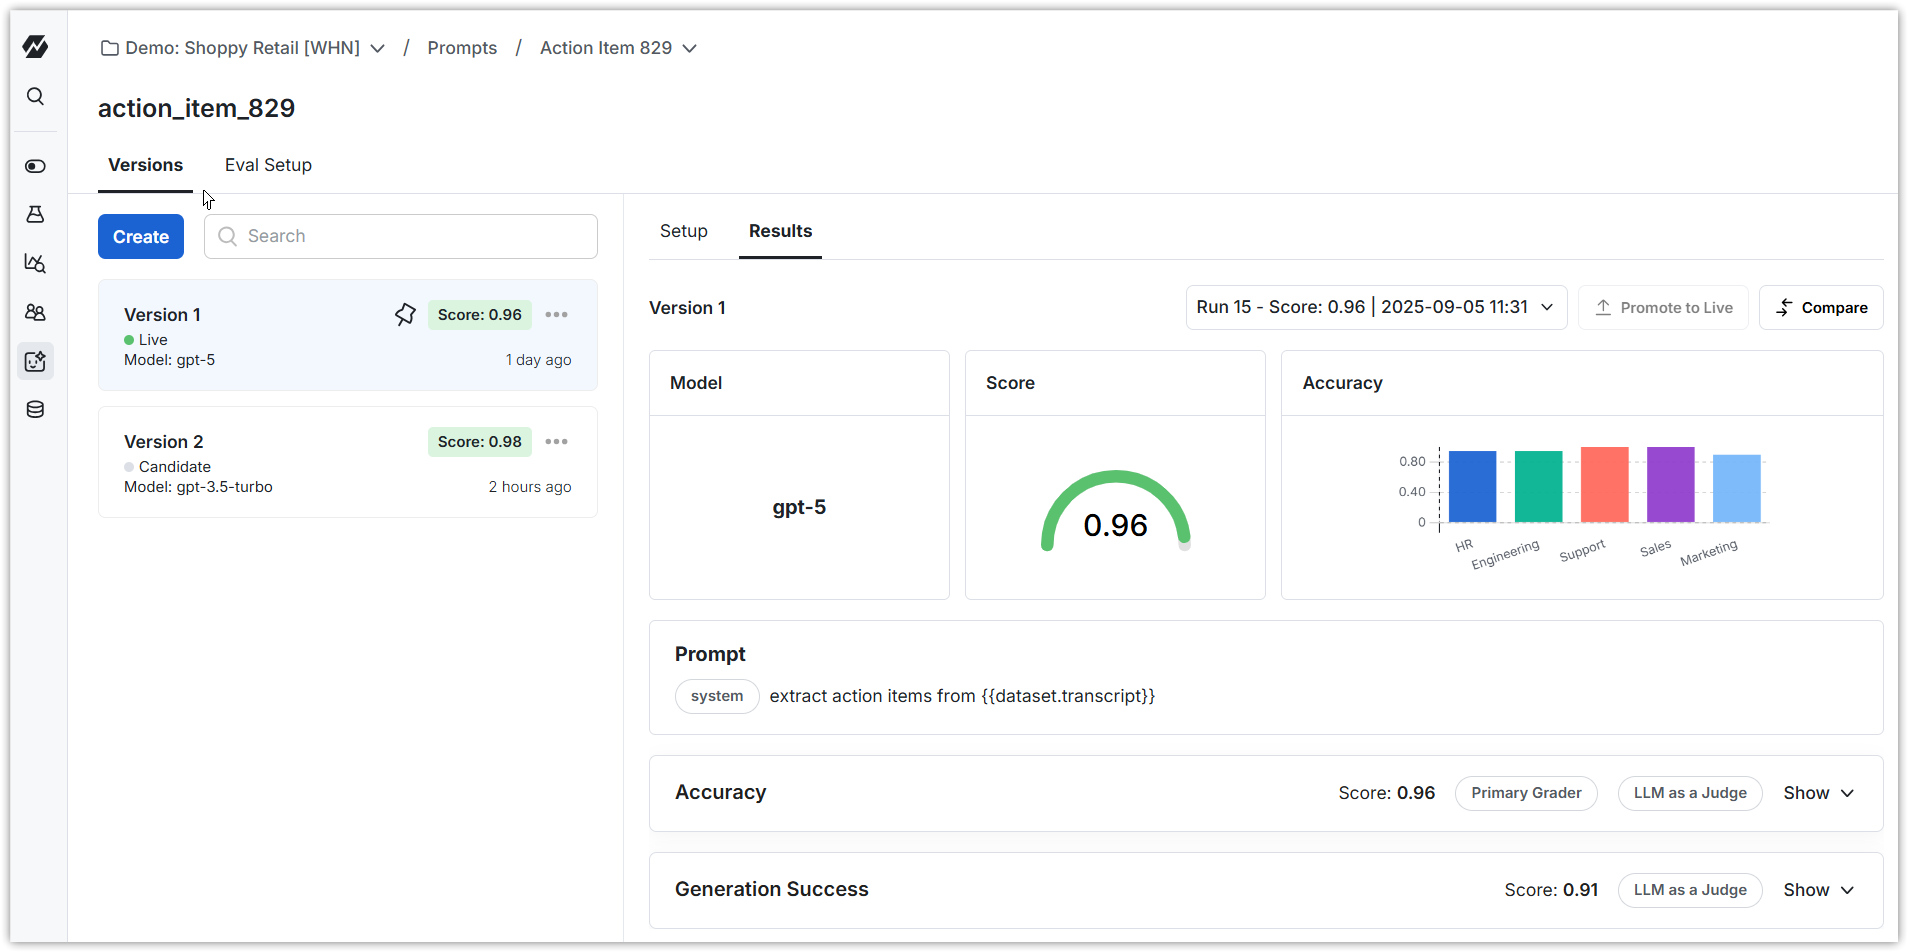
Run an evaluation on a version of the prompt. You should see results in a few minutes that look like this. You can click into any row of the dataset to understand more about the evaluation for that row.
You can categorize your dataset, and break scores out by category.
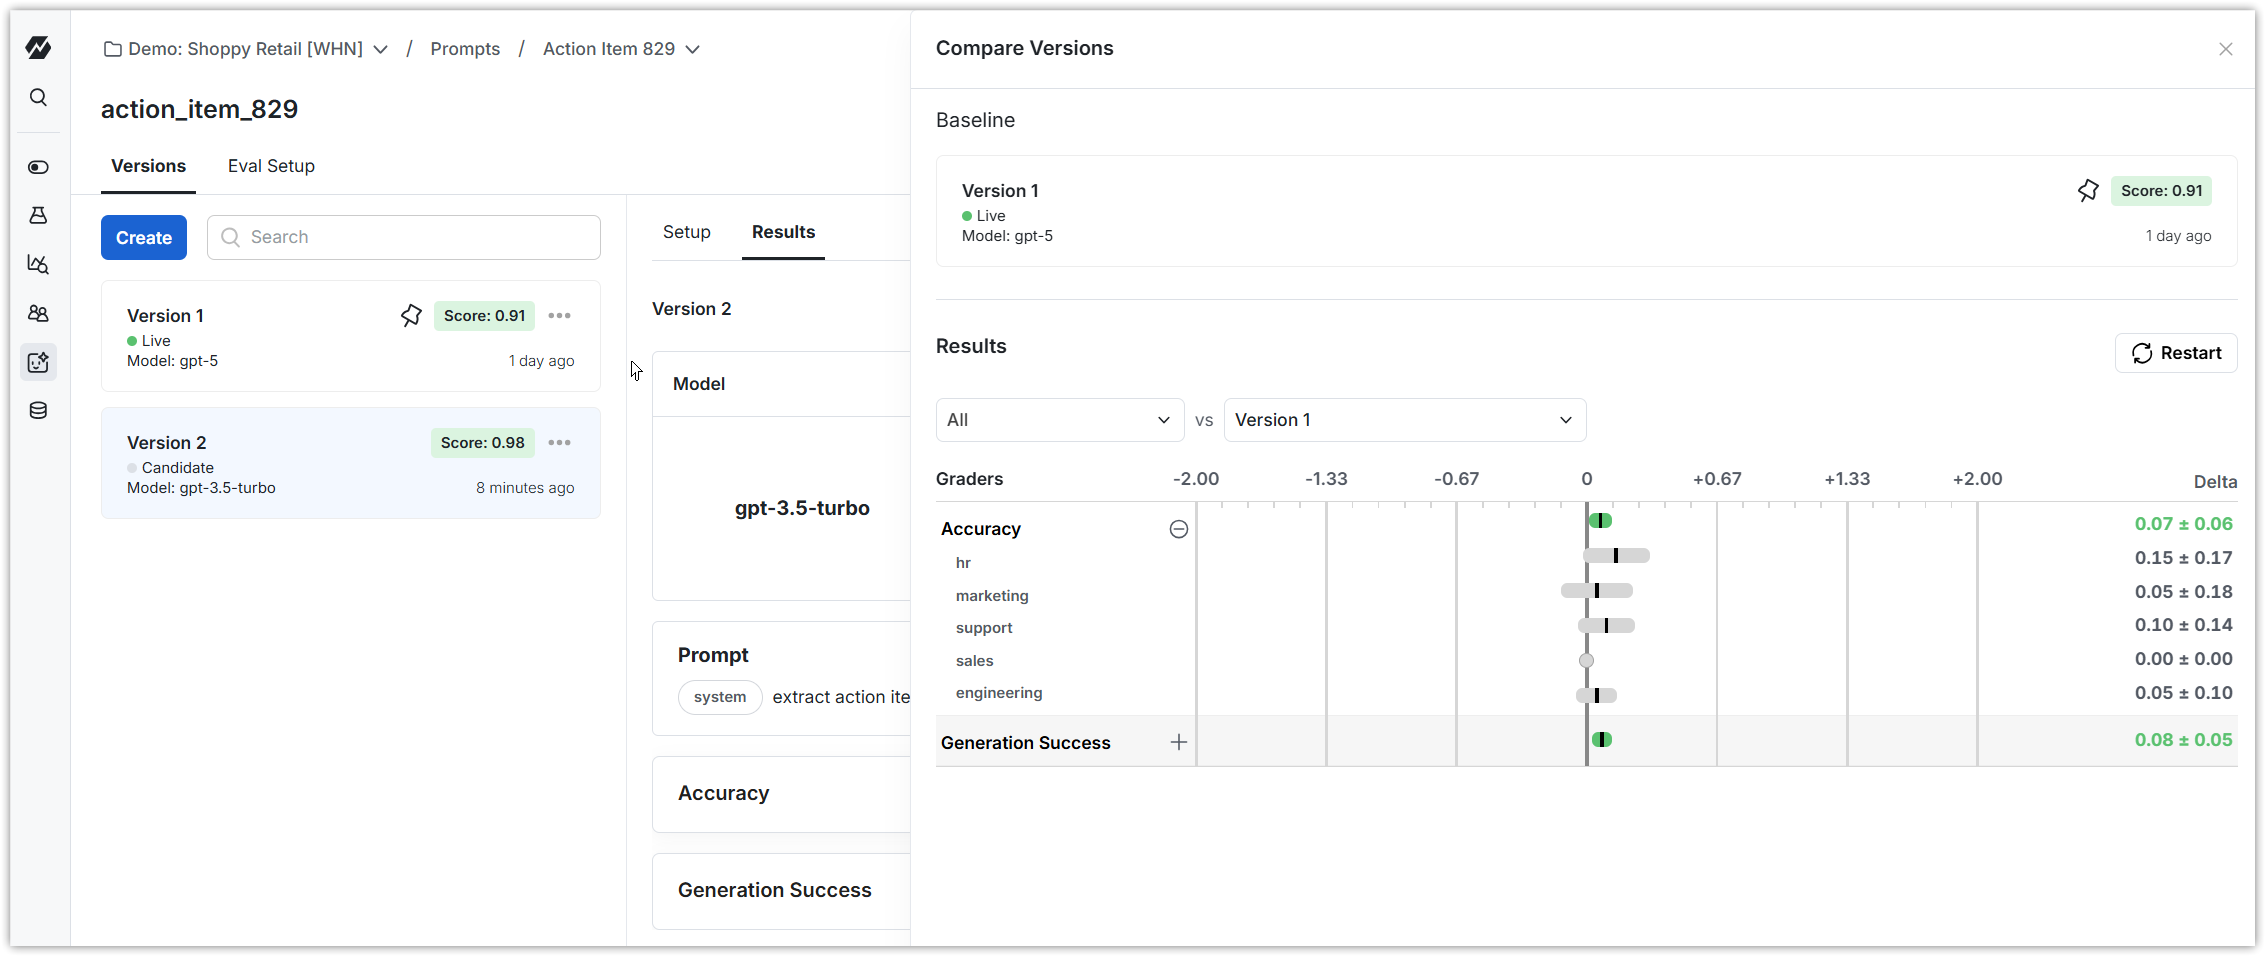
If you have scores for multiple versions, you can compare them to see what changed between versions.
Was this helpful?