Running Analysis Across Unit Types, AKA Cluster Experiments
Learn how to run analysis when the experiment assignment unit differs from the analysis unit.
There are two common scenarios where the experiment assignment unit differs from the analysis unit:
- Measuring session-level metrics for a user-level experiment. Ratio metrics commonly solve this scenario (covered on this page).
- Measuring logged-in metrics (eg. revenue) on a logged-out experiment. There are two solutions: a. Running the experiment at the device-level, with device-level metrics collected even after the user is logged-in. b. Using ID resolution.
This page explains how to set up the first scenario using Warehouse Native.
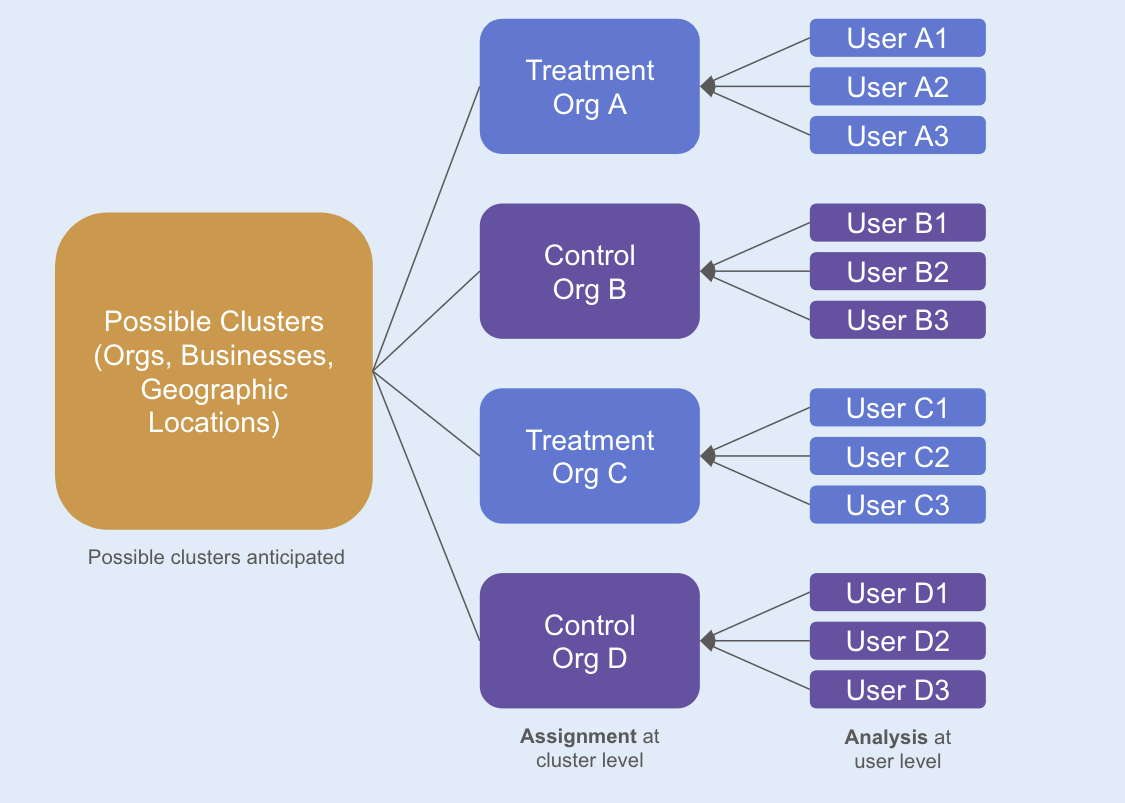
Example: Organizations and users
Scenario:
- Your metrics source has both
org_idanduser_id. - The relationship between
org_idanduser_idis 1-to-many. A singleorg_idcan map to multiple users (user_id), but auser_idmaps to only a singleorg_id. - Statsig assigns your experiment at the
org_idlevel. - You're interested in understanding the treatment effect at the
user_idlevel, such as revenue per user.
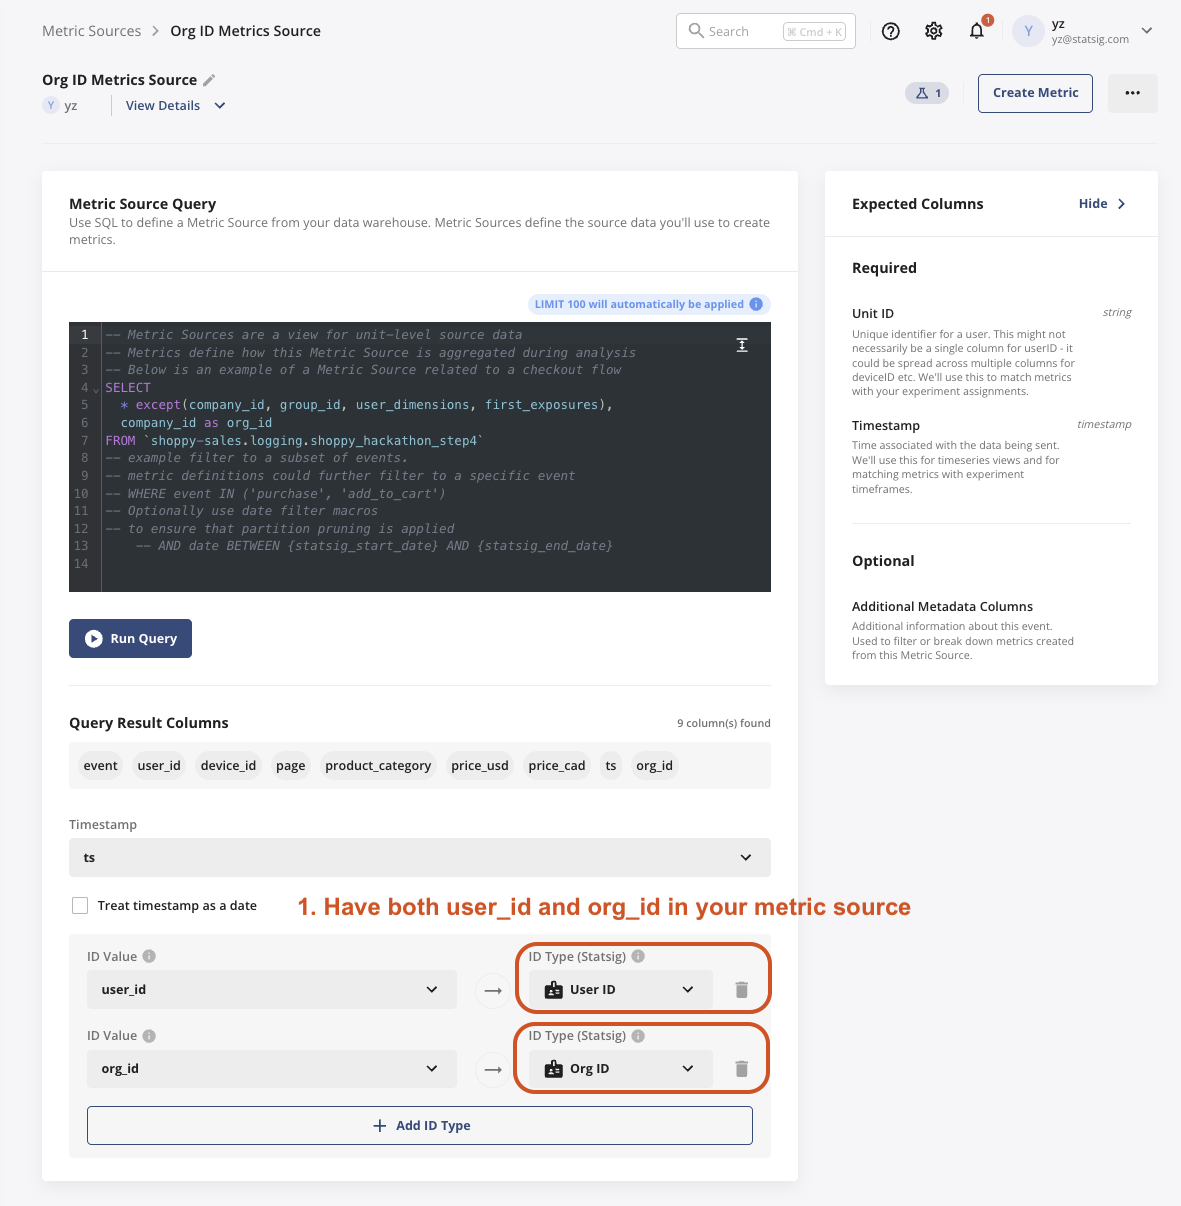
1. Set up the metric source with org_id as an ID type
- In this table, each row of data should have both
org_idanduser_id.
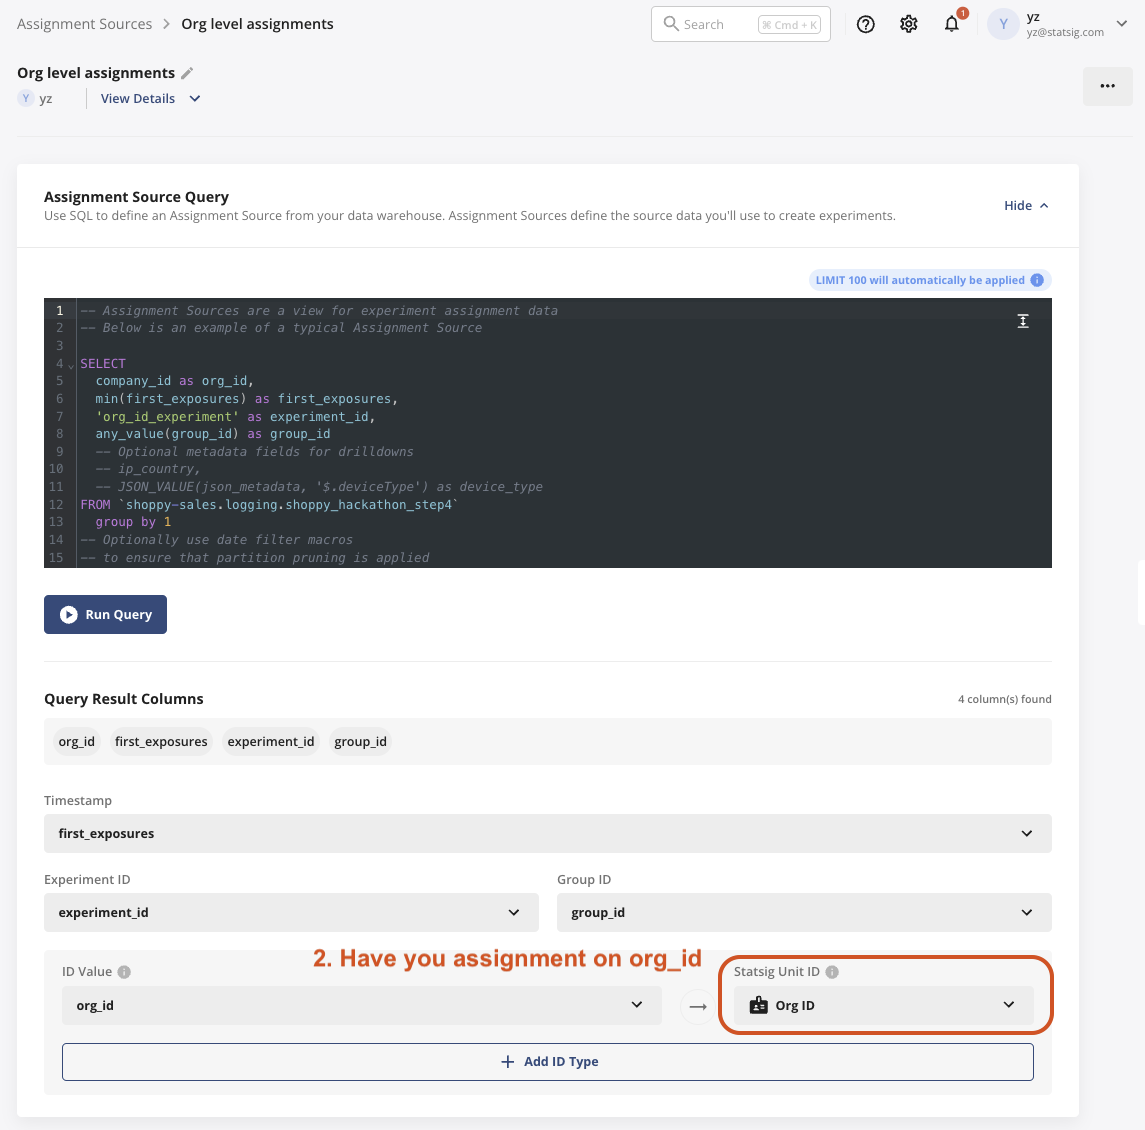
2. Choose your assignment source, where the unit of assignment is org_id
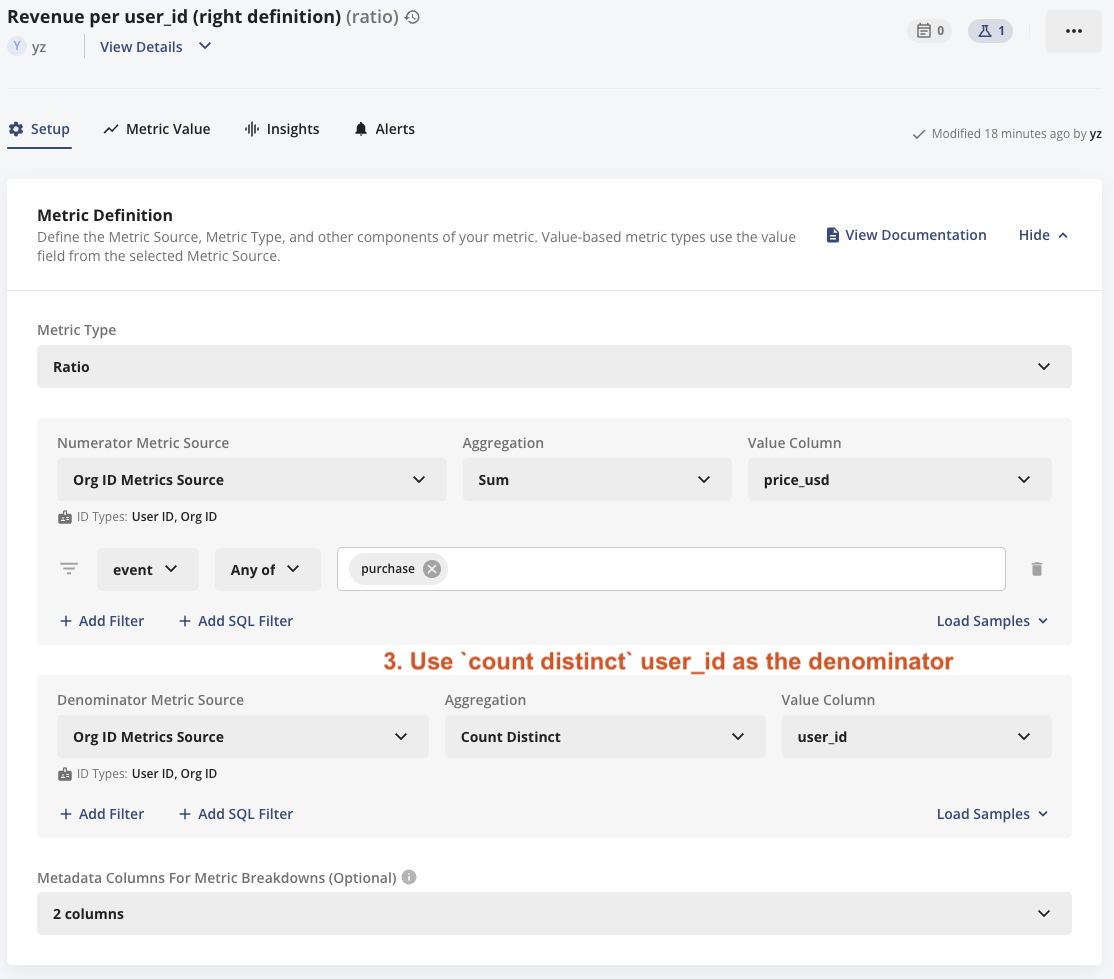
3. Define your metric of revenue per user_id
- Your denominator should be
count distinct user_idinstead ofunit count, becauseunit countis equivalent tocount distinct org_idin anorg_idlevel experiment.
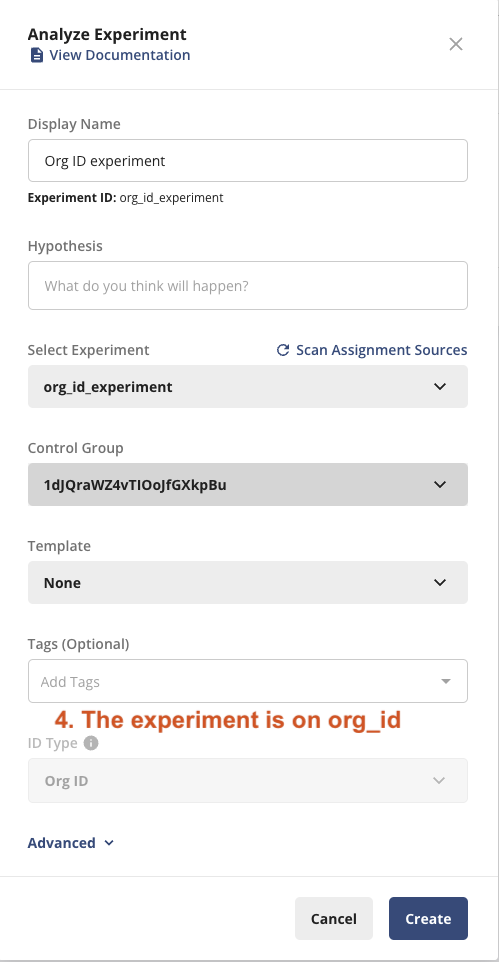
4. Set up the experiment with org_id
How the Stats Engine handles cluster experiments
The Stats Engine uses the delta method to calculate variance and confidence intervals.
- For mean metrics, the Stats Engine records the number of observations per exposed unit in the records column of the staging data. This value acts as the denominator or cluster-size value for delta calculations.
- For general ratio metrics, the Stats Engine tracks the two-component metrics (the ratio and the denominator) as independent metrics, then combines them during the pulse analysis to derive a single metric.
The delta method also applies when analyzing event-level outcomes, such as average purchase value, where randomization occurs at the user level, and each user may experience multiple session events.
Was this helpful?