Metrics User Guide
Learn about Statsig's comprehensive metrics system, from raw events to precomputed metrics and real-time analytics.
Metrics user guide
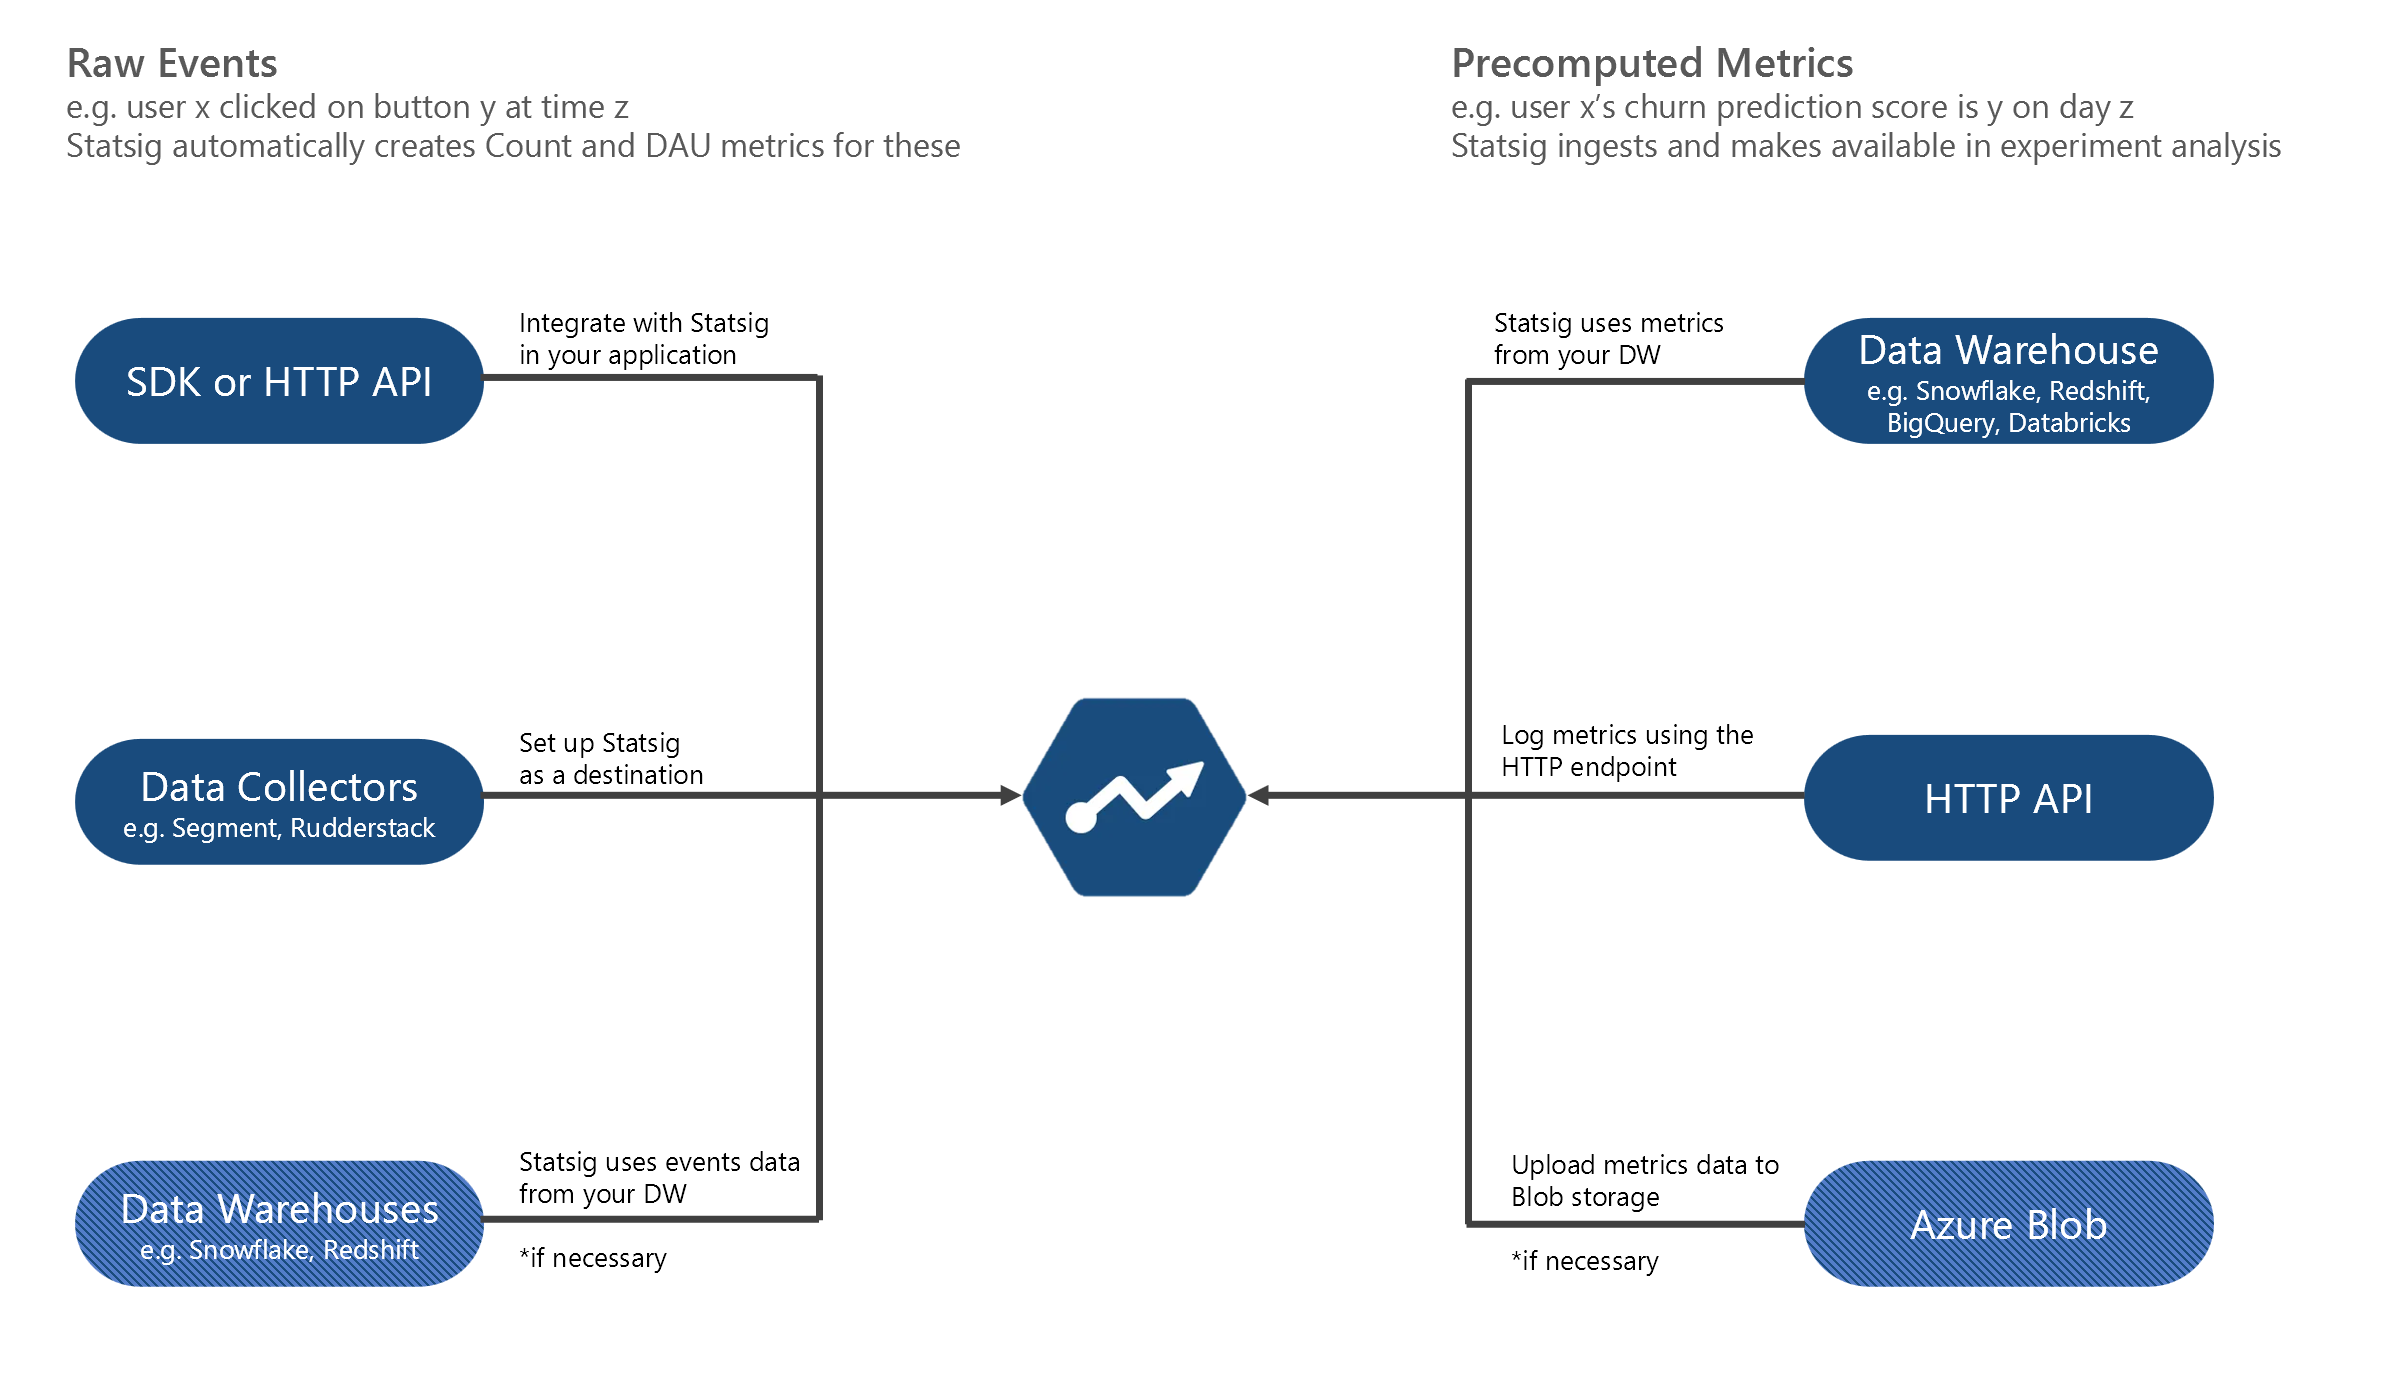
Statsig combines data from your existing data sources to give you a complete view of your product metrics and the impact new features and experiments have on those metrics.
Statsig automatically creates metrics from the raw events that you log from your application, as well as raw and transformed events you send to Statsig through a data collector.
Statsig can also reuse your existing precomputed metrics by natively integrating and pulling data from your cloud data warehouse. You can also ingest metrics into Statsig using an HTTP endpoint or Azure Blob storage.
Metrics 101 - An overview
- Introduction
- Raw Events
- Raw Event Metrics
- Custom Metrics
- Precomputed Metrics
- Pulse Metrics
- Metric Dimensions
Metrics 201 - Diving deeper
Metrics 301 - Advanced topics
Statsig combines product experimentation with real-time analytics to support product observability.
Was this helpful?