User Flows
Visualize customer journeys through your application using Statsig's User Flows feature.
Statsig's User Flows enable you to visualize customer journeys through your application.
To create a User Flow,
- Log into the Statsig console at https://console.statsig.com
- On the left-hand navigation panel, select Metrics and then click on the Charts tab
- Click on the Create button
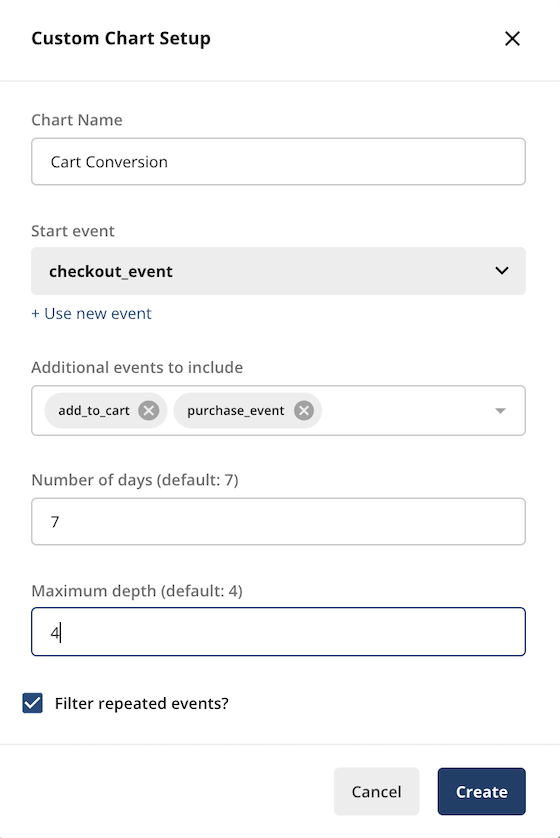
- Enter the chart name and start event of the User Flow that you want to visualize
- Select the additional events that you want to include in the User Flow (Statsig automatically determines the sequence of events)
- Enter the number of days that users typically take to complete these events
- You can also optionally enter the depth of the flow to define the scope of your analysis
- Click on Create to finish
If there is sufficient data for the User Flow, the chart appears in the console within a few minutes.
Was this helpful?