For AI agents: a documentation index is available at /llms.txt. Append .md to any page URL for markdown, or send Accept: text/markdown.
Aggregated Impact
How Statsig Warehouse Native calculates aggregated business impact across metrics for an experiment so you can see the total estimated launch effect.
Metric Insights and Aggregated Impact
Statsig's Insights page shows how experiments and feature gates affect a single metric. It answers questions such as "How much impact have I driven?" and diagnoses unexpected changes in a metric.
Insights presents a reverse perspective of the Pulse view. Pulse measures the impact of a new feature on all your metrics; Insights focuses on a single metric and identifies which tests are affecting that metric the most. This single-metric focus makes Insights useful for assessing your team's impact and setting realistic goals.
How to read Insights
- Navigate to the Insights section in the Statsig console: https://console.statsig.com/. Insights also appears in the insight tab for each metric.
- Select a metric from the drop-down at the top of the page.
- Select the ID type, time window, and other filters.
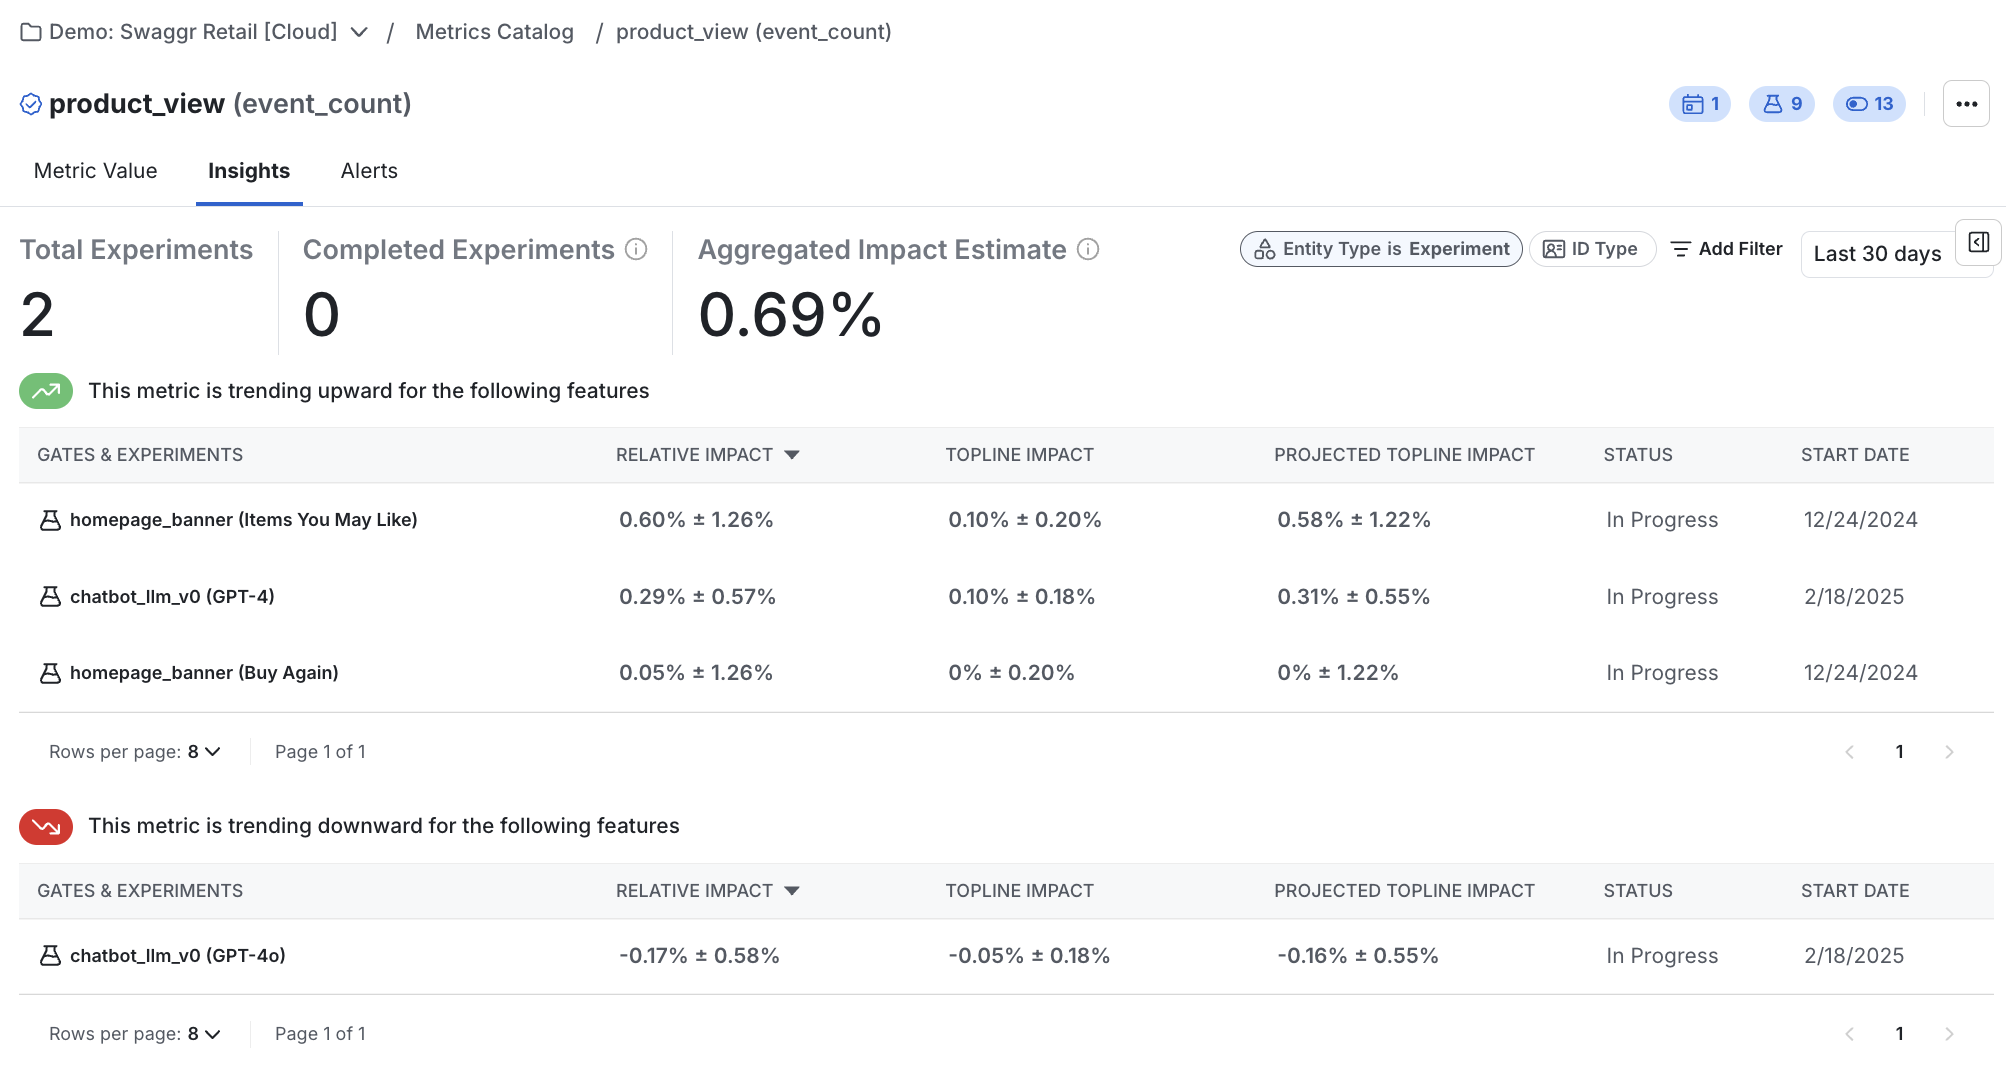
- Based on the filters you choose, you can see the relative impact, topline impact, and projected launch impact for any experiment or gate that uses this metric.
- Statsig also sums the projected launch impacts, adjusts based on false positive risk ('winner's curse'), and displays the result as the 'Aggregated Impact Estimate'.
How the math works
Refer to the topline impact documentation for details on how Statsig calculates topline and projected launch impact.
To estimate false positive risk and calculate Aggregated Impact, Statsig uses the methodology in this paper, which the industry widely adopts. Specifically:
Where the projected launch impact is an estimate of the topline impact assuming you make a decision and launch the test group to all users. Statsig calculates the false positive risk using the following formula:
In this formula, is the significance level for experiment i, is the type II error, and 1 - is the prior success rate based on historical experiment results.
Was this helpful?