Exporting Pulse Reports
Export Statsig experiment results as CSV, share via link, or pipe to a data warehouse for further analysis in BI tools and notebooks.
How to export Pulse data in Statsig Cloud
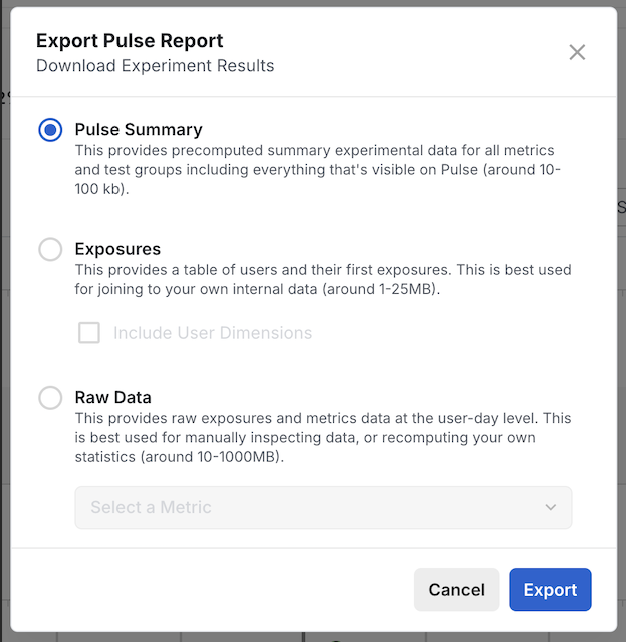
Exporting a Pulse report saves your experiment or Feature Gate results as a CSV so you can analyze them outside Statsig. You start the export from the Pulse Results page, and Statsig delivers a downloadable link you can share or pipe into BI tools, notebooks, or a data warehouse.
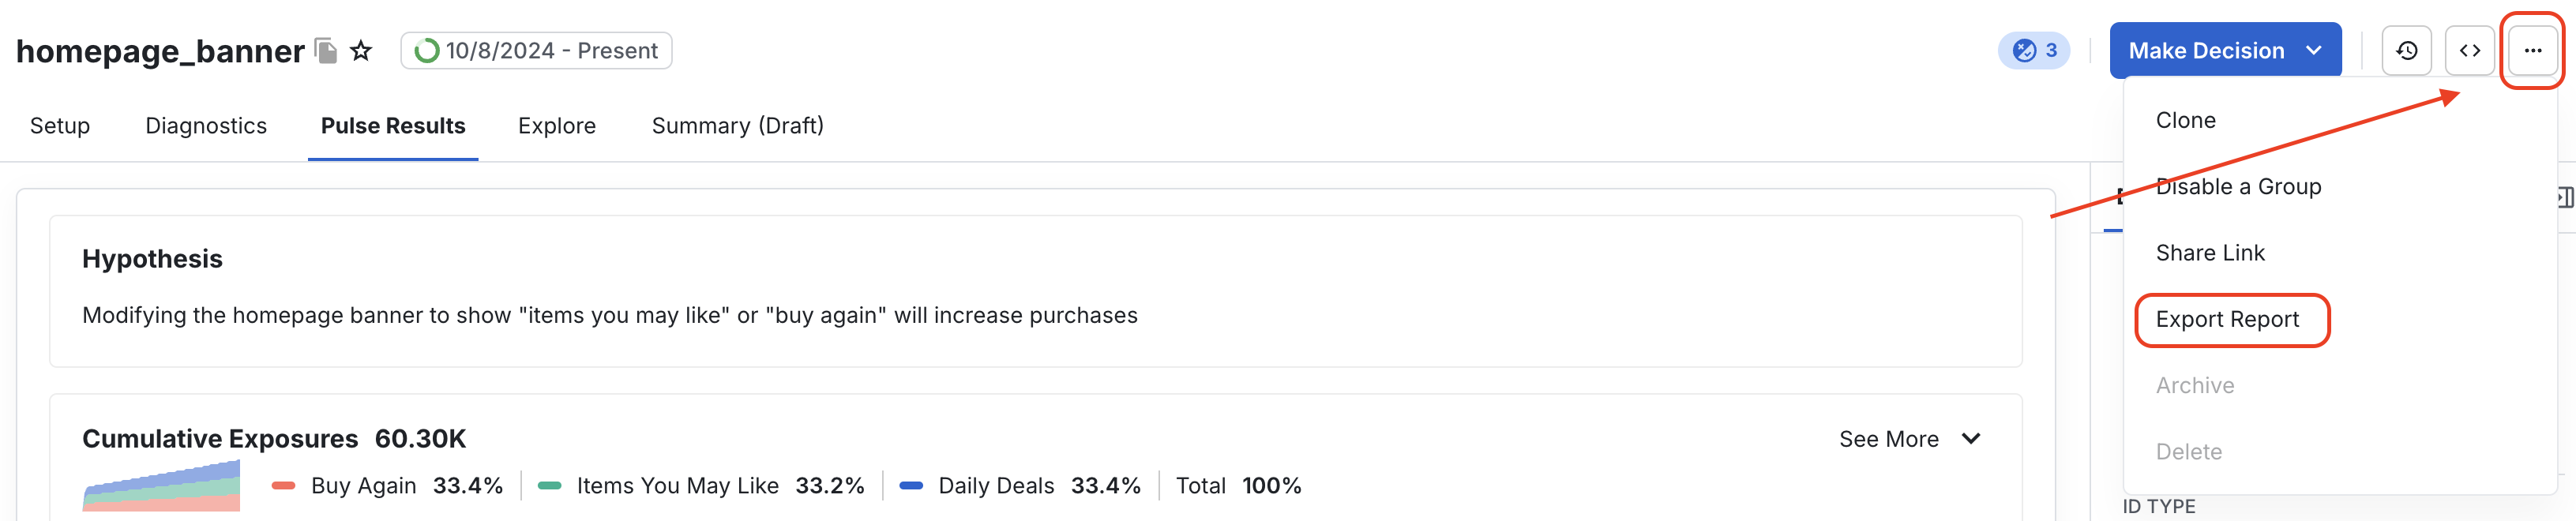
To export Pulse Results for Feature Gates and Experiments, go to the relevant "Pulse Results" page and click Export Report. Exporting results can take up to 10 minutes. Statsig sends you a notification and an email when the report is ready, and a link appears under Project Settings > Reports. You can export results only if your Pulse screen has results.
Was this helpful?