For AI agents: a documentation index is available at /llms.txt. Append .md to any page URL for markdown, or send Accept: text/markdown.
Export Pulse Results to Your Warehouse in Warehouse Native
Access and interpret Statsig Warehouse Native experiment results in the console, including Pulse, scorecard, drill-down, and exported analysis views.
In Warehouse Native, Statsig writes two datasets to your warehouse: an exposures table with each unit's first exposure per experiment, and a statsig_daily_results SQL View with every Scorecard metric lift and its metadata. Statsig writes exposures to the forwarding table you configure in your project, and writes a new copy of the Scorecard results to the SQL View each time you load an experiment. Use the SQL View to query results across experiments in your warehouse. Use the console's Export Report only when you need a one-time Pulse Summary CSV file, as described in Report types.
Export Pulse results to your warehouse
Exposures
Statsig writes exposures to the table configured in your project setup. To find the table's location, go to Settings > Data Connection. The table is at {Database Name}.{Schema Name}.{Exposures Forwarding Table Name}, for example experimentation.statsig.exposures.
Results
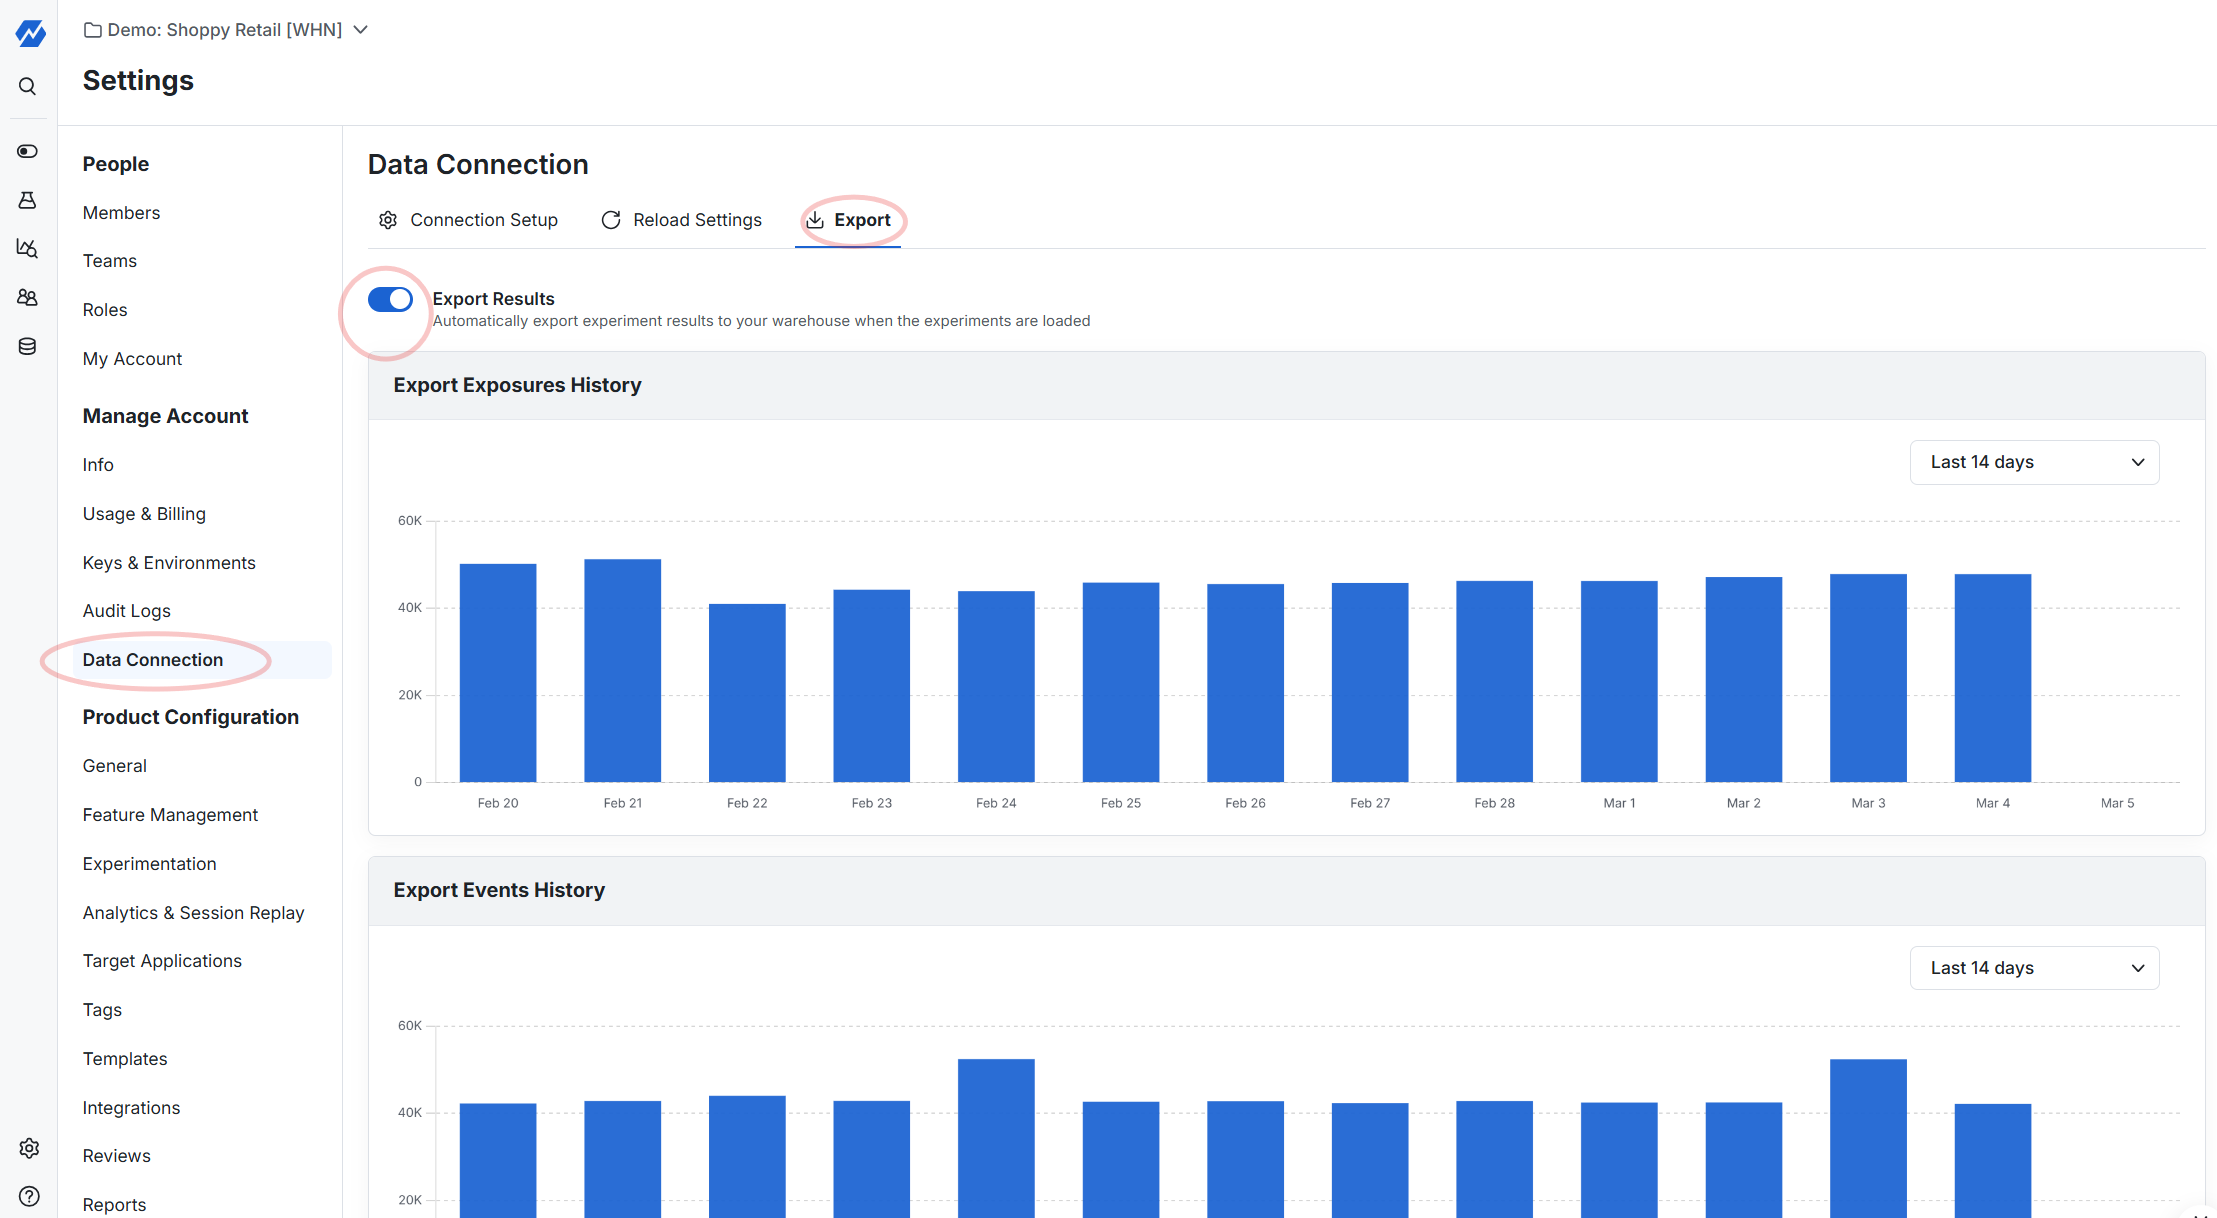
The results SQL View contains the same results you can view in the console: experiment metadata (such as team, tags, target duration, and settings like CUPED and sequential testing), each metric's metadata (such as metric tags), and all metric lifts. To enable it, go to Project Settings > Data Connection > Export. Statsig then creates the SQL View in your warehouse and a matching metric source in your Statsig project.
Each time you load an experiment, Statsig exports a new copy of the Scorecard metric results. To tell result versions apart, use the ds column, which contains the timestamp when Statsig wrote the data.
Schema of the results export table
The default view name is statsig_daily_results. The metric source that Statsig creates in your project has the same name.
| Column | Type | Description |
|---|---|---|
ds | timestamp | The time when Statsig wrote the data |
experimentName | string | Name of the experiment |
experimentCreator | string | Creator of the experiment |
experimentTeam | string | Team conducting the experiment |
experimentTags | array of strings | Tags associated with the experiment |
experimentStartTs | number | Start timestamp of the experiment, in milliseconds |
experimentEndTs | number | End timestamp of the experiment, in milliseconds |
targetExposures | number | The target number of exposures for the experiment |
targetDuration | number | The target duration of the experiment |
actualDuration | number | The actual duration the experiment ran, from start date to decision date. For analyze-only experiments, the number of days from the configured start date to today |
controlGroupName | string | Name of the control group in the experiment |
testGroupName | string | Name of the test group in the experiment |
useCUPED | boolean | Whether the experiment applied CUPED |
useSequential | boolean | Whether the experiment applied sequential testing |
metricName | string | Name of the metric the experiment measures |
metricType | string | Type of metric |
metricTags | array of strings | Tags associated with the metric |
higherIsBetter | boolean | Whether a higher value of the metric is better |
isVerifiedMetric | boolean | Whether the metric is verified |
metricTeam | string | Team responsible for the metric |
absoluteDelta | number | The absolute change in the metric value between control and test groups |
absoluteDeltaCI | number | Confidence interval for the absolute delta |
relativeDelta | number | The relative change in the metric value between control and test groups |
relativeDeltaCI | number | Confidence interval for the relative delta |
absoluteDeltaPValue | number | P-value associated with the absolute delta metric result |
toplineAbs | number | The absolute topline metric value for the experiment |
toplineAbsCI | number | Confidence interval for the absolute topline metric |
toplineRel | number | The relative topline metric value for the experiment |
toplineRelCI | number | Confidence interval for the relative topline metric |
projectedTopline | number | Projected topline metric value based on current data |
projectedToplineCI | number | Confidence interval for the projected topline metric |
projectedToplineRel | number | Projected relative topline metric value based on current data |
projectedToplineRelCI | number | Confidence interval for the projected relative topline metric |
controlUnits | number | The number of control group units |
testUnits | number | The number of test group units |
controlTotal | number | Total value for the control group metric |
testTotal | number | Total value for the test group metric |
controlMean | number | The mean value for the control group |
testMean | number | The mean value for the test group |
sequentialTestingAbsoluteDeltaCI | number (optional) | Confidence interval for the absolute delta with sequential testing enabled |
sequentialTestingRelativeDeltaCI | number (optional) | Confidence interval for the relative delta with sequential testing enabled |
sequentialTestingAbsoluteDeltaPValue | number (optional) | P-value for the absolute delta with sequential testing enabled |
Report types
The report types in this section are the outputs of the console's Export Report action, described in Exporting Pulse reports. There are three types:
| Report | Contents | Files | Approximate size |
|---|---|---|---|
| Exposures | All exposed users and their first exposures. Use it to join on your own internal data, run custom queries in your own warehouse, or verify who was in the experiment, which group Statsig assigned them to, and when Statsig first exposed them. | <experiment>_first_exposures.csv | 1-25 MB |
| Pulse Summary | Precomputed summary experimental data for all metrics and test groups, including everything visible on Pulse. | <experiment>_pulse_summary.csv | 10-100 KB |
| Raw Data | Raw exposures and metrics data at the user-day level, for inspecting data manually or recomputing your own statistics. | <experiment>_first_exposures.csv (the same file as the Exposures report) and <experiment>_user_metrics.csv (each user's calculated metrics for each day of their enrollment) | 10 MB-1 GB |
In Warehouse Native, you can export only the Pulse Summary, because Statsig stores the other two types of data only in your warehouse. Retention limits export availability: Statsig holds exposures data for up to 90 days after you conclude an experiment, and holds raw user-level metrics data for 90 days.
Pulse Summary file description for feature gates
| Column name | Description |
|---|---|
name | Name of the experiment or feature gate |
rule | Name of the feature gate rule |
metric_type | Category of the metric. Statsig computes different metric types differently, including how it computes them in Pulse |
metric_name | The name of the metric. For event metrics, this is the name of the event |
metric_dimension | The subcategory of the metric. For example, if you log value in LogEvent, then value shows up as a subdimension. dimension = !statsig_topline indicates that this row reflects an aggregate across all dimensions |
start_date | The start date for this measurement |
end_date | The end date for this measurement |
test_units | The number of users in the test group |
test_mean | The average value of this metric across test users (or participating units when applicable) |
test_stderr | The standard error for the estimate of the mean for test users. Use this to compute confidence intervals |
ctrl_units | The number of users in the control group |
ctrl_mean | The average value of this metric across control users (or participating units when applicable) |
ctrl_stderr | The standard error for the estimate of the mean for control users. Use this to compute confidence intervals |
abs_delta | The absolute difference between the test and control mean (test_mean - ctrl_mean) |
abs_stderr | The estimated standard error of abs_delta |
rel_delta | The relative difference between test and control mean, sometimes called lift ((test_mean - ctrl_mean)/ctrl_mean) |
rel_stderr | The estimated standard error of rel_delta (abs_delta/ctrl_mean) |
z_score | The calculated Z-score |
Pulse Summary file description for experiments
| Column name | Description |
|---|---|
name | Name of the experiment or feature gate |
rule | Name of the feature gate rule |
experiment_group | The group of users for which Statsig computed this metric. For a feature gate, this is pass or fail. For an experiment, this is the variant name |
metric_type | Category of the metric. Statsig computes different metric types differently, including how it computes them in Pulse |
metric_name | The name of the metric. For event metrics, this is the name of the event |
metric_dimension | The subcategory of the metric. For example, if you log value in LogEvent, then value shows up as a subdimension. dimension = !statsig_topline indicates that this row reflects an aggregate across all dimensions |
start_date | The start date for this measurement |
end_date | The end date for this measurement |
units | The number of users included in this metric estimate |
mean | The average value of this metric across units (or participating units when applicable) |
stderr | The standard error for the estimate of the mean. Use this to compute confidence intervals |
First exposures file description
| Column name | Description |
|---|---|
unit_id | The unit identifier used in the experiment (for example, user_id, stable_id, or org_id) |
name | The name of the gate or experiment |
rule | For gates, the rule name |
experiment_group | The group Statsig assigned the user to |
first_exposure_utc | The UTC timestamp when Statsig first assigned the user to the experiment |
first_exposure_pst_date | The date in PST when Statsig first assigned the user to the experiment |
as_of_pst_date | The date Statsig generated this data |
user_dimensions | JSON-formatted key-value pairs describing the user's attributes at the time of first exposure |
Unit metrics file description
| Column name | Description |
|---|---|
pst_ds | The 24-hour window the data refers to. Statsig anchors all dates from 12:00 AM to 11:59 PM PST |
unit_id | The unit identifier used in the experiment (for example, user_id, stable_id, or org_id) |
metric_type | The category of the metric |
metric_name | The name of the metric |
metric_dimension | The name of the metric dimension. !statsig_topline is the overall metric with no slicing |
metric_value | The numeric value of the metric |
numerator | For some metrics, Statsig tracks the numerator |
denominator | For some metrics, Statsig tracks the denominator |
Was this helpful?