Auto-generated Metrics
Learn how Statsig automatically generates event_count metrics from your custom events for monitoring and experimentation.
Metrics are critical for monitoring the health and usage of your product and the impact of new features and experiments.
Statsig automatically generates an "event_count" metric for each uniquely named custom event that you log. Statsig creates auto-generated metrics from production environment events, and creates an event_count metric for any newly logged custom event within 24 hours of the first logged events.
When testing experiments in lower environments (such as development or staging) with Enable for Environments, you can track cumulative exposures and metric results collected from those environments. This allows you to validate your experiment setup before launching to production. Statsig prioritizes production data for final Pulse result analyses.
This auto-generated metric consists of three elements:
- Roll-up Window - Statsig computes metrics from custom events aggregated over a 24-hour day, with the hours depending on your company's setting. These hours don't change with daylight saving time. This prevents some days from having 23 and 25 hours which can cause a +/-4% change to some metrics on a biannual basis.
- Unit Identifier - While you can record custom events with and without a unique user identifier, Statsig requires a unit identifier (usually a user_id) to track a user across multiple events and sessions to support Experiments, Pulse (experiment results), and Autotune. If you don't have access to a user_id when logging a custom event, create a temporary identifier to track users at a session or device-level.
- Metric Value - Statsig automatically computes values for event_count, which measures the number of times an event is triggered.
| Metric | Automatic | Dimensions | Possible Values | Description | Example |
|---|---|---|---|---|---|
| event_count | Yes | Yes | 0, 1, 2,... | Counts the number of events triggered on a given day | Number of page views |
| event_dau (Legacy support as of October 16, 2024) | Yes | Yes | 0, 1 | Marks each user as 1 or 0 based on whether they triggered the event or not | Unique users who viewed a page |
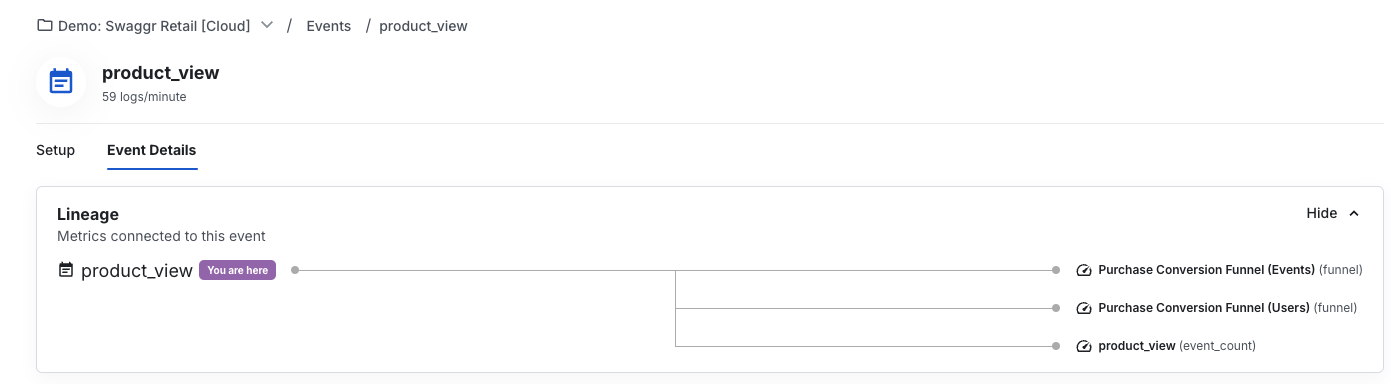
When you select an event type in the Events tab, a detailed view of the event appears, including any metrics linked to that event. Select a metric to go to its detail page.
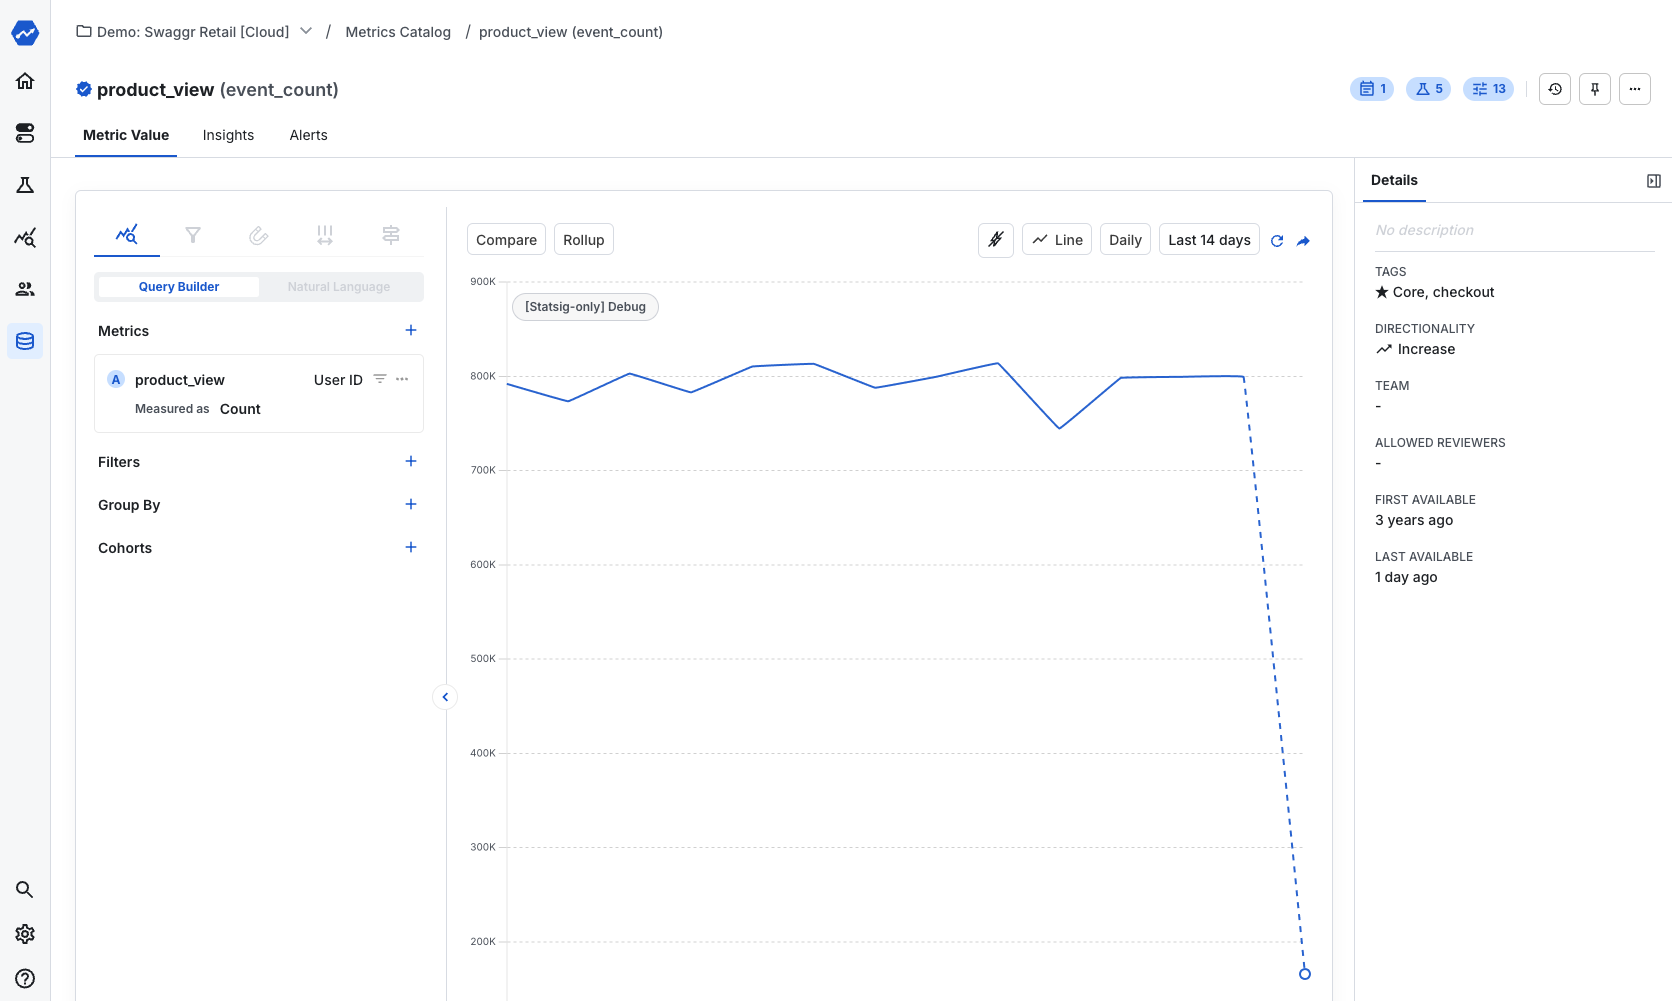
Event count metric
Event count is the simplest metric in your Statsig project. For every event recorded, Statsig automatically creates an event_count metric based on the number of times Statsig receives that event each day. In experiments, Statsig calculates this value for each user. Each user can have values of 0, 1, 2, and so on.
You can find an event_count metric for each event type that you record in the Statsig console. The metric name matches the name of the raw event, and the metric type is marked as event_count.
User accounting metrics
Statsig automatically derives User Accounting metrics based on any exposure or custom event triggered by a user on a given day.
User Accounting metrics start with a definition of a daily active user (DAU). By default, Statsig considers a user a DAU if they trigger any event, gate check, or experiment check on a given day. A DAU is a binary designation assigned to every user: a user is either a DAU for a given day or not (inactive). You can customize this DAU definition to exclude or include specific exposure and custom events from your application.
| Metric | Automatic | Dimensions | Possible Values | Description | Example |
|---|---|---|---|---|---|
| user | Yes | No | Depends on specific metric | Counts users that trigger any exposure or custom event on a given day | Daily Active Users |
Like the event_dau metric (deprecated as of October 16, 2024), Statsig computes User Accounting Metrics for each unit ID you define in your Statsig project. For example, given User IDs, DAU counts the number of distinct users that triggered the event. Given Stable IDs, DAU counts the number of distinct devices running your application.
Go to User Accounting Metrics for the full list of user accounting metrics and information about customizing the DAU definition.Statsig's default day starts at GMT-8 (Pacific Standard Time), and doesn't follow daylight savings time.
Auto-generated
User Accounting Metrics
aren't supported today for data warehouse ingestions.
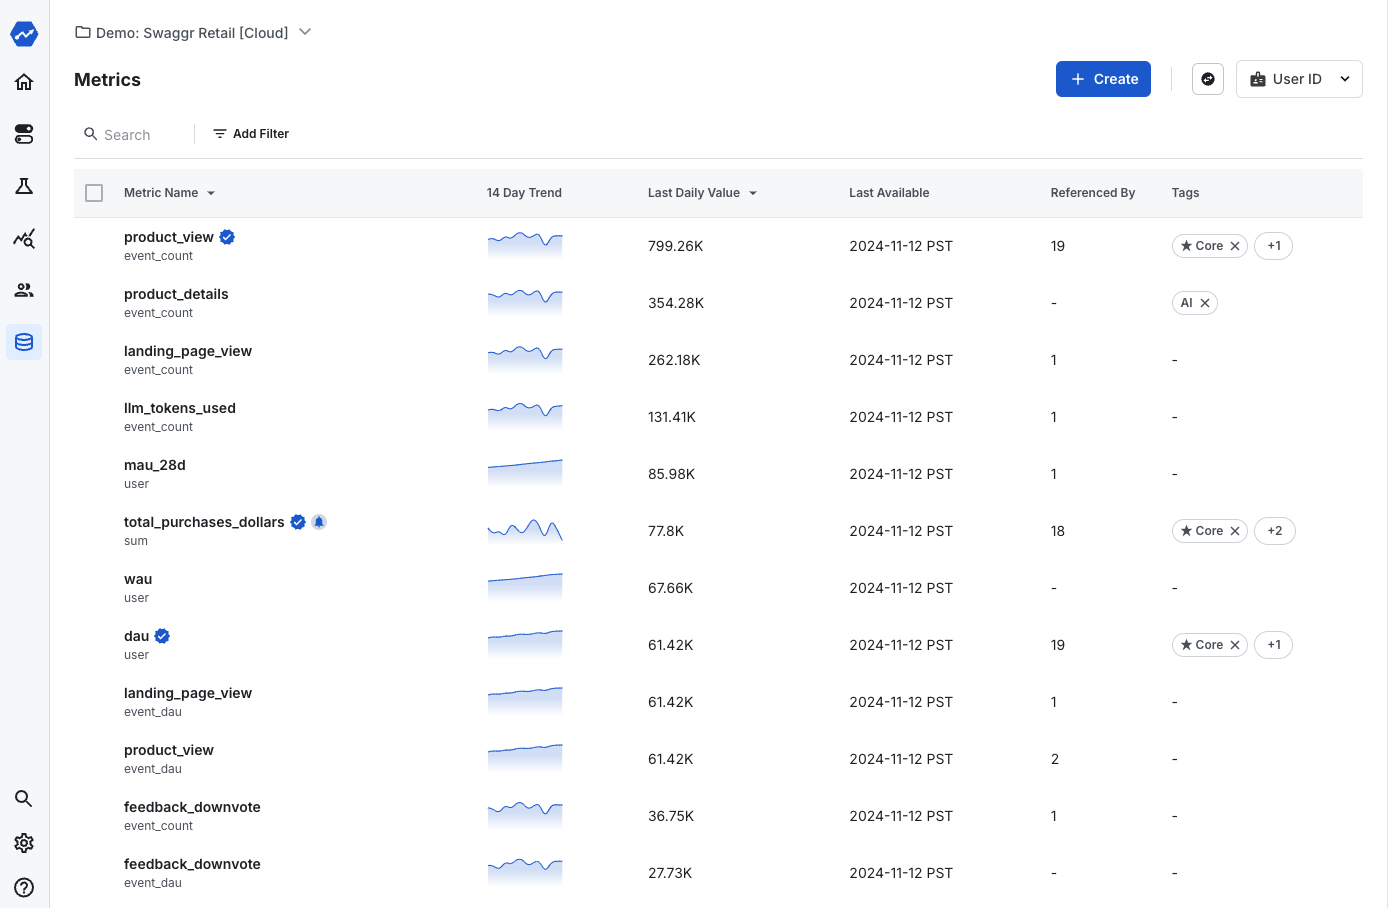
Metrics catalog
The Metrics Catalog tab allows you to search and tag your metrics. Tags organize metrics into collections. For example, you can tag metrics focused on a product area, business function, or business objective. You can also create a guardrail metrics collection that teams add to every experiment to confirm there are no unexpected effects in other parts of the business. After you create a tagged collection, you can filter to that set when viewing experiment results.
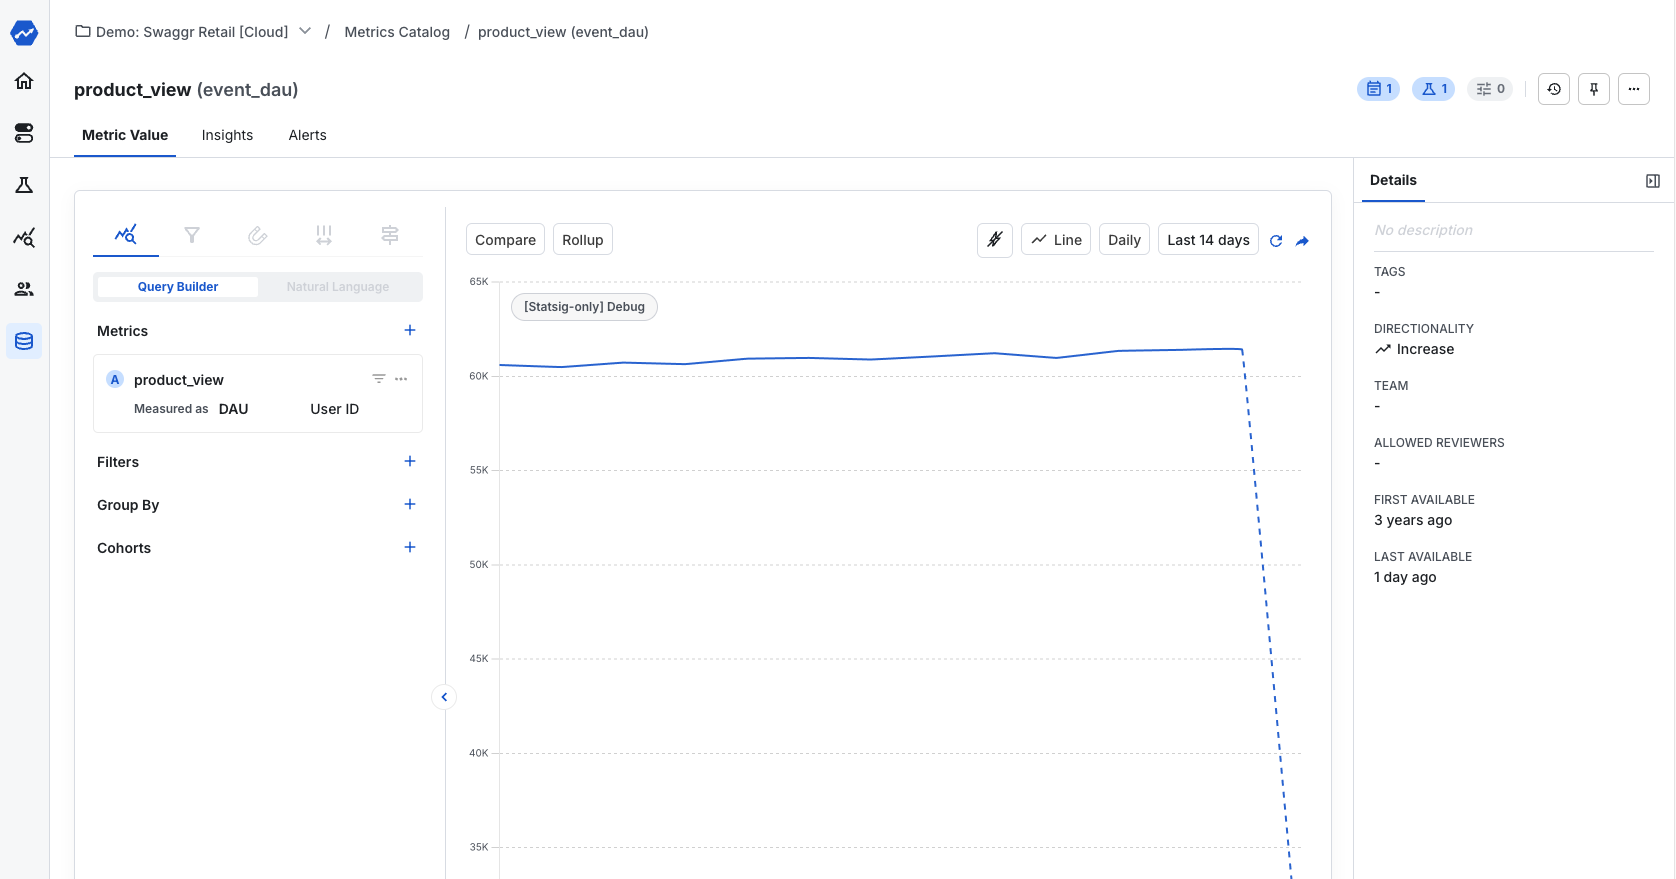
Event DAU metric (legacy support only)
Refer to the deprecation notice above.
Like event_count, Statsig formerly created an event_dau metric that measures the number of unique users who trigger a specific event on a given day. Each user receives a value of 1 (active) or 0 (inactive) based on whether they triggered an event on that day.
An event_dau metric produces a single value per user per day. When aggregated across users for the duration of an experiment, the result is known as the "Event Participation Rate," which represents the probability that a unit is DAU for that event. event_dau metrics are always between 0 and 1 for a user, because they are computed as "# Days with the Event" / "# Days Being Considered".
Tip
: Sometimes you might want a metric similar to
event_dau
but not normalized by a number of days. If you're looking for a metric that measures if the user has an event over the entire duration of the experiment, try a custom metric set to metric type "Unit Count" with "One-Time Event" rollup mode.
This metric works well in experimentation as it minimizes outliers, has tighter confidence intervals, and enables a simple measure to describe a user's breadth of activity across different events.
Statsig computes the event_dau for each unit ID you define in your Statsig project. For example, given User IDs, event_dau counts the number of distinct users that triggered the event. Given Stable IDs, event_dau counts the number of distinct devices using your application.
You can find an event_dau metric for each event type that you record with Statsig. The metric name matches the name of the raw event, and the metric type is marked as event_dau.
Was this helpful?