Ingesting Metrics
Import precomputed metrics from your data warehouse using Statsig's connector integrations.
Statsig doesn't automatically process these metrics until you mark them as ready, because you might load data out of order. After you finish loading data for a period, mark the data as ready by calling the mark_data_ready API.
curl --location --request POST ‘https://api.statsig.com/v1/mark_data_ready’ \
--header ‘statsig-api-key: {your statsig server secret}’ \
--header ‘Content-Type: application/json’ \
--data-raw ‘{
    “timestamp”: 1647975283,
    “type”: “metrics”
}
The timestamp provided should be:
- A unix timestamp
- The latest point in time for which all metrics have been uploaded
- Any future calls to this API with an earlier timestamp are invalid
- Statsig doesn't guarantee correct behavior if you provide metrics with an earlier timestamp after calling this API
Statsig processes metrics as a full day in the PST timezone, and waits until a full day is marked as ready before processing that day.
Debugging precomputed metrics
All precomputed metrics generate Metric Detail View pages. These Detail View pages take a few hours to generate after ingestion. The fastest way to start viewing and debugging your precomputed metrics is through the Metrics Logstream on the Metrics Catalog tab within Metrics.
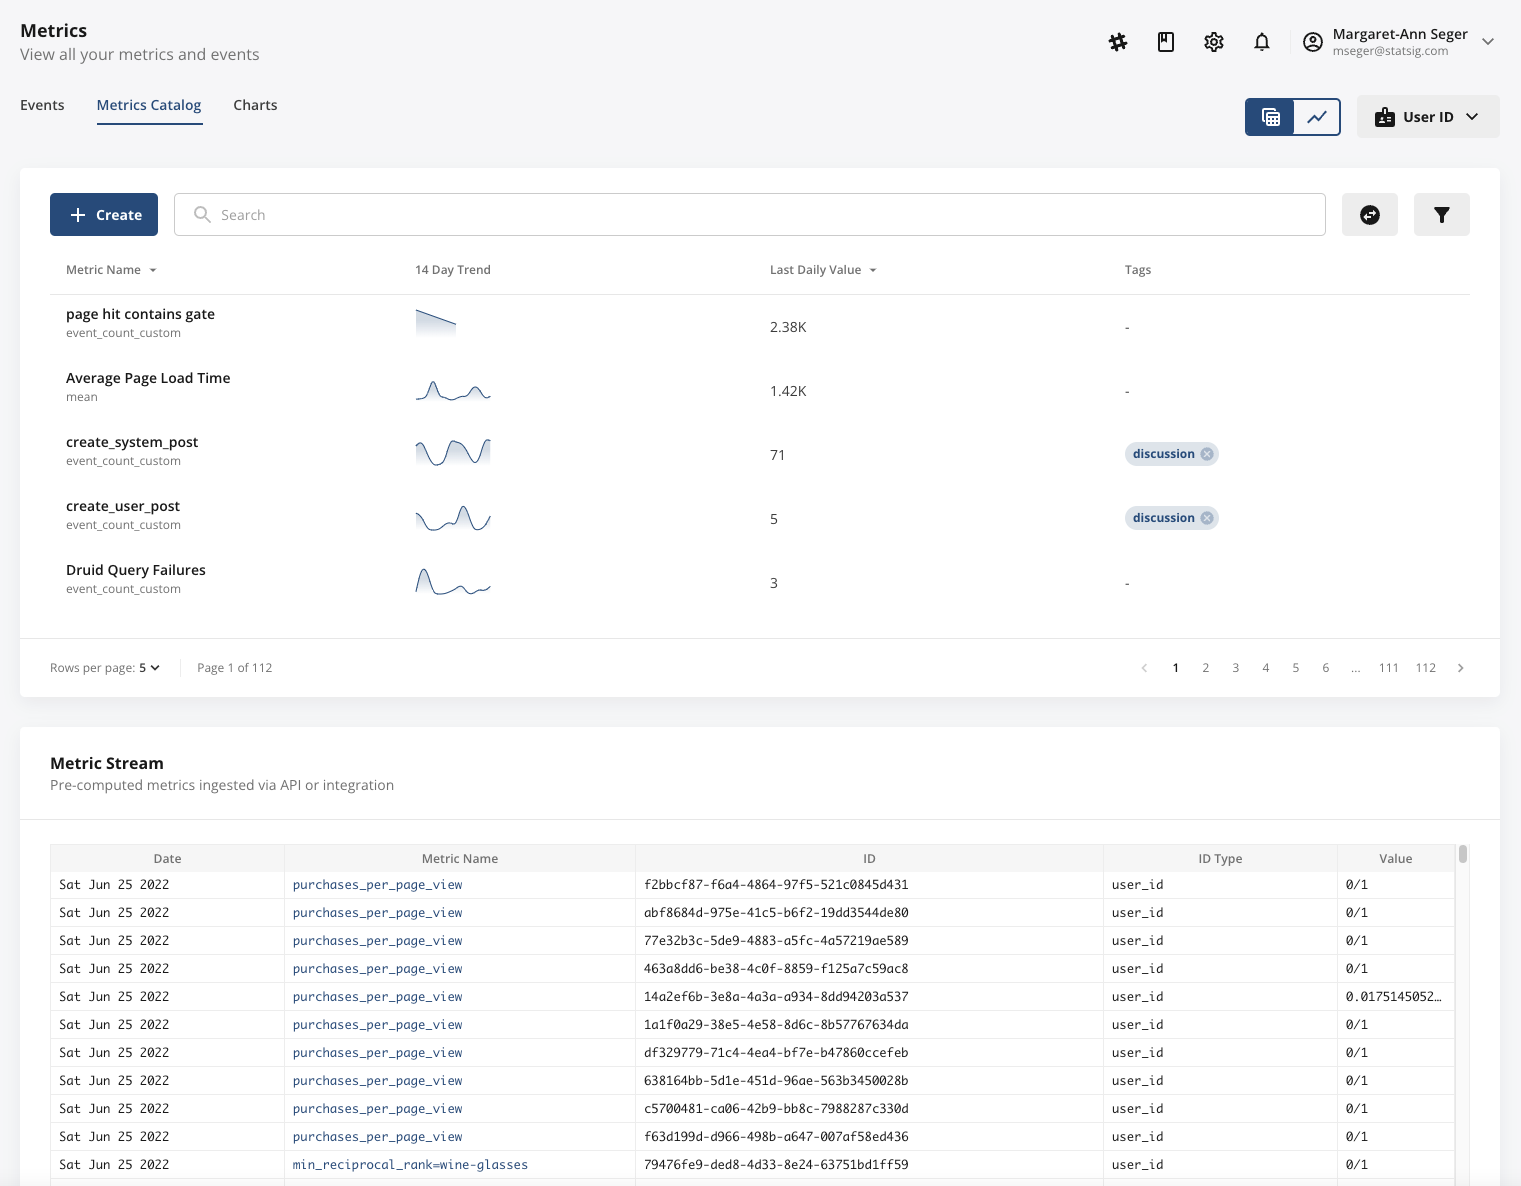
The Metrics Logstream surfaces all ingested, precomputed metrics in real time, enabling you to check metric name, value, ID, ID type, and ingestion date. A common issue is ensuring precomputed metrics have the correct ID type, so pay extra attention to this column.
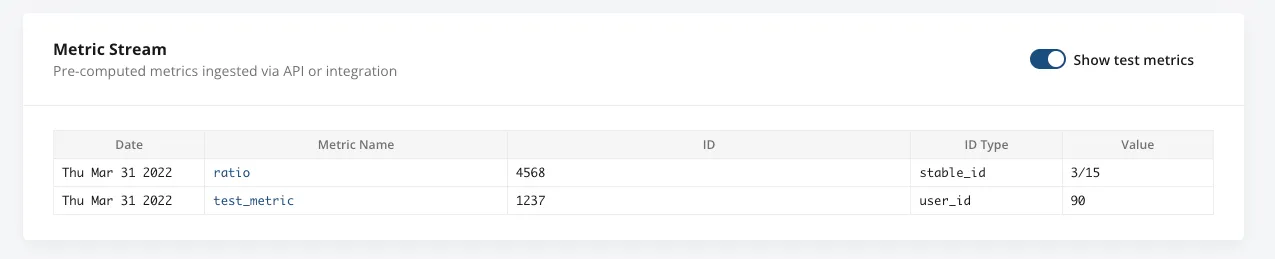
You can also include test metrics tagged with isTest, which you can toggle on or off for debugging in the Metrics Logstream. The isTest flag is only available for precomputed metrics ingested through Statsig's APIs. Support for this flag through integrations with Snowflake, BigQuery, and Redshift is coming soon.
To mark a batch of metrics as test metrics, set the isTest parameter to true in the request data, as shown below.
curl \
  “https://events.statsigapi.net/v1/log_custom_metric” \
  --header “statsig-api-key: <YOUR-SDK-KEY>” \
  --header “Content-Type: application/json” \
  --request POST \
  --data “{"isTest": true, “metrics": [{"user_id": "1237", "metric_name": "test_metric", "id_type": "user_id", "metric_value": 90}, {"user_id": "4568", "metric_name": "ratio", "id_type": "stable_id", "numerator": 3, "denominator": 15}]}”
The Metrics Logstream only appears if you are actively ingesting precomputed metrics. If it doesn't appear at the bottom of your Metrics Catalog, a connection or schema issue may be preventing Statsig from receiving your precomputed metrics.
Was this helpful?