Creating Custom Metrics
Learn how to create custom metrics from raw events using Statsig's metric types including event count, user count, and more.
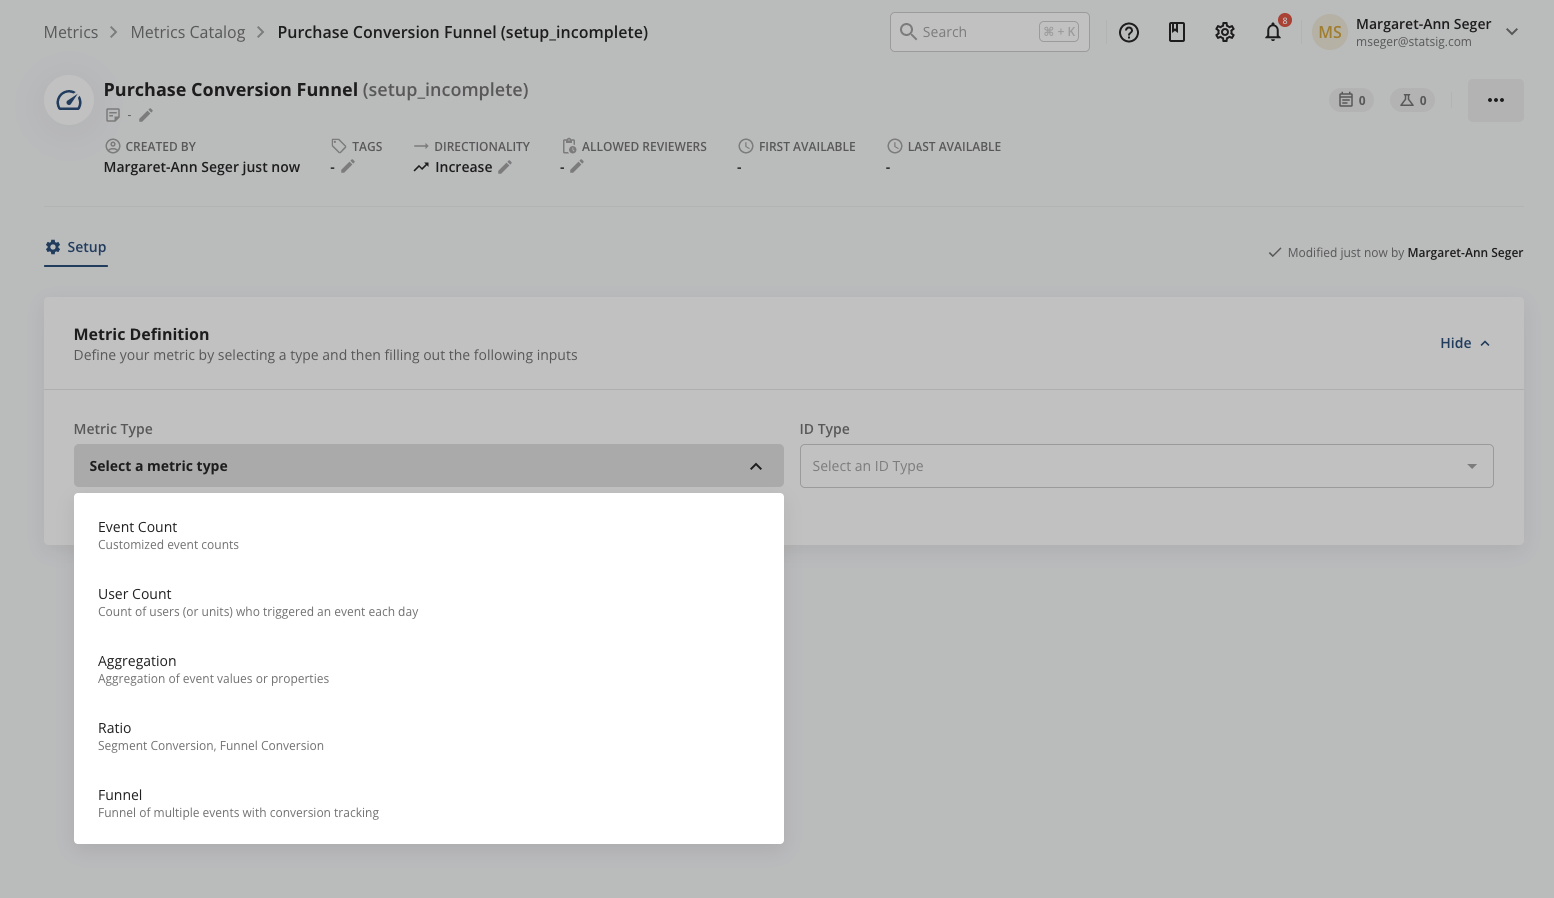
Statsig computes custom metrics from your raw events. To create custom metrics, navigate to Metrics from the left-hand navigation panel, then to the Metrics Catalog tab. Select the Create button.
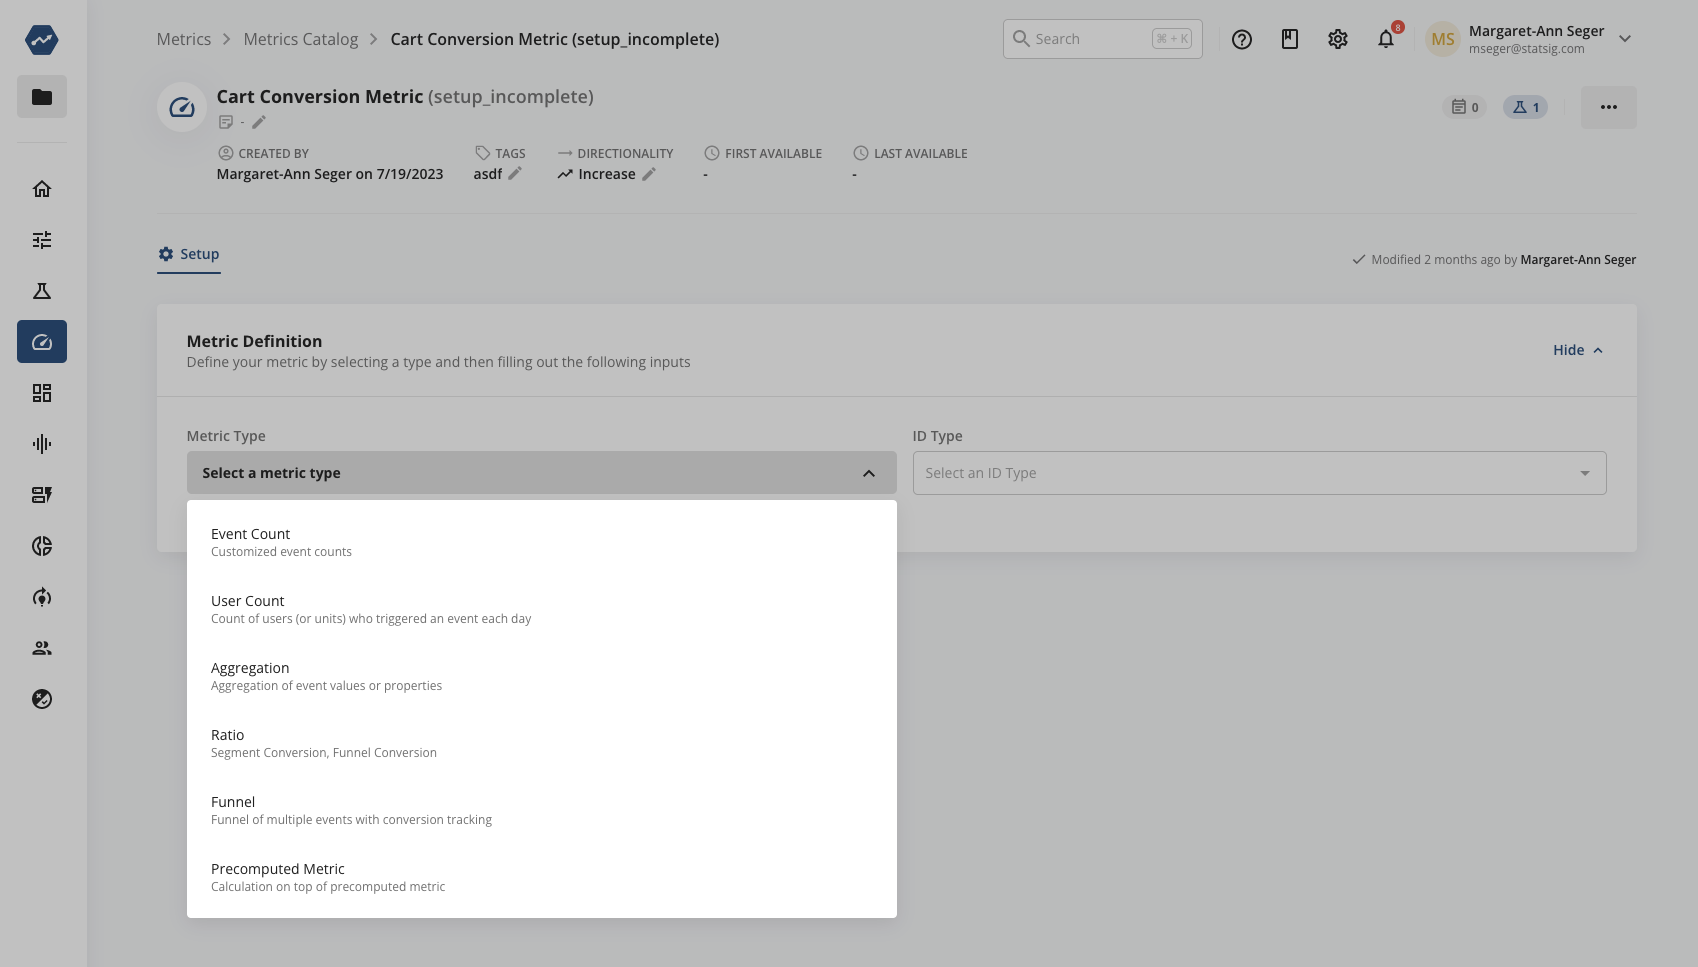
Statsig supports six types of custom metrics:
| Metric Type | Description | Examples |
|---|---|---|
| Event Count | Total count of events filtered by the Value, Metadata, or User Object properties of an event type | Add to Cart event filtered by category type |
| User Count | Number of unique users that trigger events filtered by the Value, Metadata, or User Object of an event type | Active Users based on their views of a product category |
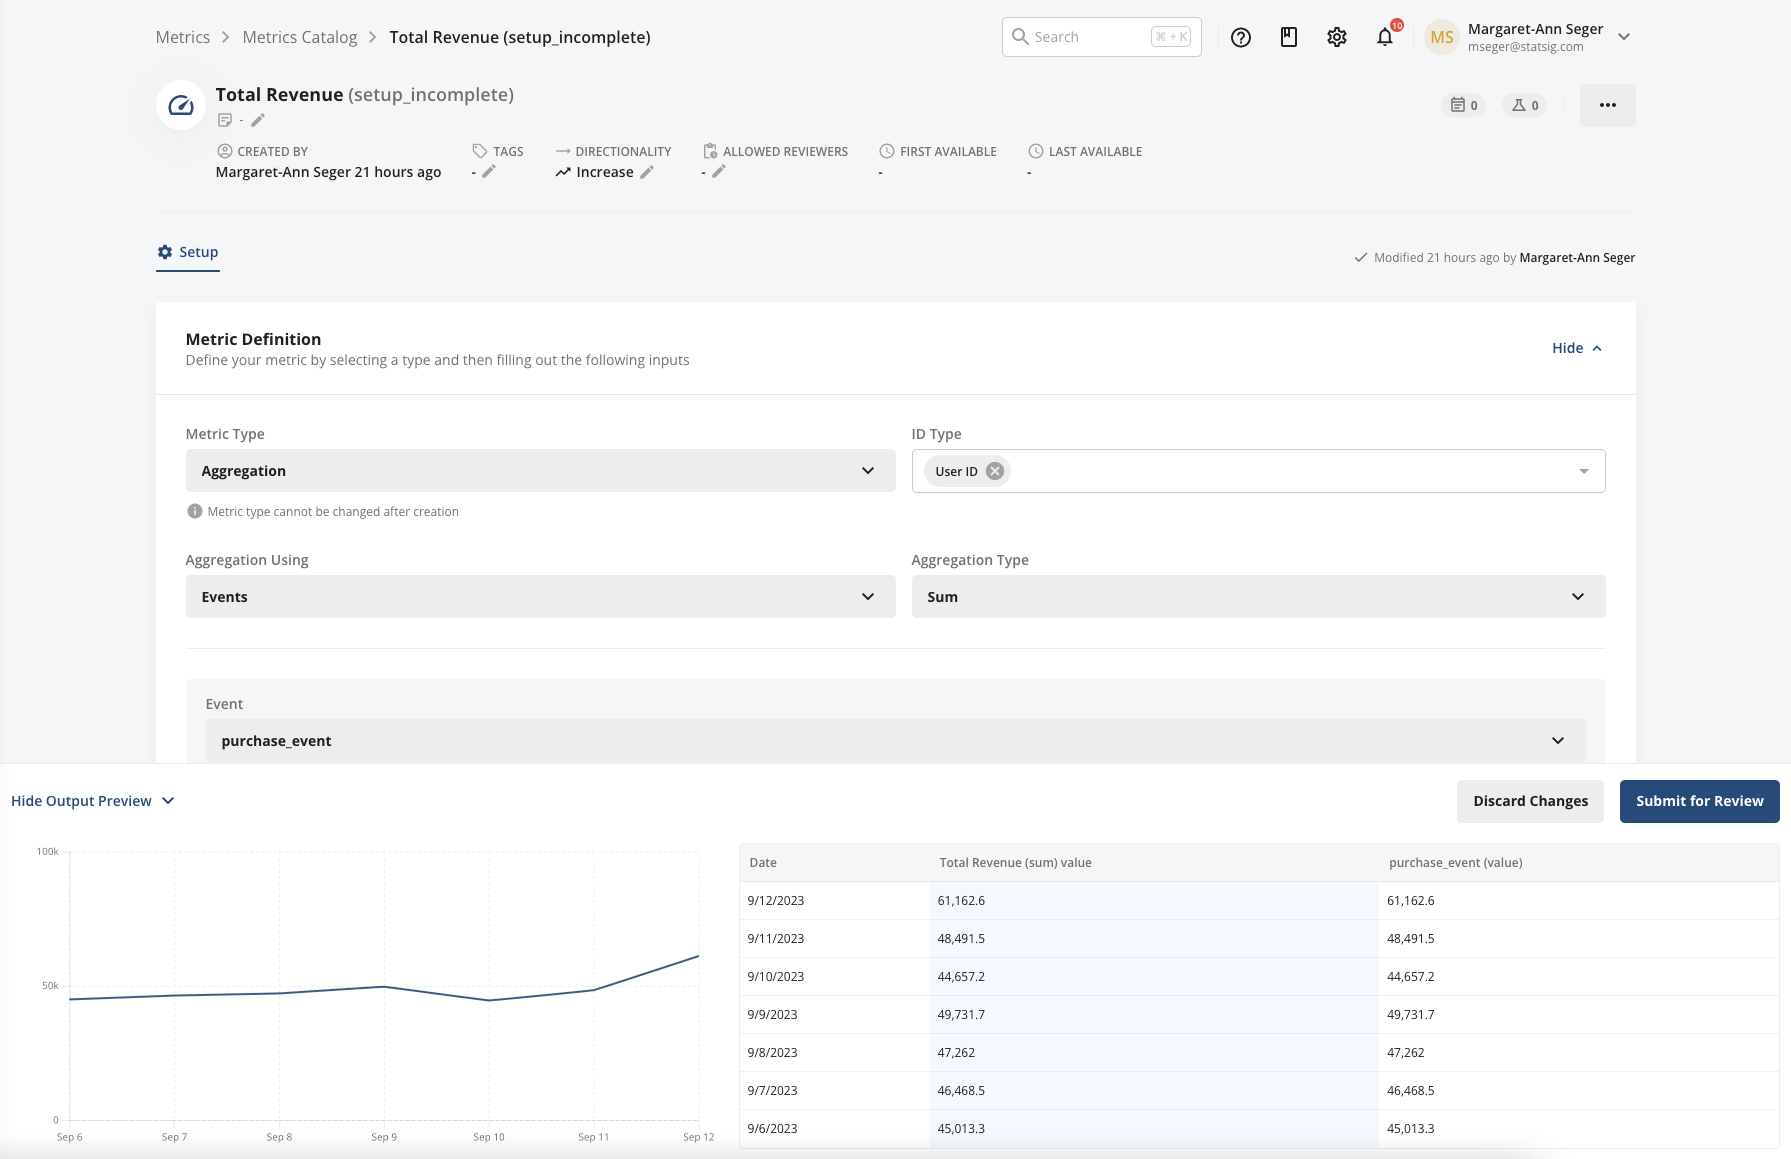
| Aggregation | Sum or Average of the Value, Metadata, and User Object property of an event type | Total Revenue |
| Ratio | Rates (e.g. cart conversion rate, purchase rate), Normalized Values (e.g. sessions per user, items per cart) | Cart Conversion Rate, Sessions per User |
| Funnel | Funnels- funnel of multiple events with conversion tracking | Sign-up Funnel, Checkout Funnel |
| Count Distinct | Count Distinct- Number of unique values for a given field, often approximated with sketches | Unique Songs listened per user |
Statsig computes custom metrics daily for your Metrics dashboard, and rolls them up for the duration of the experiment in Pulse Results for your Feature Gates and Experiments. After you create a custom metric, it doesn't populate until the next day and doesn't backfill to previous days. Statsig calculates the metric only from the creation date forward.
Statsig lets you set a daily max cap for specific metrics. You can define maximum caps for various unit types associated with a metric. Statsig automatically adjusts any value exceeding the cap down to match it. For example, if purchases over $10,000 per day on your e-commerce platform shouldn't skew analysis, Statsig adjusts any transaction above that threshold down to the limit. Capped metrics are available for event count and aggregation (sum) metric types.
When creating a custom metric, you can preview the metric’s value at the bottom of the page. Select View Output Preview to see what the metric would have looked like based on its component values over the last 7 days, in both chart and table form.
Examples
1. Event count metrics
This example sets up a custom event metric to count the number of add_to_cart events filtered by a metadata property called value, which carries the price of the item added to the cart. Because the ID Type is set to userID, Statsig computes this metric as part of the test group that Statsig assigns the corresponding user to in an experiment.
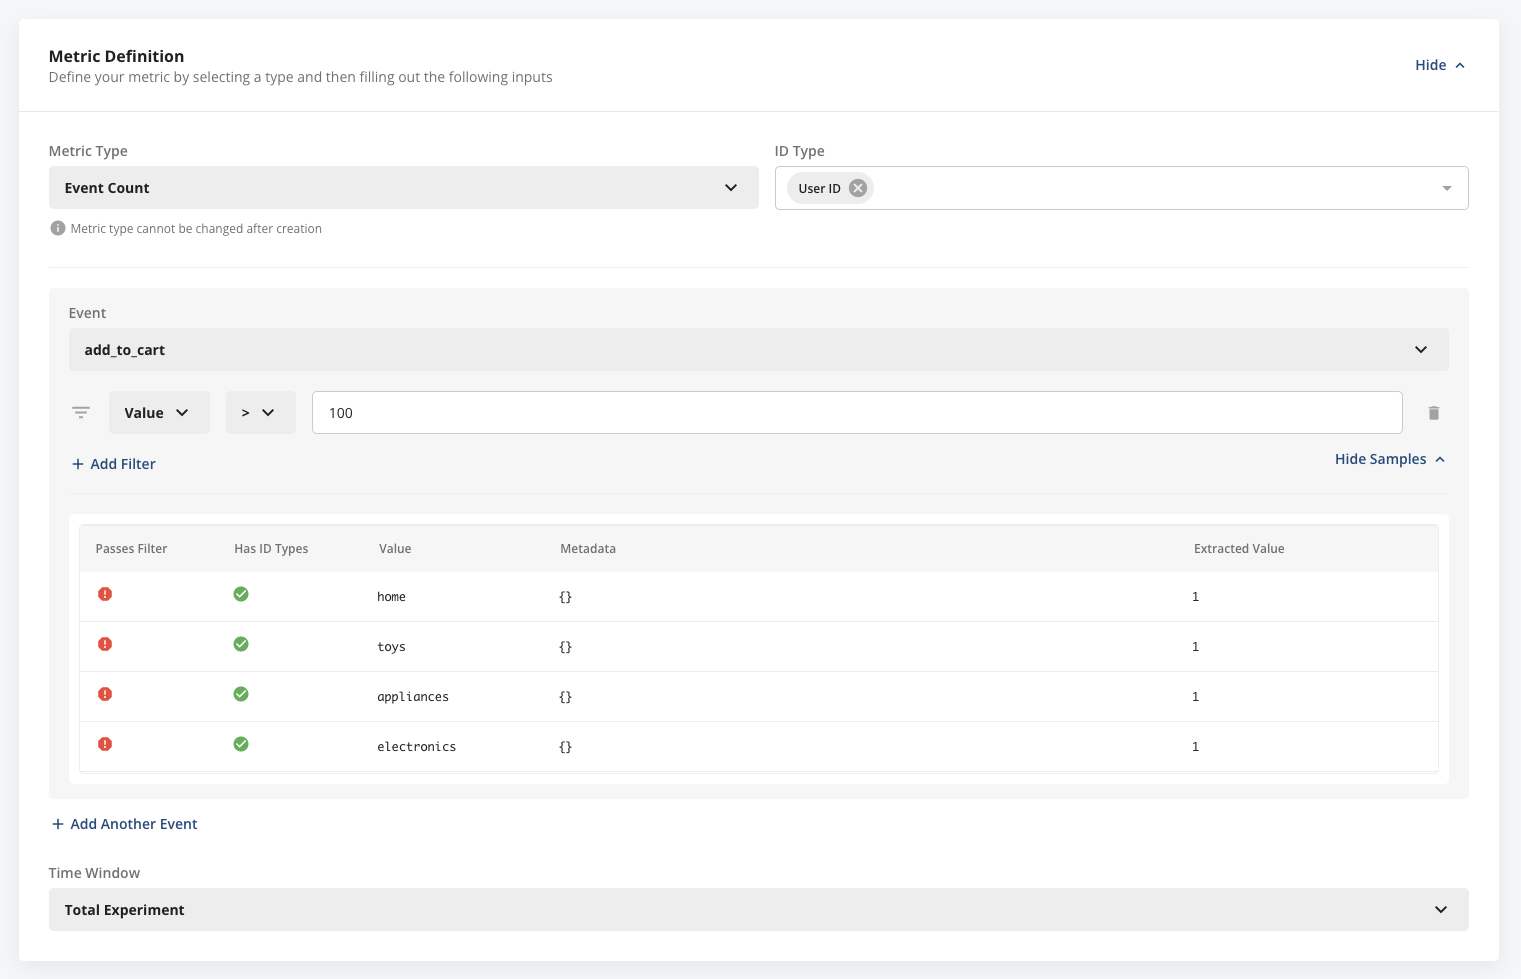
If you select the ID Type as stableID, Statsig computes this metric in the test group that Statsig assigns the corresponding device to in an experiment. When you select more than one ID Type, Statsig computes this metric for each ID Type you specify.
2. User count metrics
The example below creates a metric to count the number of unique users who viewed a product in the toys category that was priced under $10.
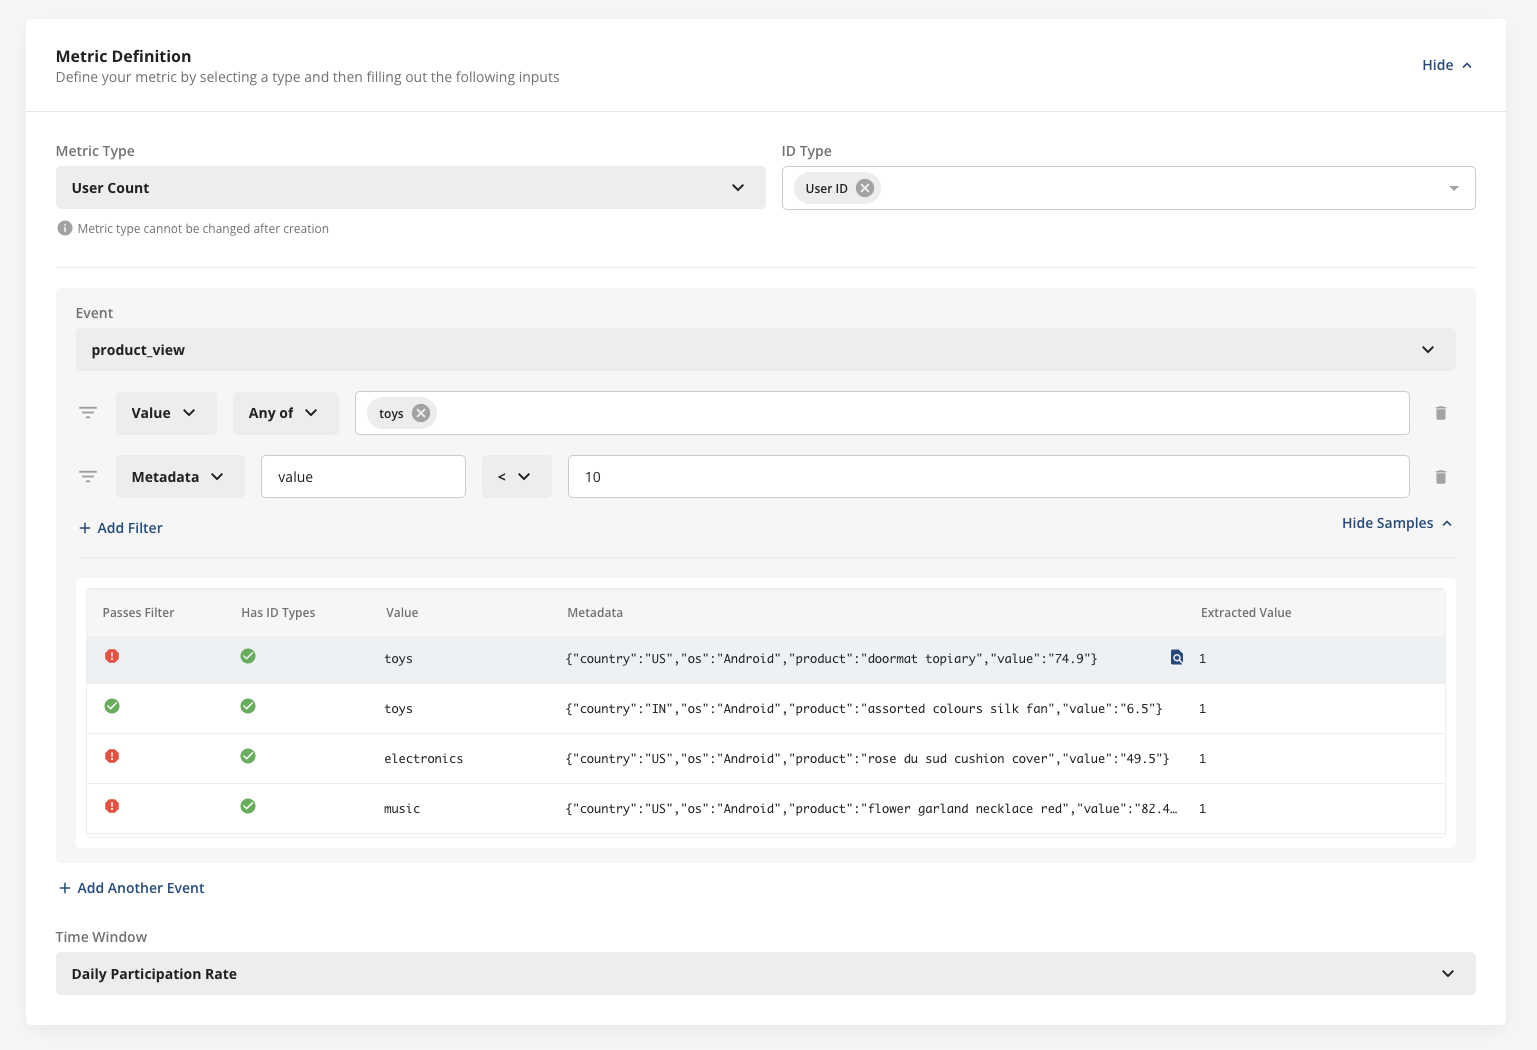
Time Window
Statsig offers three time window options for user count metrics:
- Daily Participation Rate: Counts the total number of days a user has the selected event, divided by the number of days the user is in the experiment. The result is a value between 0 and 1, representing the probability of a user having the event on any given day. Works best for events expected to occur repeatedly for a given user.
- One Time Event: Checks if a user has the selected event at least once during their time in the experiment. The result is a binary metric with value 0 or 1 for each user. Ideal for events expected to occur only once per user, such as sign-up events.
- Custom Attribution Window: Lets you define a custom window after exposure to count an event toward a metric calculation.
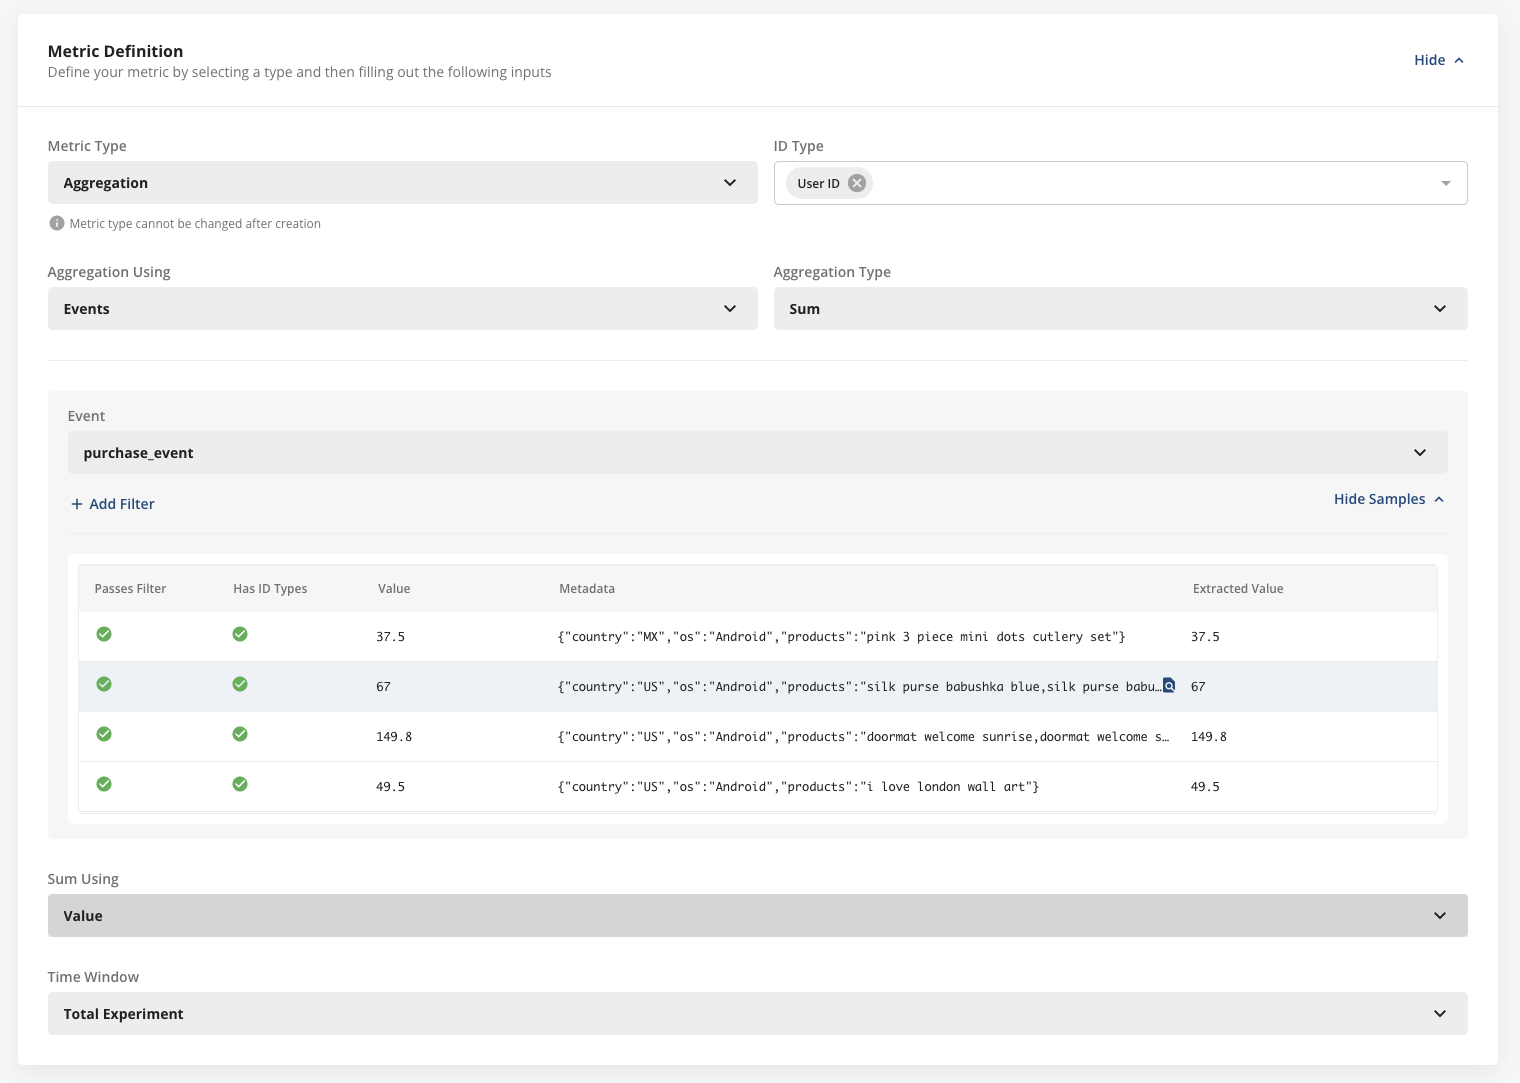
3. Aggregation metrics
The example below shows a Total Revenue metric that sums the value associated with all purchase events.
[In Beta] Currency Sum
eCommerce customers often span multiple currency types and log payments in the currency the user actually pays. Currency sums convert payments recorded in different currencies to a single common currency. You must log two metadata fields in your event: a currency code and a value. Example metadata: _{"currency_code": "USD", "currency_value": 123.45}_
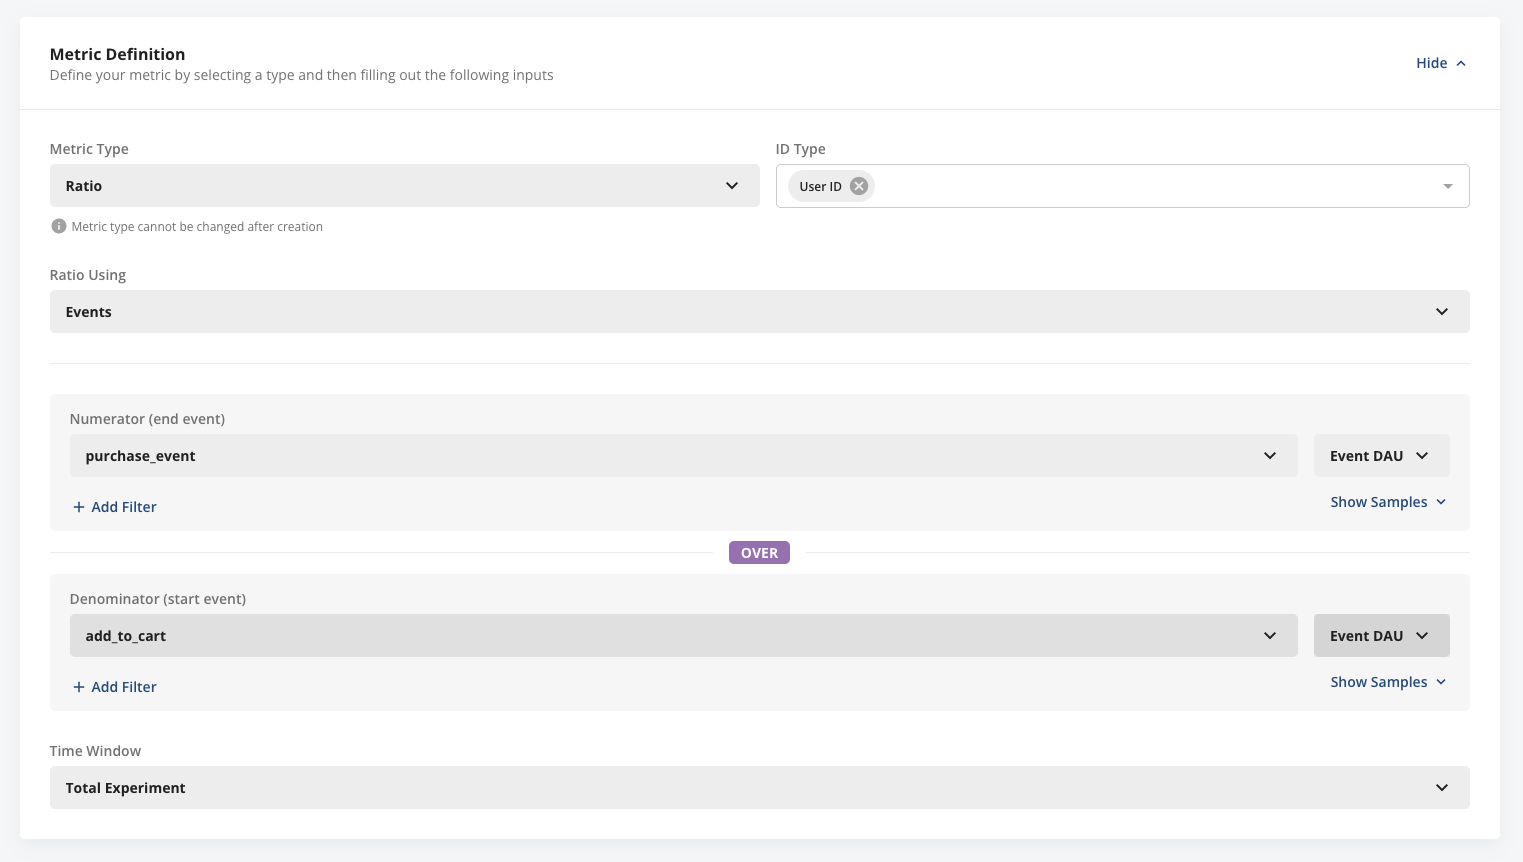
4. Ratio metrics
The example below shows creating a Cart Conversion Rate metric. Statsig uses unique users who triggered the purchase event as the numerator, and unique users who triggered the add to cart event as the denominator. When calculating the numerator, Statsig includes only users who also had the denominator event on the same day. A user who has only a purchase event on a given day without an add to cart on that same day doesn't count toward the numerator.
This pattern also applies to click-through rates (CTR) in any part of a step-wise product journey (funnels). Statsig recommends using unique users in both the numerator and denominator for these metrics. For example, a user who reloads a page multiple times but clicks only once corresponds to a 100% CTR (1 out of 1). A user who loads a page once but clicks a button multiple times also counts as 1 out of 1. This approach handles cases where users see a key button, such as "Sign-up," multiple times a day, and Statsig counts a single click as a success.
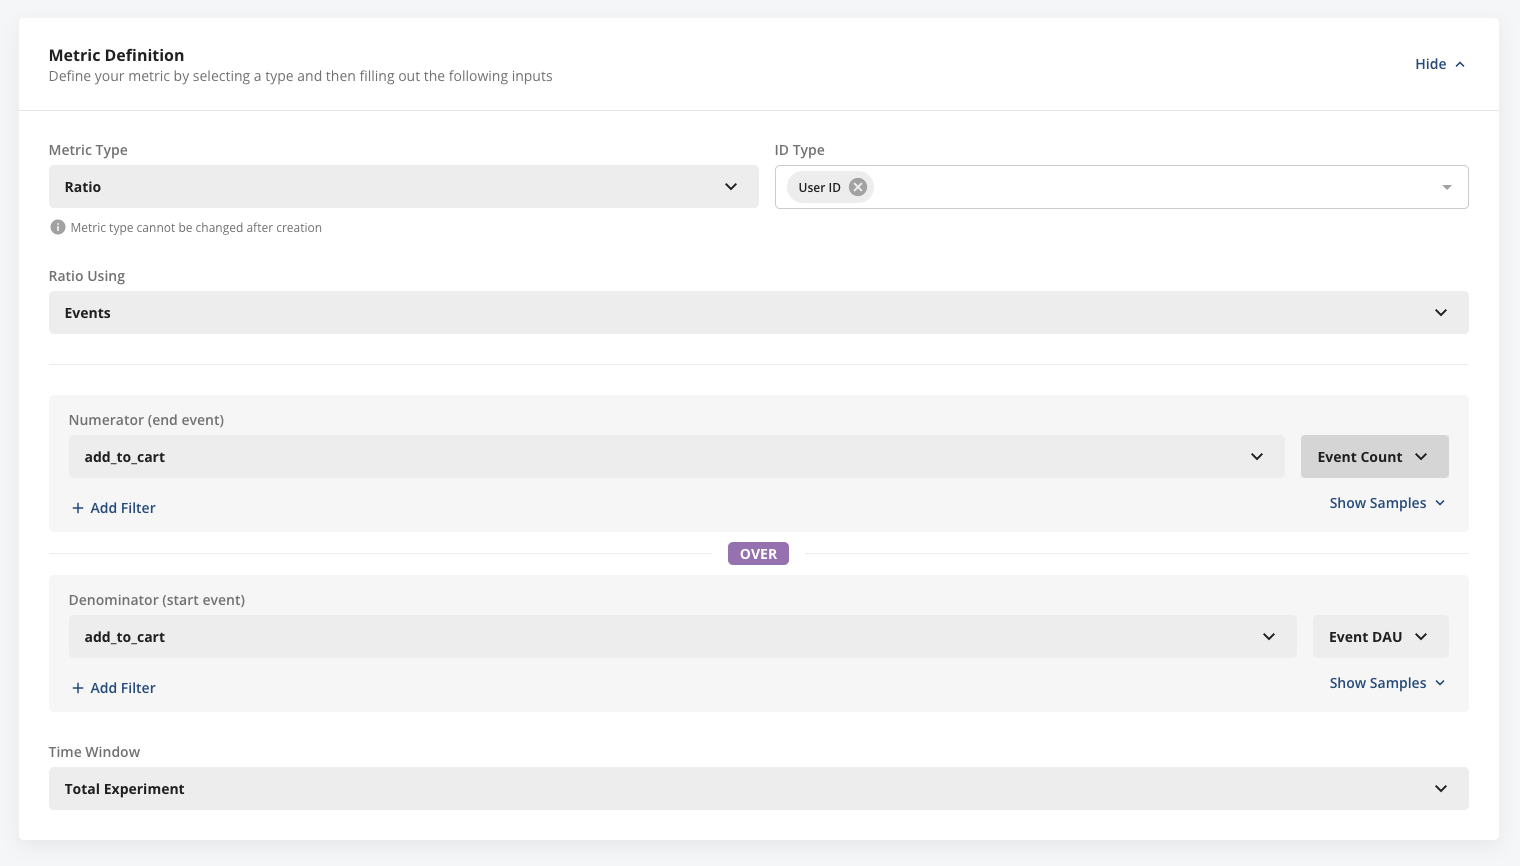
The example below shows creating an Items per Cart metric. You can track the number of unique items added to a cart by logging an add_to_cart event for each item. For the numerator, select total event count. For the denominator, select unique users. Because Statsig computes this metric daily and only for users with a non-zero denominator, it can generate ratios such as 1/1, 2/1, and 5/1 for individual users. When aggregated, this translates to an average such as 10/4 = 2.5 items per cart per day.
A Word of Caution
: In experimentation, ratio metrics are a frequent source of misleading information. It's possible to see an increase in
click through rate
alongside a net
decrease
in total clicks (the opposite may also happen). This situation can occur if the number of unique users viewing a button (denominator) decreases. As a best practice, Statsig recommends tracking the numerator and denominator as independent metrics when monitoring ratio indicator. Ratio metrics are often subject to statistical noise and can be tricky to use for obtaining a statistically significant result. In addition, for the numerator in ratios, Statsig excludes units that don't have a denominator value.
5. Funnel metrics
You can create a custom funnel metric from either the Custom Metrics Creation wizard in the Metrics Catalog or through the Charts tab.
Important Note
: Statsig handles funnel metrics differently between the Cloud and Warehouse Native platforms. Funnel metrics using the Cloud platform are
always
unordered, meaning that funnel steps can be completed in any order, and they have a time window of
one day
. This means that for the metric to record a completion, all steps must be triggered by a user within 24 hours. In contrast, funnel metrics on Warehouse Native have the option to be set with strict ordering and custom time windows.
Components of funnel metrics
Funnel metrics have a few components:
- Lineage: Surfaces the events used to generate the funnel
- Metric Value: Metric value represents the overall funnel conversion rate, or the percentage of users who complete a funnel (trigger the end event) relative to all users who start the funnel (trigger the starting event)
- Conversion rate between stages: This set of metrics track the percentage of users who triggered an event N relative to all users that triggered event N-1 in the funnel
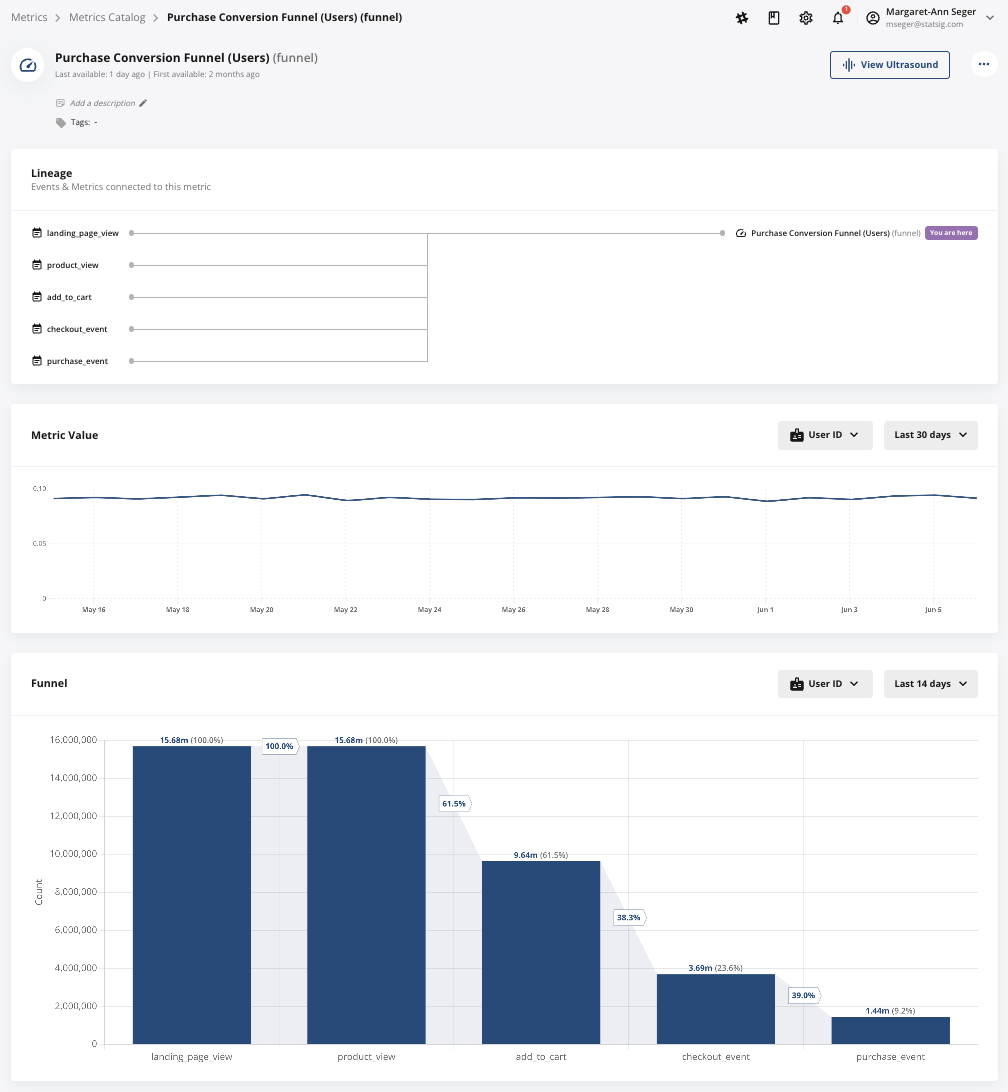
After Statsig creates and populates funnels, you can view your funnel metric like any other metric in Pulse. You can also expand the funnel metric to view Pulse performance at each step in the funnel.
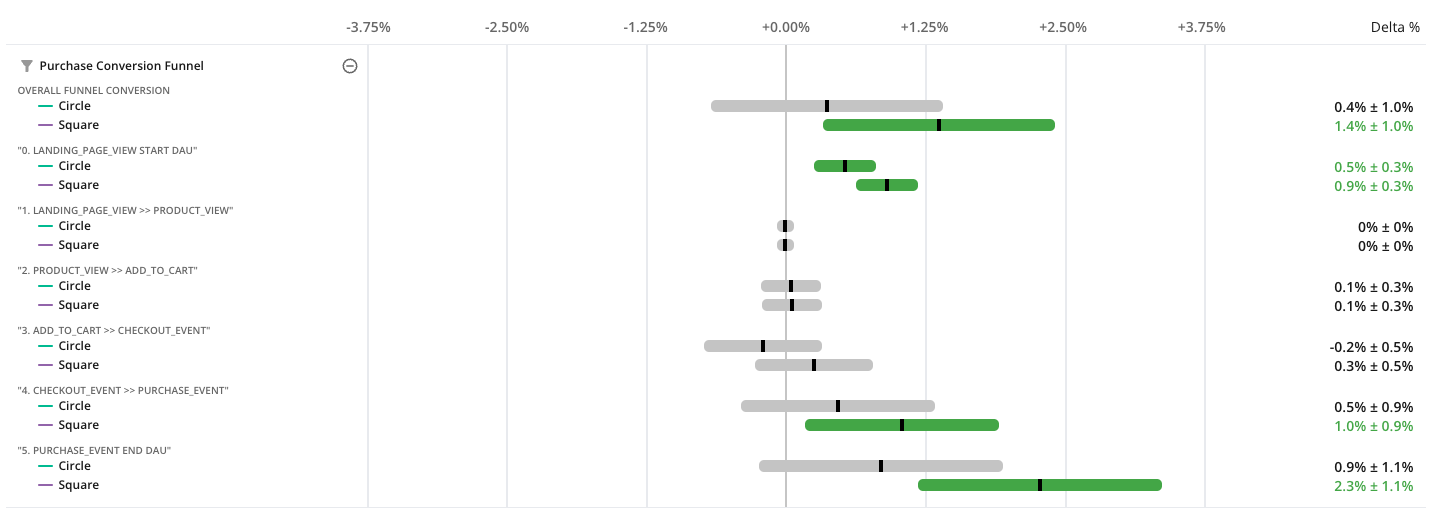
In the example below, the Square variant shows a lift in the overall funnel conversion rate. Expanding the metrics to examine the entire funnel reveals two key insights:
- Both the Square and Circle variants show a lift in top-of-funnel DAU (Land Page View Start DAU). However, only the Square variant shows statistically significant increase in end-of-funnel DAU (Purchase Event End DAU).
- The overall funnel conversion rate improvement for Square is primarily due to the higher conversion from Checkout Event to Purchase Event stages in the funnel.
6. Count distinct metrics
Sketch-based count distinct metrics are in beta. Reach out to Statsig support if you would like Statsig to enable this.
- What it is: A high-performance way to estimate the number of distinct values using compact sketch data structures. Example use cases include unique songs per user or unique products purchased per user.
- Benefit: Much faster to compute and uses significantly less memory compared to exact distinct counting, especially at high cardinality.
Custom metrics and dimensions
For custom metrics composed of a single event (event count, event DAU, aggregation, and so on), Statsig automatically includes the dimensions of the source event in the custom metric and exposes them as dimensions of that metric. If your custom metric is composed of two or more different events, Statsig doesn't include the dimensions of those source events in the custom metric, and they aren't queryable through the "Explore" tab in Pulse Results.
Was this helpful?