Funnel Metrics
Create custom funnel metrics to track user conversion rates through multi-step processes.
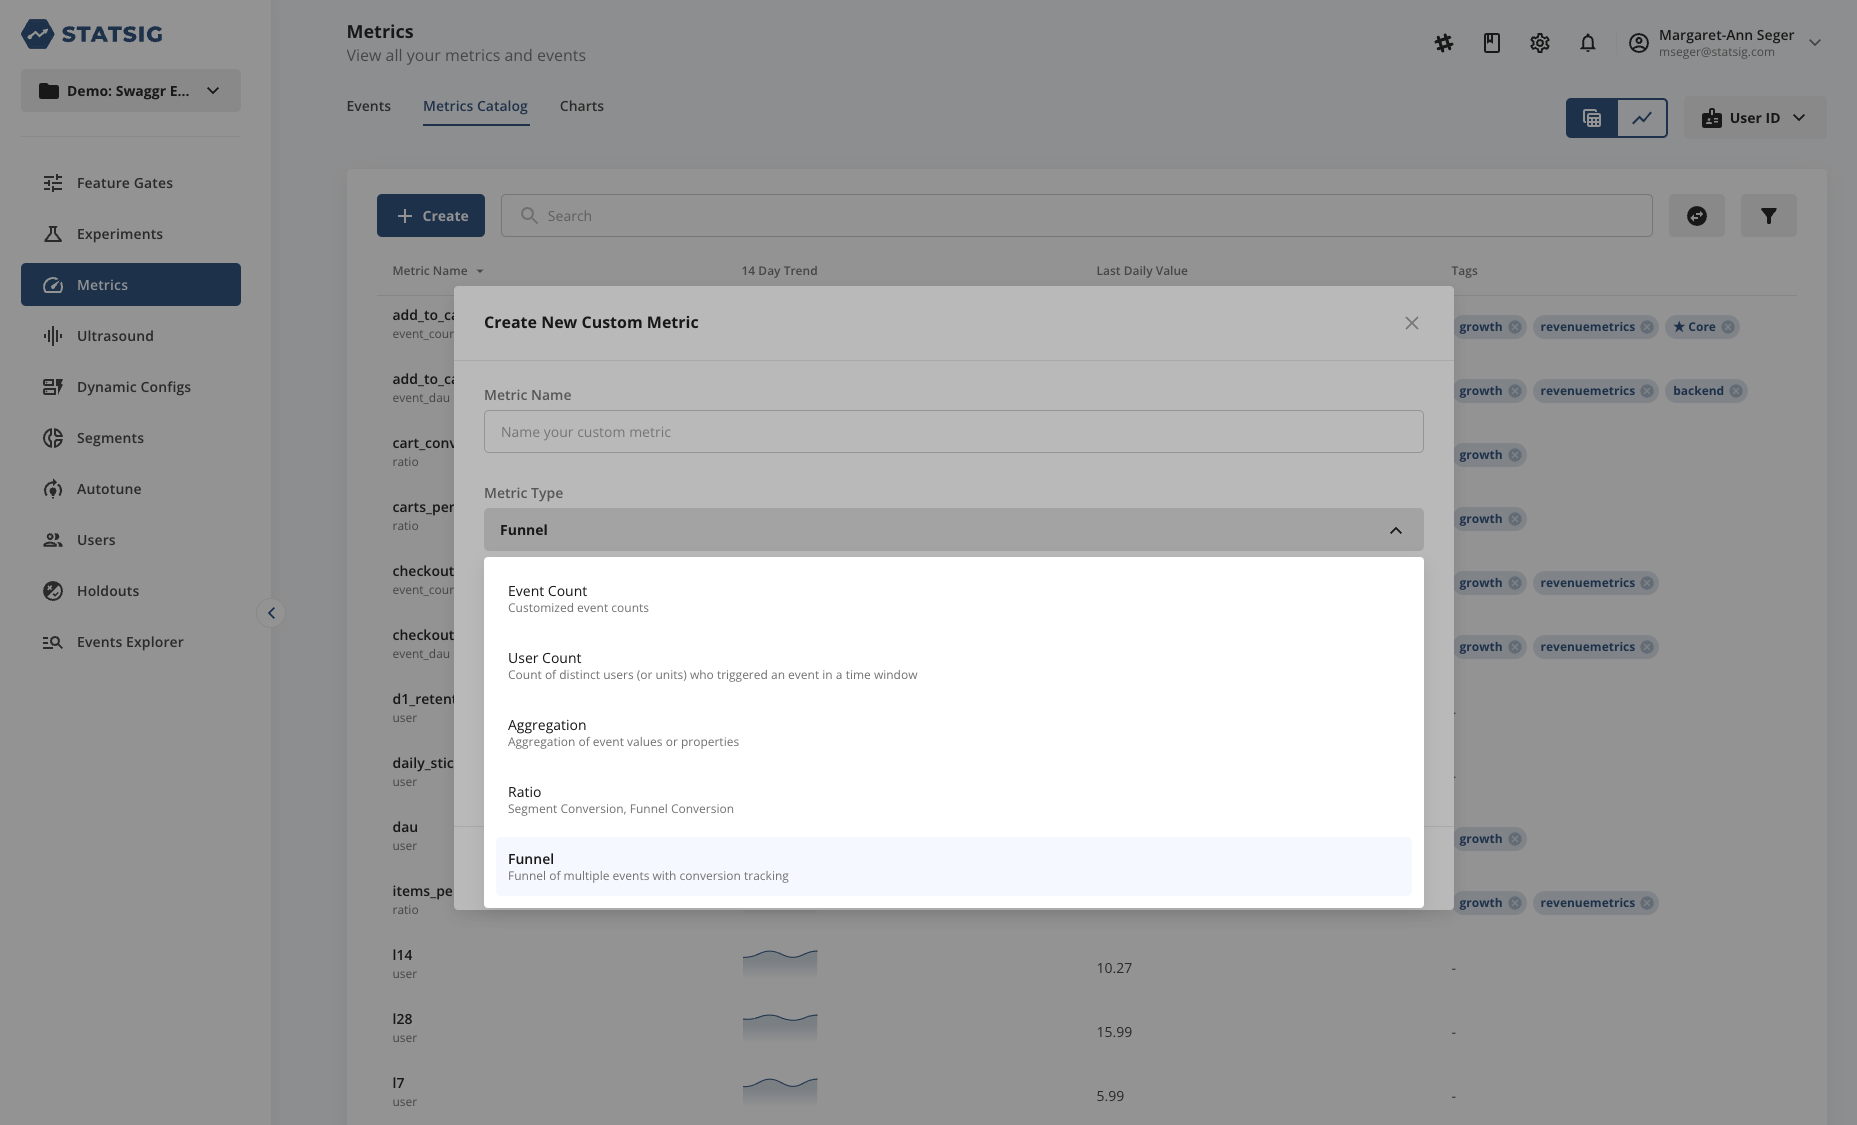
You can create a custom funnel metric from either the Custom Metrics creation wizard in the Metrics Catalog or through the Charts tab.
Components of Funnel Metrics
Funnel metrics have the following components:
- Lineage: Surfaces the events used to generate the funnel
- Metric Value: Metric value represents the overall funnel conversion rate, or the percentage of users who complete a funnel (trigger the end event) relative to all users who start the funnel (trigger the starting event)
- Roll-up Window: Statsig calculates funnel metrics daily.
- Conversion Rate between Stages: This set of metrics track the percentage of users who triggered an event N relative to all users that triggered event N-1 in the funnel
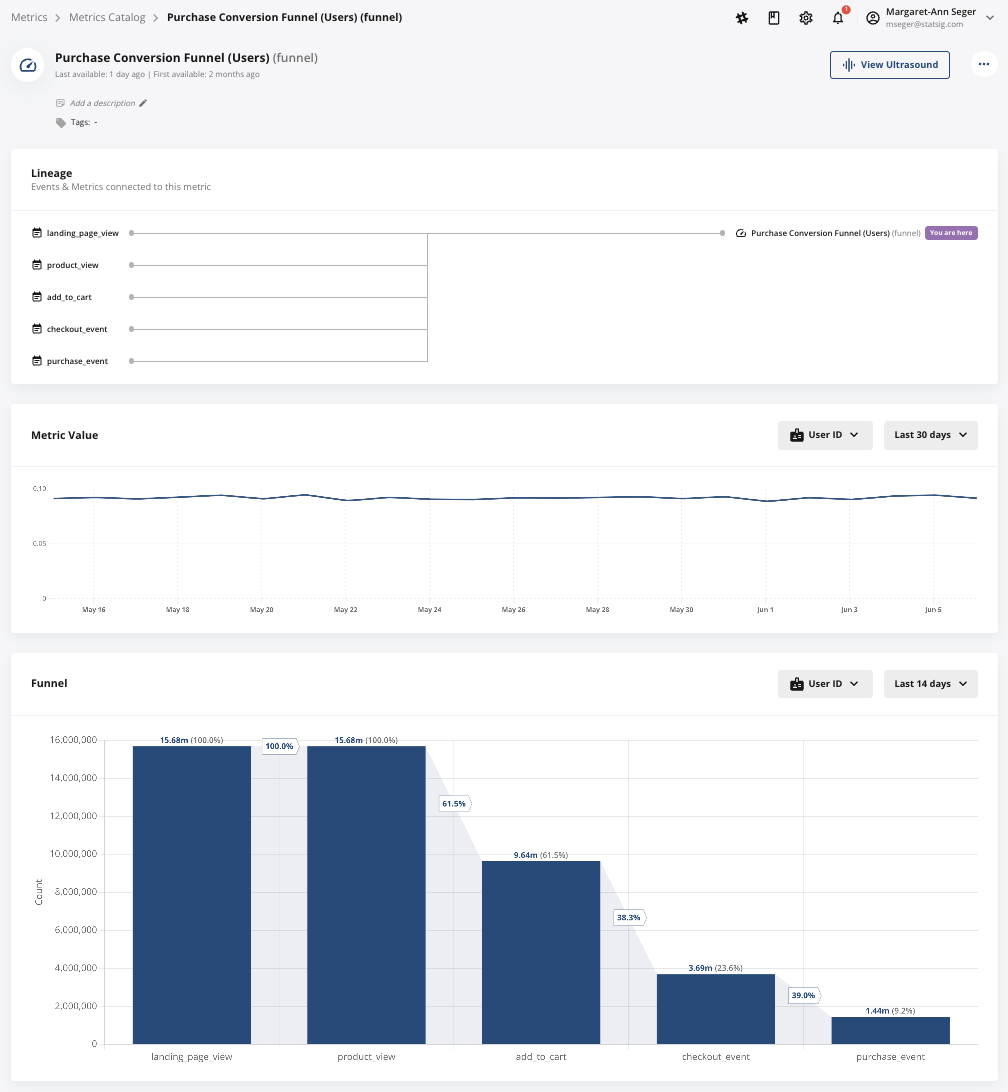
After funnels are created and populated, you can view your funnel metric like any other metric in Pulse. You can also expand the funnel metric to view Pulse performance at each step in the funnel.
User-based Funnel Metrics
When counting distinct events, funnel metrics sum the number of events per day over the analysis period. When counting distinct users, funnel metrics sum the number of distinct users per day over the analysis period.
For example, if a funnel consists of events A, B, and C in that order, user-based funnel metrics count the number of distinct users who triggered events A, B, and C on a given day. If you're tracking funnel conversion over multiple days, the daily granularity of funnel metrics may not suit your analysis.
Example
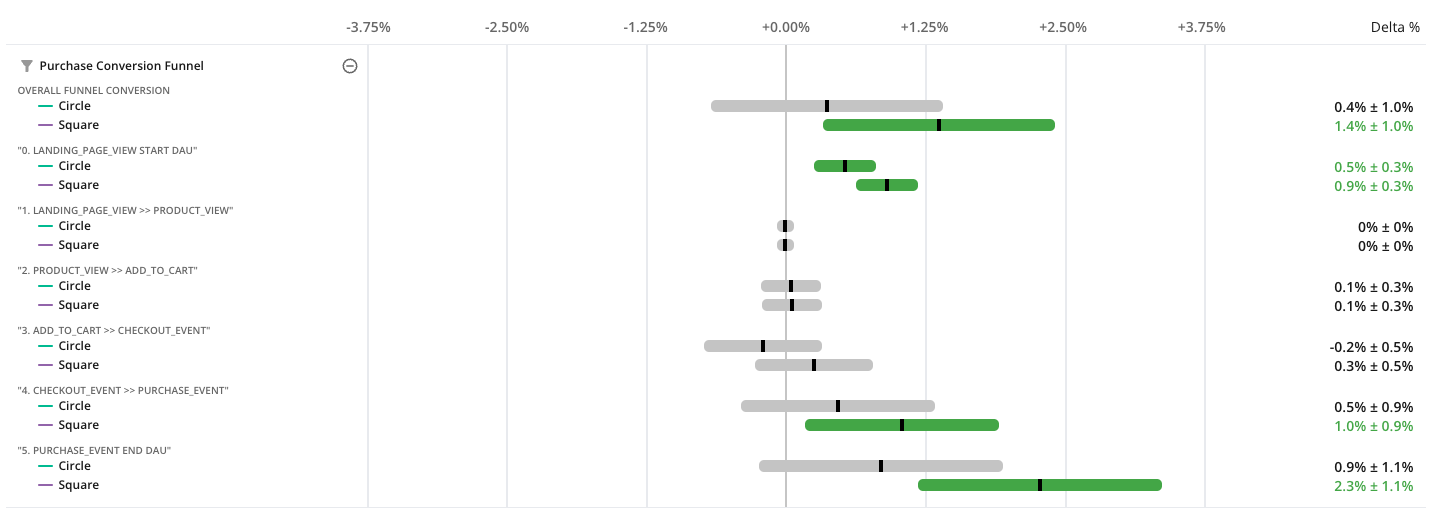
In the example below, the Square variant shows a lift in the overall funnel conversion rate. Expanding the metrics to examine the entire funnel reveals two key insights:
- Both the Square and Circle variants show a lift in top-of-funnel DAU (Land Page View Start DAU). However, only the Square variant shows statistically significant increase in end-of-funnel DAU (Purchase Event End DAU).
- The overall funnel conversion rate improvement for Square is primarily due to the higher conversion from Checkout Event to Purchase Event stages in the funnel.
Was this helpful?