Custom "Explore" Queries
Run custom queries on Statsig experiment results to explore segments, joins, and aggregations beyond the built-in scorecard and drill-down views.
Custom queries let you run additional experiment analyses on your existing data beyond what is in the main Results tab. Use them to gain deeper insights from your experiments and feature rollouts, debug interesting results, or narrow your results to specific sub-groups. Custom queries let you filter or group metrics by event or user dimensions. You can also filter to a specific set of users to see how an experiment or launch impacted those users.
Custom queries are experimental analyses identical to those in the main Results tab, and all the same statistical procedures apply. Statsig computes results as p-values and confidence intervals for your metric deltas, and you can use advanced statistical methods like CUPED and Sequential Testing.Be careful when drawing your inferences of Custom Queries, especially when grouping by a dimension with many options. Grouping this way can increase your chance of seeing a false-positive statistically significant result.
Dimension loading timing for precomputed user dimensions
When viewing results for precomputed user dimensions (which are configured and run on a schedule), be aware that Statsig loads these dimensions through separate asynchronous explore queries. This asynchronous loading means:
- The main experiment results appear first.
- Precomputed dimensions continue loading in the background and become available within a few minutes.
- This timing gap is most noticeable immediately after the first reload of the day.
- If you see "No dimensions available for this time range" for precomputed dimensions, wait a few minutes and refresh to see if dimensions have completed loading.
This timing behavior only affects precomputed user dimensions that run on a schedule. User-triggered custom queries don't experience this asynchronous loading delay.
Running a custom query
To run a Custom Query, navigate to the Explore tab within your experiment.
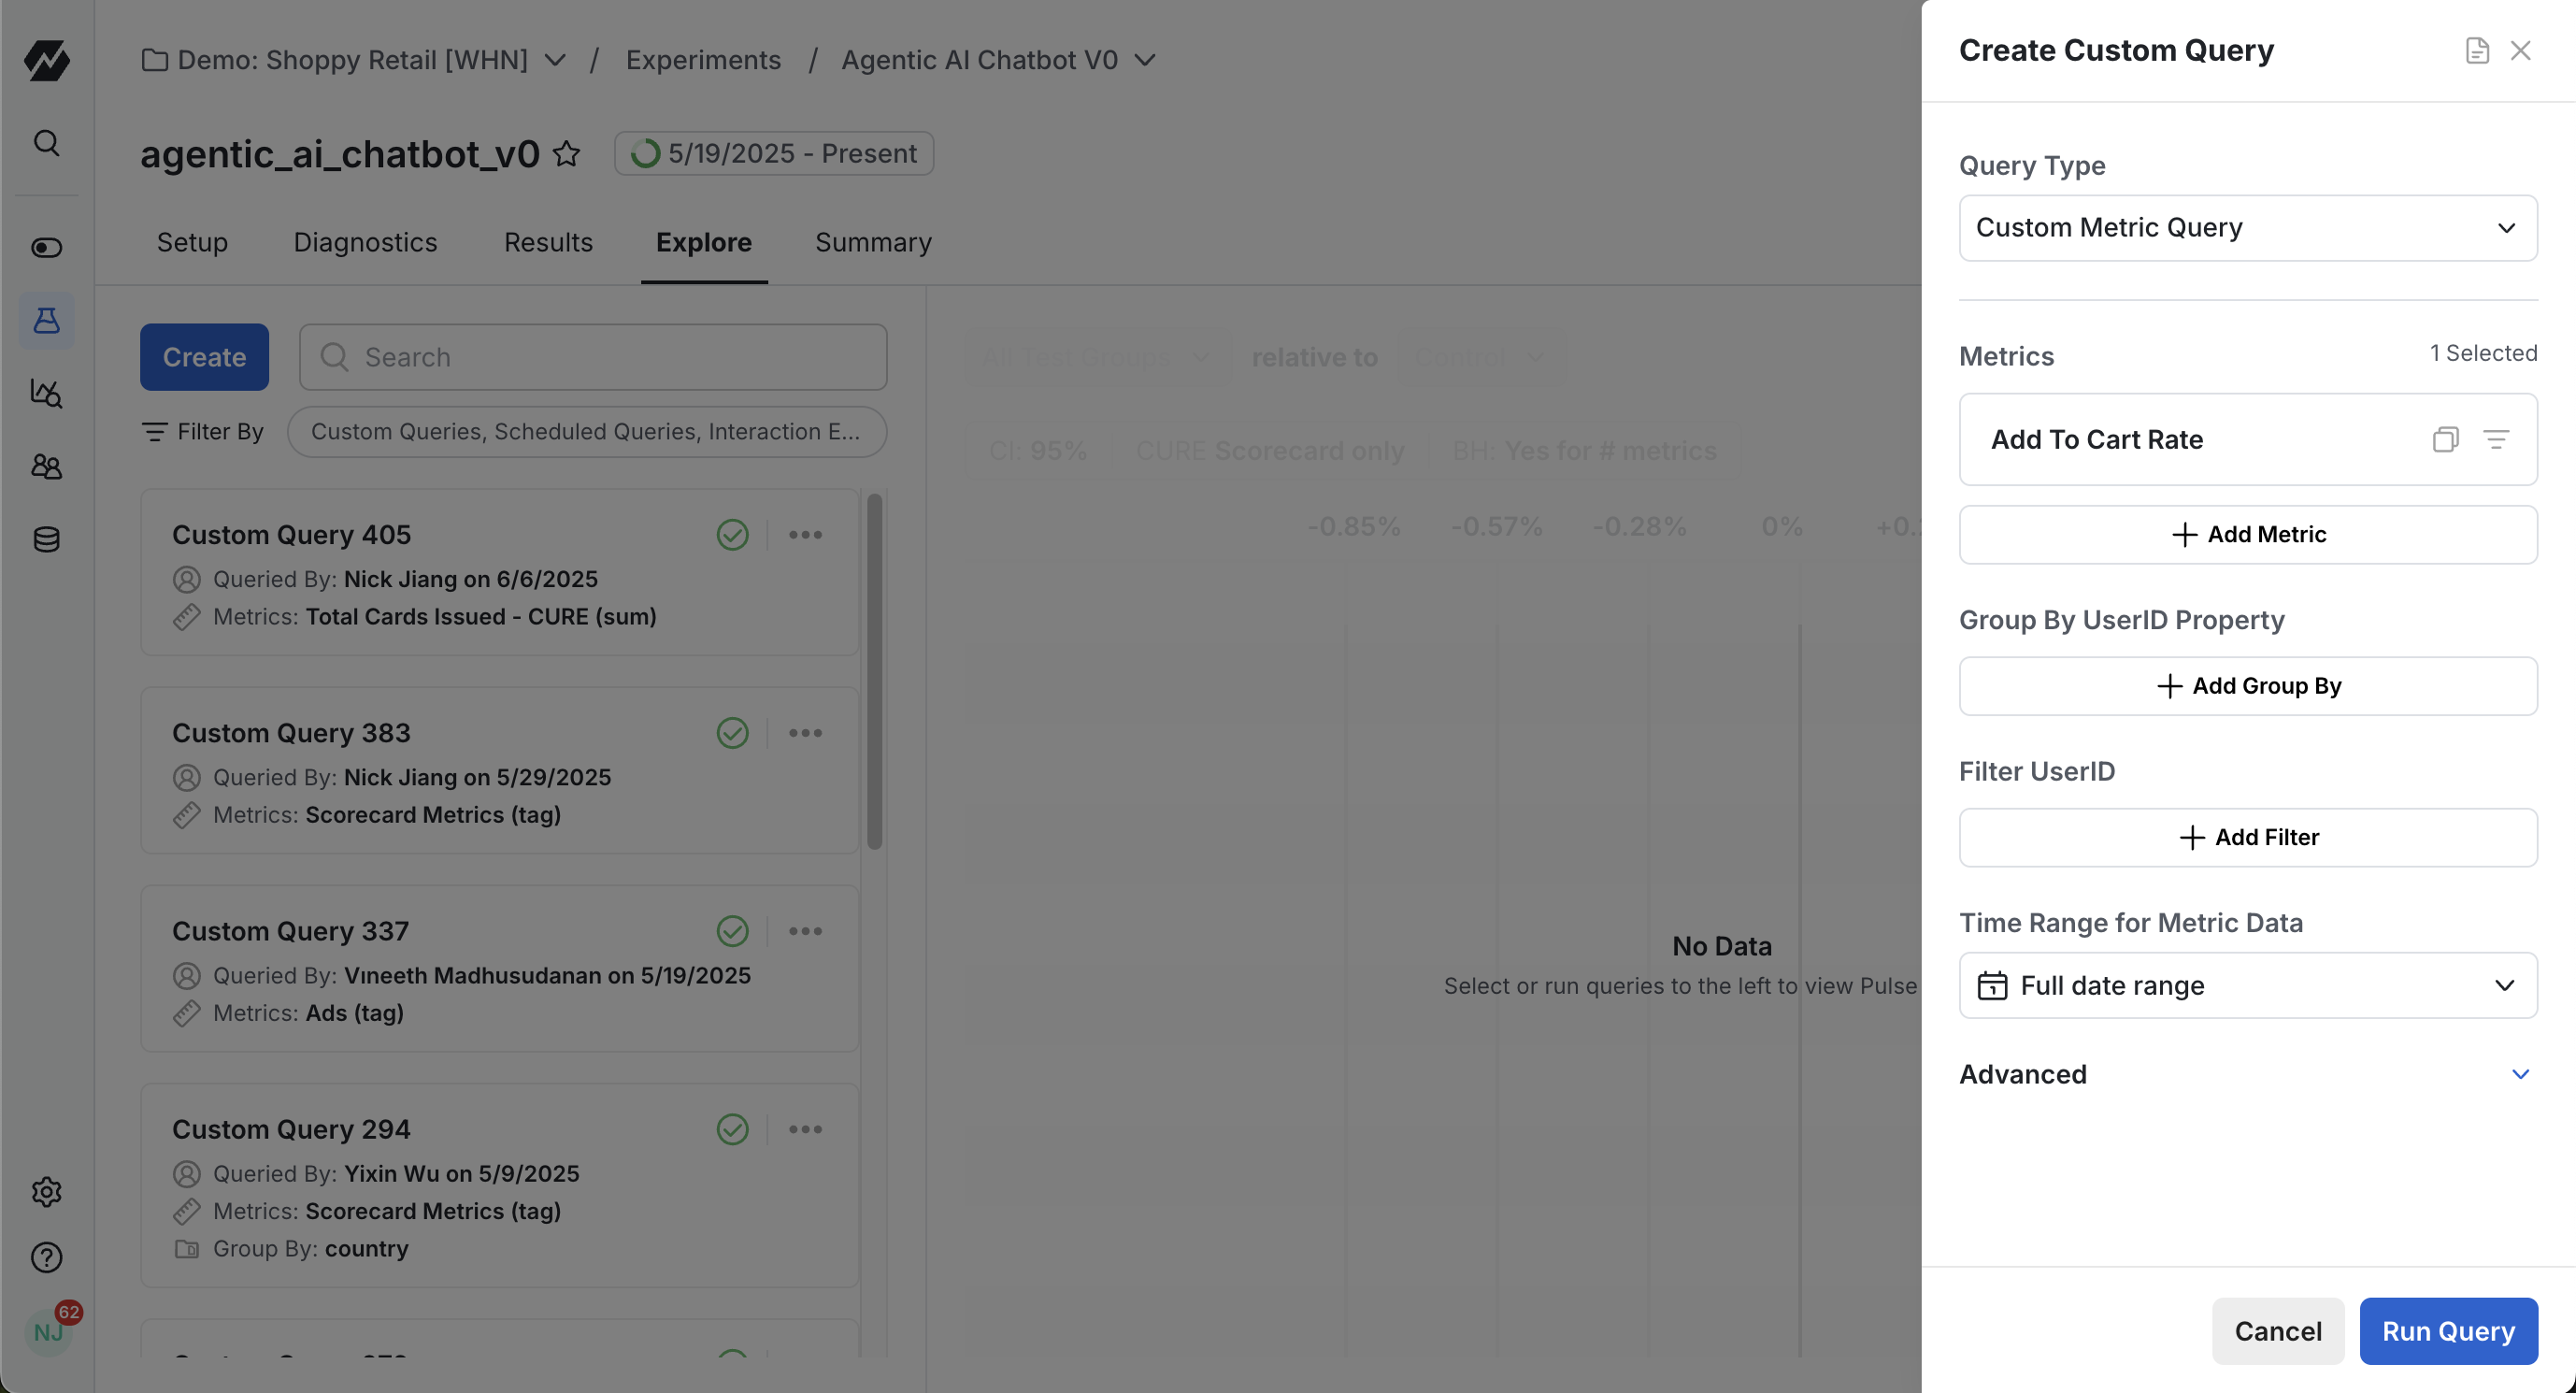
Custom Query fields:
- Metric(s): The metric(s) you want to analyze. You can select a single metric, a few metrics, or a Metric Tag. Adding a Tag includes all the metrics within that Tag in your Custom Query. There are three "default" metric selections included as shortcuts:
- "Scorecard Metrics", all metrics included in your experiment setup's Primary and Secondary Metrics sections
- "Primary Metrics"
- "Secondary Metrics"
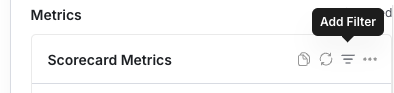
- Metric Filter: With metrics selected, you can filter metrics by either Event or User dimensions using the "Add Filter" dropdown. For example, if you wanted to look at your experiment results for Canadian users only, you could filter to "Country = CA".
- Group By: You can group your Custom Query results by either an Event or User dimension. You can apply Custom Query filters at the per-metric level. The Group By action is at the query level, so whatever Group By you select applies to all included metrics.
- Time Range for Metric Data: The date range you're running your analysis on. By default this is the "Full date range" of your experiment data.
- (Advanced) ID List Segment filters: You can choose an ID-list based Segment, and Statsig calculates results only for users who are in that segment. This filter can be useful if you forgot to log an important user dimension that you want to filter to, or realized that you only care about a sub-population that you've defined in your own data warehouse.
- Careful! This option can easily lead to erroneous and biased results. Make sure the segment is defined based on the user's status before they were exposed to the experiment or feature gate.
- Similarly, you can choose to exclude a certain ID list segment, for example if you want to exclude a set of users who have been retroactively identified as bad actors from your lifts analysis.
- (Advanced) Filter by Exposure Date: You can also filter the results by Exposure Date which can give you more flexibility. You can choose only include or exclude a date range, or in WHN, you can additionally include/exclude users based on when they were first exposed to the experiment.
- Filtering by Exposure Date is useful when your metrics have novelty effect, delayed impact, or specific scenarios where you only want to filter your results to certain users. Use this filter cautiously because it can lead to biased results.
User groups in experiment results are based off of first-touch attribution. Statsig bases the filters and grouping on the user attributes collected at the time of first exposure in the gate/experiment/layer check.
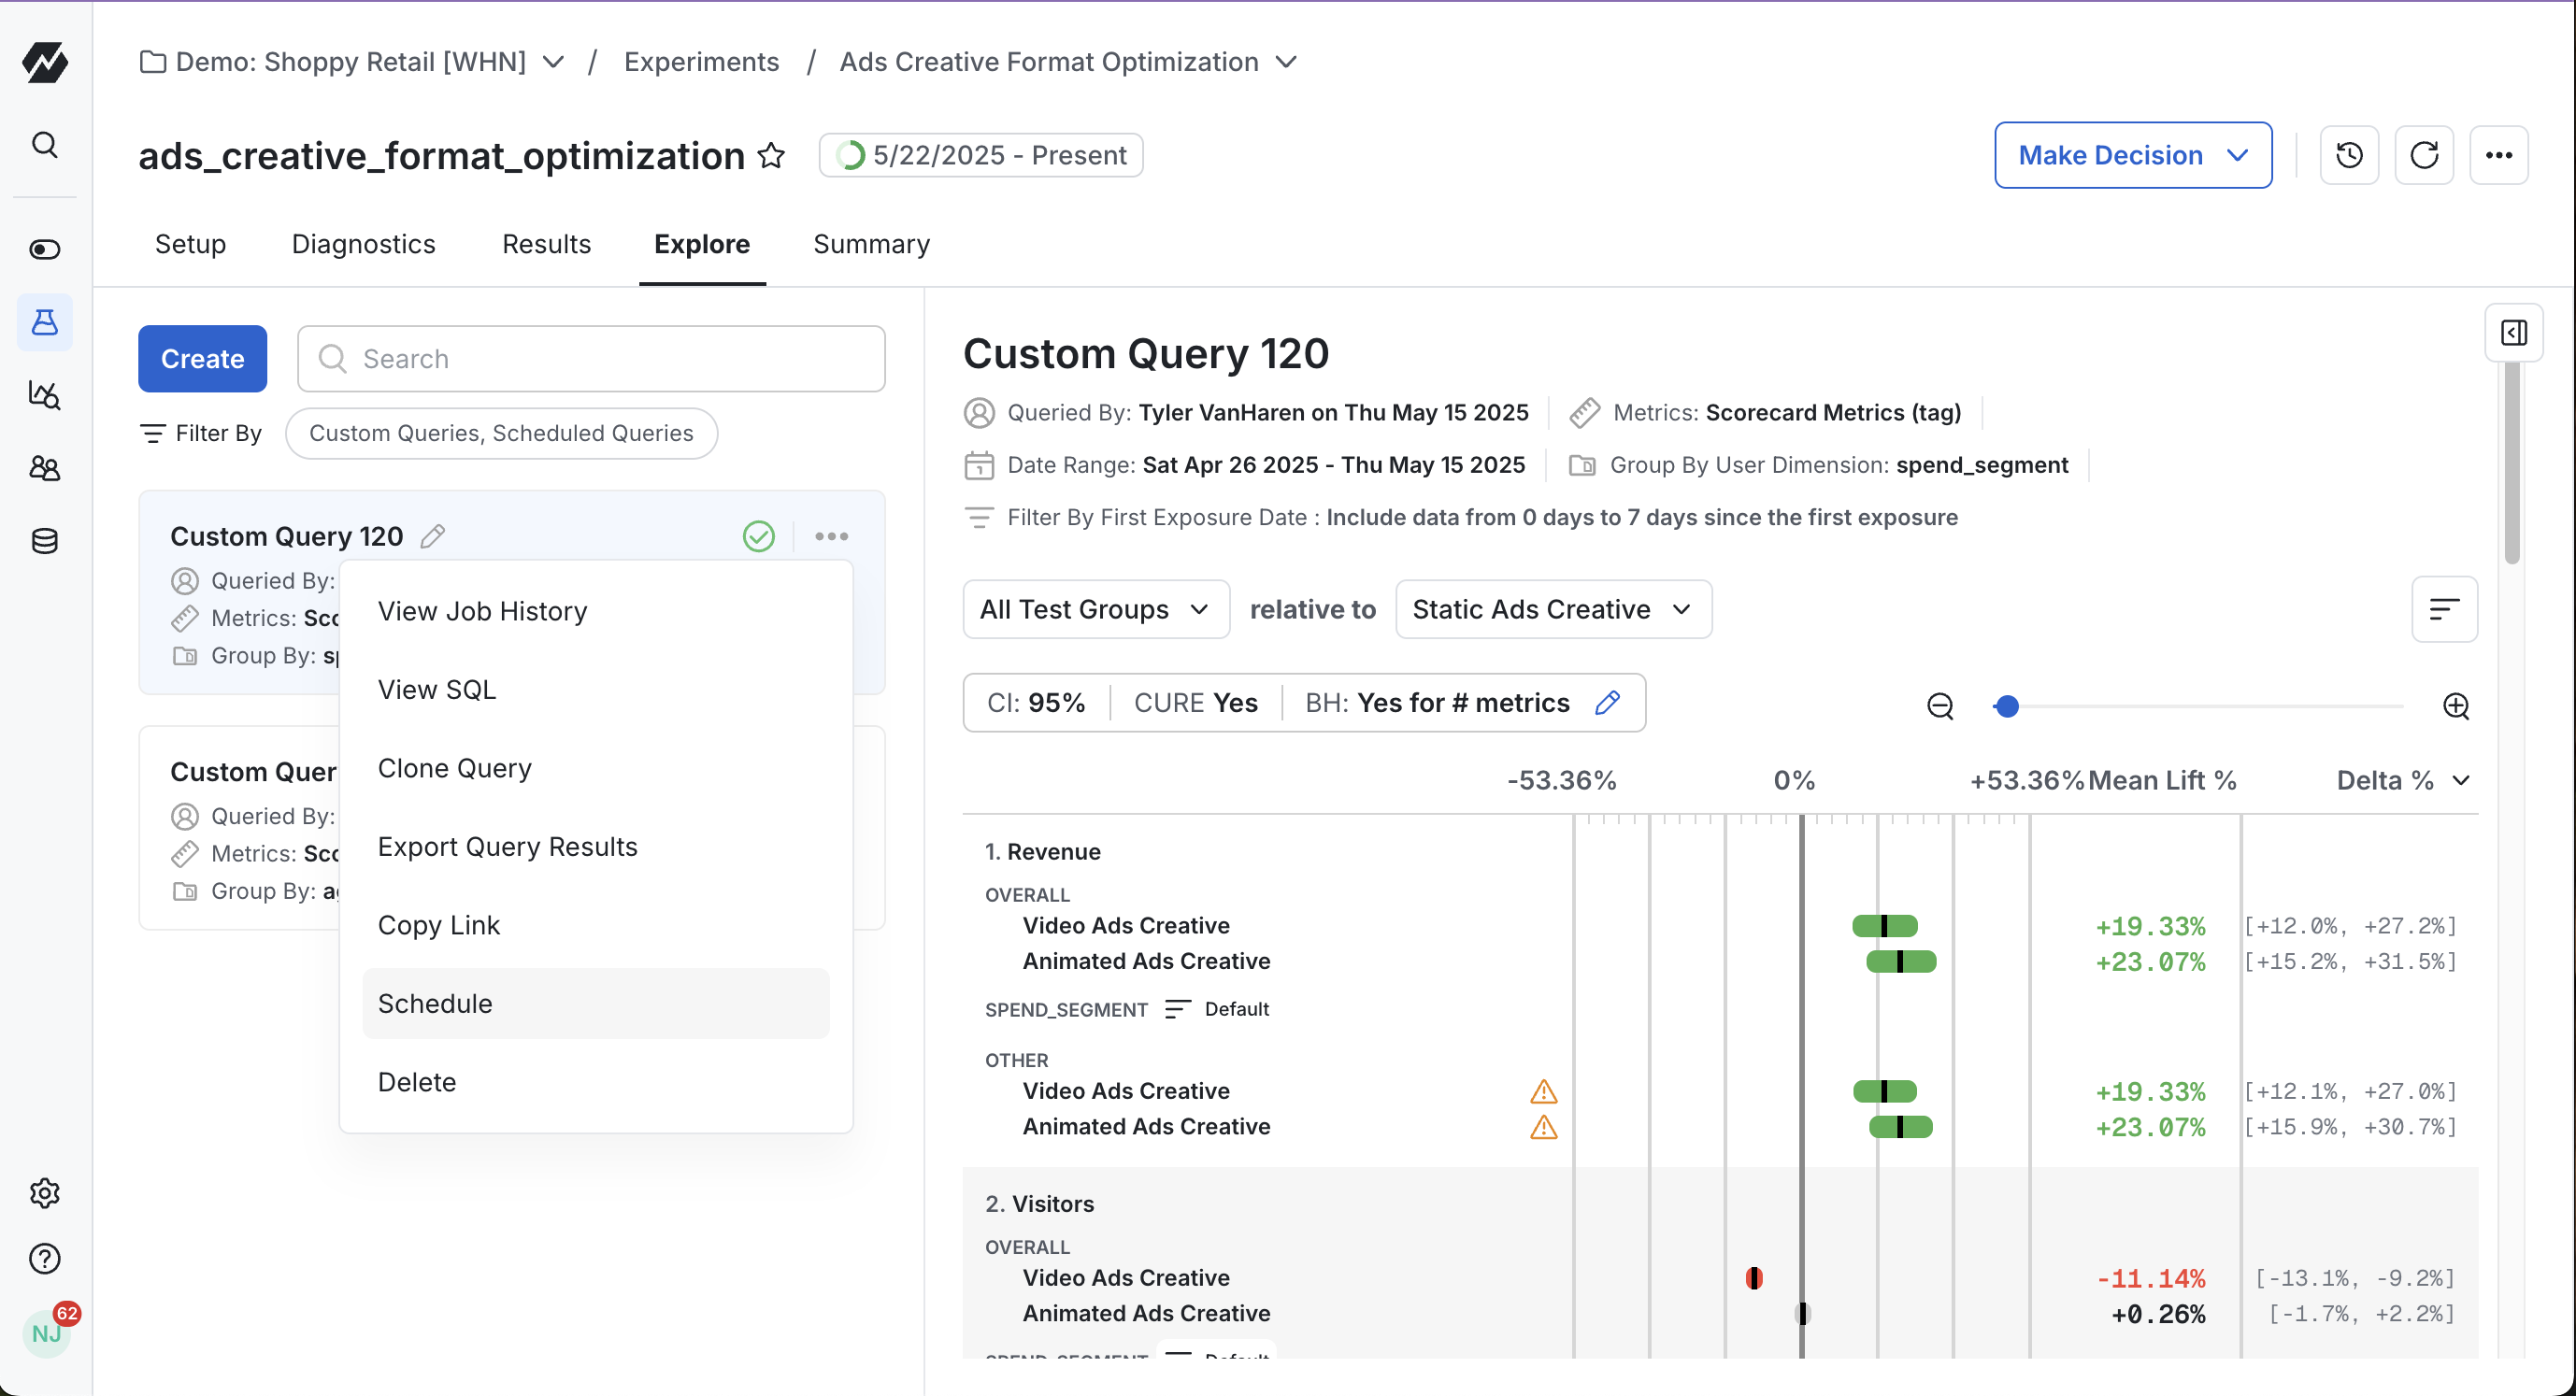
Viewing a custom query in Explore
These queries take a few minutes to run. Statsig sends an email when your results are ready. After the query completes, results are visible in the Query History section of the Explore interface. Statsig stores all historical queries across your team here. You can also give your query a display name inline for easier future identification.
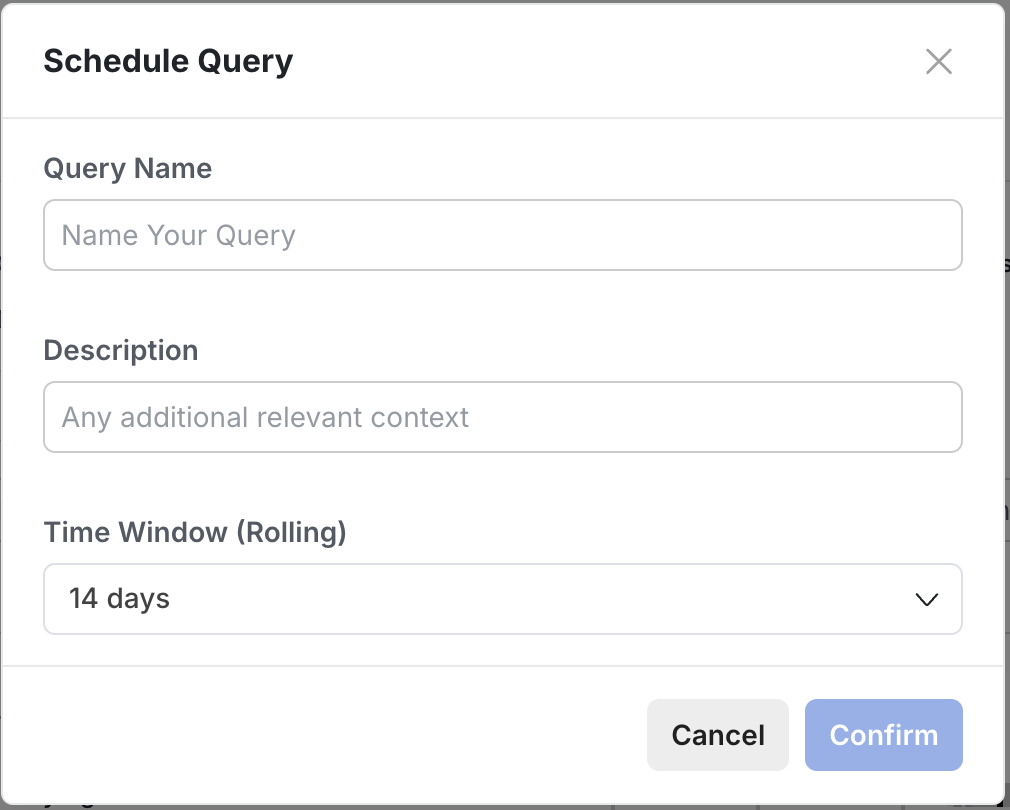
Scheduling a custom query
To get a daily refresh of a given Custom Query, schedule it directly from the Explore tab. Author the Custom Query you want to schedule, then tap the "..." menu, then Schedule. The Custom Query now runs daily and lives in the Scheduled tab of your Metric Lifts.
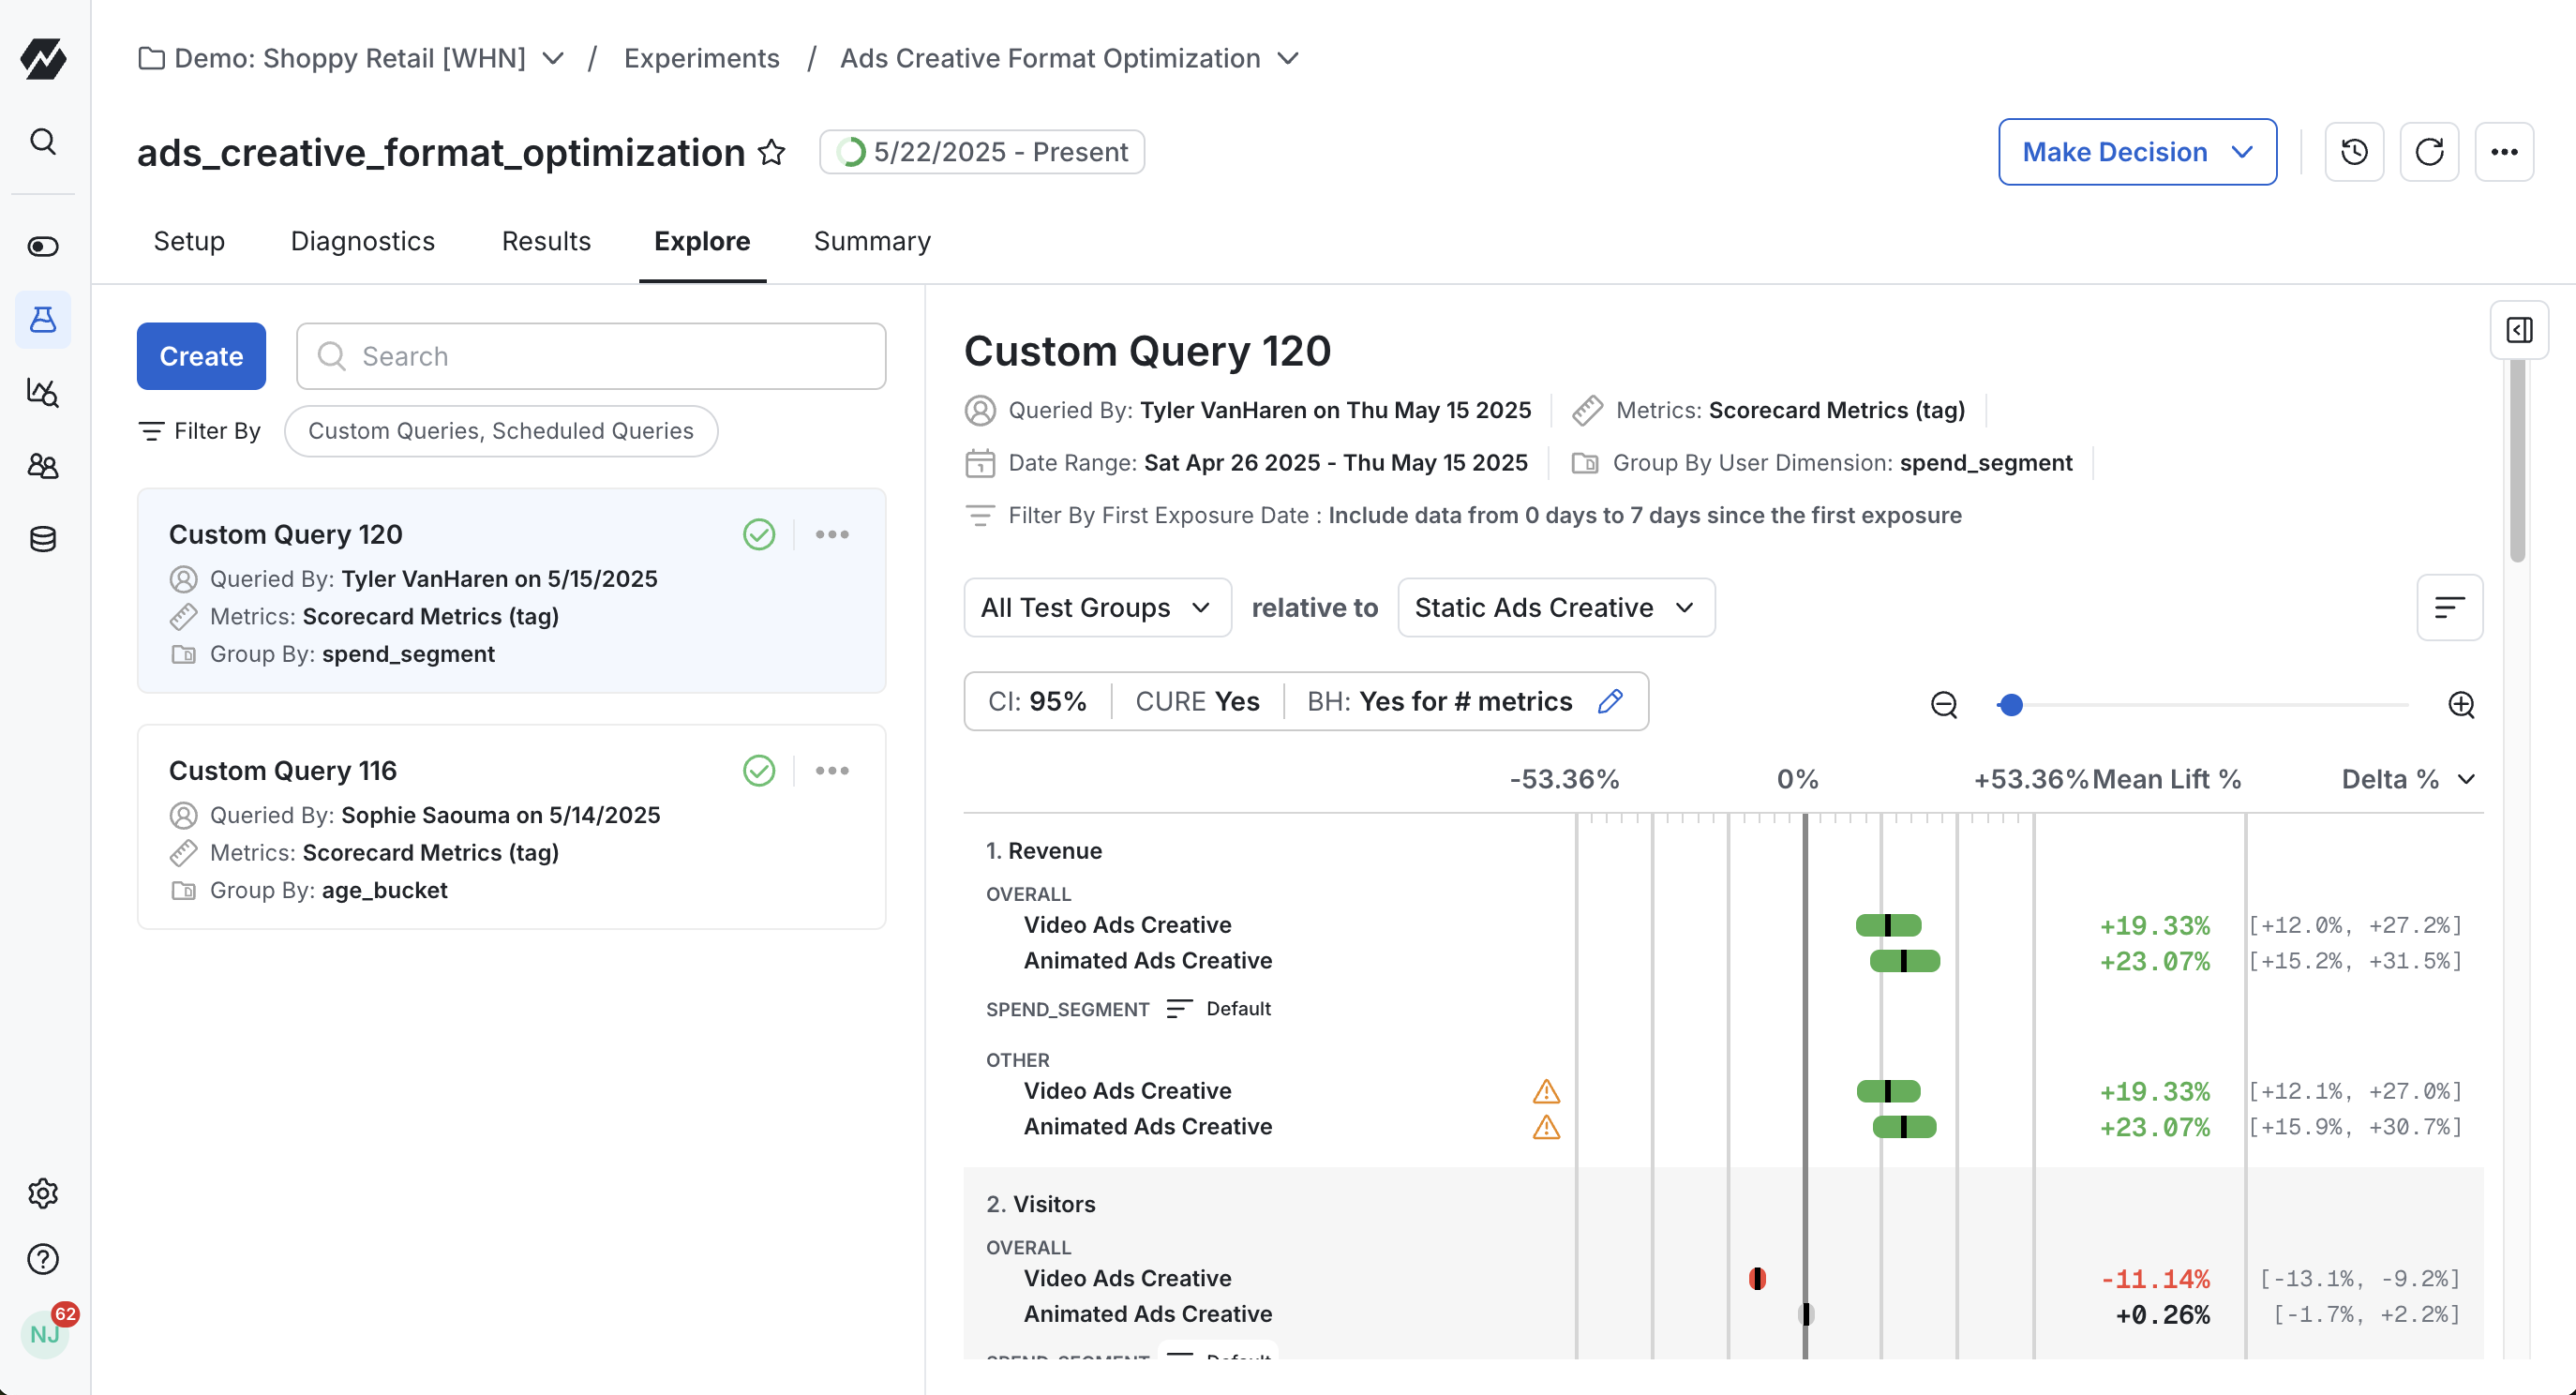
Reviewing custom query results
Custom query results look similar to the main Results tab because the statistical methods are the same. Statsig applies the same experimental analysis practices to custom analyses as to main Results.
The key difference is that a custom query result is a snapshot in time. After the query runs, Statsig saves the results, and they don't update if more metric data arrives. To update your results, run a new custom query or schedule custom queries to run at a regular cadence.
Sequential testing and custom queries
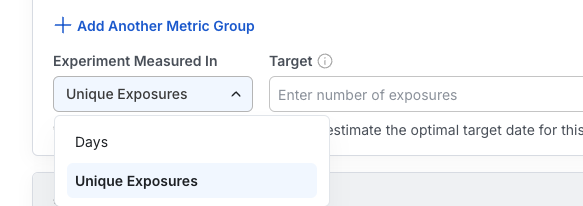
If you enable Sequential Testing for your experiment, you can apply it to your custom query results as well. Whether and how much to adjust confidence intervals and p-values depends on the standard rules of sequential testing. If your custom query doesn't satisfy the experiment's target Days or Unique Exposures from your setup, Statsig makes sequential testing adjustments to account for the under-powered state of the experiment.Because Statsig computes custom queries as a snapshot in time, it computes sequential testing adjustments for that specific analysis only. If you run additional custom queries with more or less data (for example, more days in the analysis or more unique users in the experiment), the sequential testing adjustments change accordingly. Custom queries that meet the configured minimum Days or Unique Exposures receive no sequential adjustments.
Was this helpful?