BigQuery (Deprecated)
Import event and metric data into Statsig from Google BigQuery on a schedule, including authentication, queries, and column-to-event mappings.
How BigQuery integration works
The BigQuery integration lets you export events and metrics from your BigQuery instance to Statsig. To enable the integration:
Set up tables in your BigQuery instance.
Grant Statsig's service account the required permissions on the tables.
Enable the BigQuery integration in the Statsig console.
Insert data into tables and mark data as ready for import.
Set up tables in your BigQuery instance
In your project, create a new dataset where tables for Statsig should live. You can use an existing dataset, but you'll be granting the Statsig service account permissions on that dataset later.
Create a table for pre-computed metrics, and another for signalling when data has landed with the statement below:
-- Replace statsig with your dataset name, if not using statsig
CREATE TABLE IF NOT EXISTS statsig.statsig_user_metrics(
  unit_id STRING NOT NULL,
  id_type STRING NOT NULL, -- stable_id, user_id, etc.
  date DATE NOT NULL, -- YYYY-MM-DD. Statsig calculates dates according to PST
  timeuuid STRING, --Generated unique UUID; we will generate if not provided
  metric_name STRING NOT NULL,
  metric_value NUMERIC,
  numerator NUMERIC,
  denominator NUMERIC
);

-- Replace statsig with your dataset name, if not using statsig
CREATE TABLE IF NOT EXISTS statsig.statsig_user_metrics_signal(
  finished_date DATE
);
Grant permissions to Statsig's service account
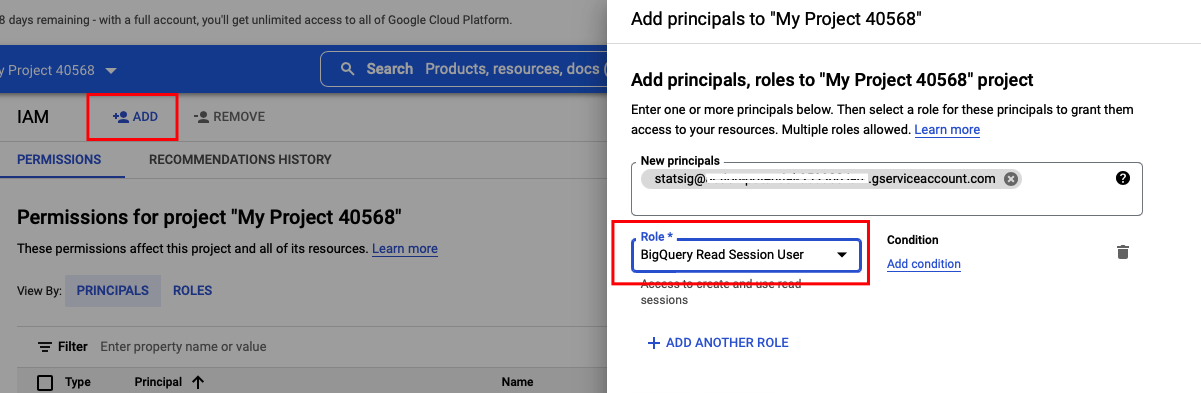
In your Statsig console, navigate to Project Settings > Integrations > BigQuery. Copy the Statsig service account shown there.
- In your BigQuery's IAM & Admin settings, add the Statsig service account as a new principal for your project and assign the "BigQuery Read Session User" role.
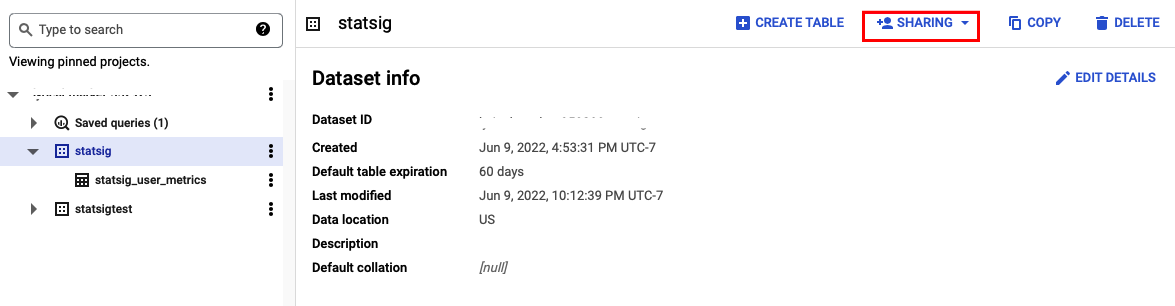
- Navigate to your BigQuery SQL Workspace, choose the dataset, and select "+ Sharing" -> "Permissions" -> "Add Principal" to assign the same Statsig service account the "BigQuery Data Viewer" role on the dataset.
Return to the BigQuery integration dialog in the Statsig console and enter your BigQuery project and dataset name. Select "Enable".
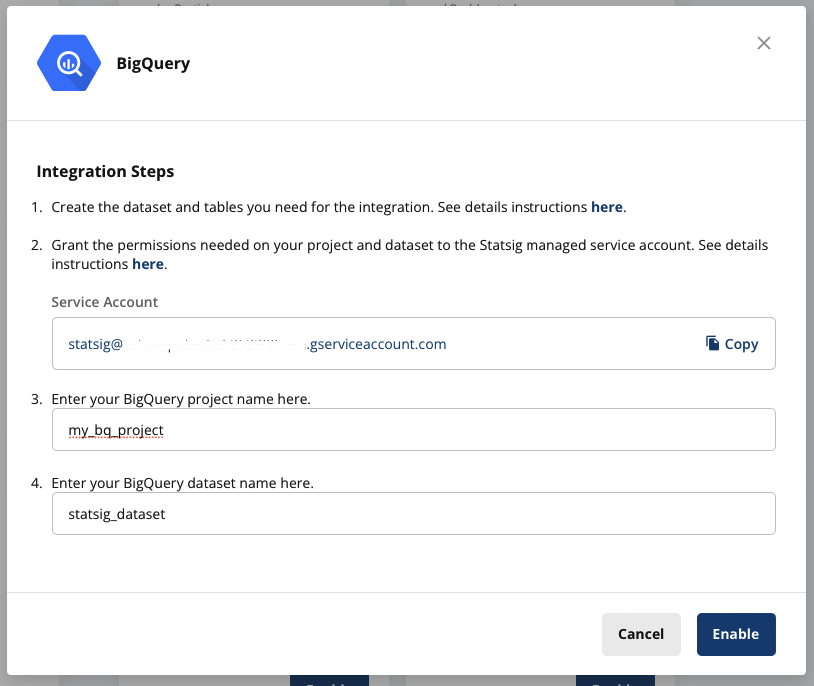
The service account now has the required permissions to read data from this dataset.
Insert data for import and signal when it is ready
To load data into Statsig, load data into statsig_user_metrics and then mark a day as completed in statsig_user_metrics_signal after all data for that day is loaded.
Your data must conform to these definitions and rules to avoid errors or delays:
| Column | Description | Rules |
|---|---|---|
| unit_id | The unique user identifier this metric is for. This might not necessarily be a user_id - it could be a custom_id of some kind | |
| id_type | The id_type the unit_id represents. | Must be a valid id_type. The default Statsig types are user_id/stable_id, but you may have generated custom id_types |
| date | Date of the daily metric | |
| timeuuid | A unique timeuuid for the event | This should be a timeuuid, but using a unique id will suffice. If not provided, the table defaults to generating a UUID. |
| metric_name | The name of the metric | Not null. Length < 128 characters |
| metric_value | A numeric value for the metric | Metric value, or both of numerator/denominator need to be provided for Statsig to process the metric. See details below |
| numerator | Numerator for metric calculation | See above, and details below |
| denominator | Denominator for metric calculation | See above, and details below |
Metric ingestion is for user-day metric pairs. This is useful for measuring experimental results on complex business logic (for example, LTV estimates) that you generate in your data warehouse.
Note on metric values
If you provide both a numerator and denominator value for any record of a metric, Statsig treats the metric as a ratio metric, filters out users who don't have a denominator value from analysis, and recalculates the metric value using the numerator and denominator fields.
If you provide only a metric_value, Statsig uses the metric_value for analysis and imputes 0 for users without a metric value in experiments.
Scheduling
Because you may be streaming events to your tables or have multiple ETLs pointing to your metrics table, Statsig relies on you to signal that your metric/events for a given day are done.
After a day is fully loaded, insert that date as a row in the appropriate signal table: statsig_user_metrics_signal for metrics or statsig_events_signal for events. For example, after all metrics data is loaded into statsig_user_metrics for 2022-04-01, insert 2022-04-01 into statsig_user_metrics_signal.
Statsig expects you to load data in order. For example, if you've loaded up to 2022-04-01 and signal that 2022-04-03 has landed, Statsig waits for you to signal that 2022-04-02 has landed, then loads that data before ingesting data from 2022-04-03.
This ingestion pipeline is in beta and doesn't currently support automatic backfills or updates to data after Statsig ingests it. Only signal these tables are loaded after you've run data quality checks.
Checklist
Check these common errors before going live:
- The
id_typeis set correctly.- Default types are
user_idorstable_id. If you have custom ids, confirm that capitalization and spelling match, because these values are case sensitive (you can find your custom ID types in Project Settings in the Statsig console).
- Default types are
- Your ids match the format of ids logged from SDKs.
- In some cases, your data warehouse may transform IDs. Transformed IDs can prevent Statsig from joining your experiment or feature gate data to your metrics to calculate pulse or other reports. Go to the Metrics page of your project and view the log stream to check the format of the ids being sent (either
User ID, or a custom ID inUser Properties) to confirm they match.
- In some cases, your data warehouse may transform IDs. Transformed IDs can prevent Statsig from joining your experiment or feature gate data to your metrics to calculate pulse or other reports. Go to the Metrics page of your project and view the log stream to check the format of the ids being sent (either
If your data isn't showing up in the Statsig console:
- Monitoring is limited, but you can check your BigQuery query history for the Statsig user to understand which data Statsig is pulling, and whether queries aren't executing (no history) or are failing.
- You should see polling queries within a few hours of setting up your integration.
- If you have a signal date in the last 28 days, you should see a select statement for data from the earliest signal date in that window.
- If that query fails, try running it yourself to identify whether there is a schema issue.
- If data is loading, Statsig is likely still processing. For new metrics, allow a day to process. If data hasn't loaded after a day or two, contact Statsig support. The most common reason for metrics catalog failures is
id_typemismatches.
Verify data appears in Statsig
After setup is complete, your data starts flowing into Statsig's metrics tab and experiment results, and appears in your console by around noon the next day (PST). If you chose an early first date, this may take longer because Statsig loads historical data sequentially.
Contact Statsig on Slack if you have any questions or need help verifying your setup.Was this helpful?