Data Warehouse Exports
Export Statsig events, exposures, and metric data into your cloud data warehouse on a schedule for downstream BI, modeling, and custom analysis.
How data warehouse exports work
You can export your data from Statsig to your data warehouse using a data connection. The data connection lets you send exposures and events directly to your warehouse for further analysis. Statsig supports connections to Snowflake, Redshift, S3, BigQuery, and Databricks.
Set up a data warehouse export
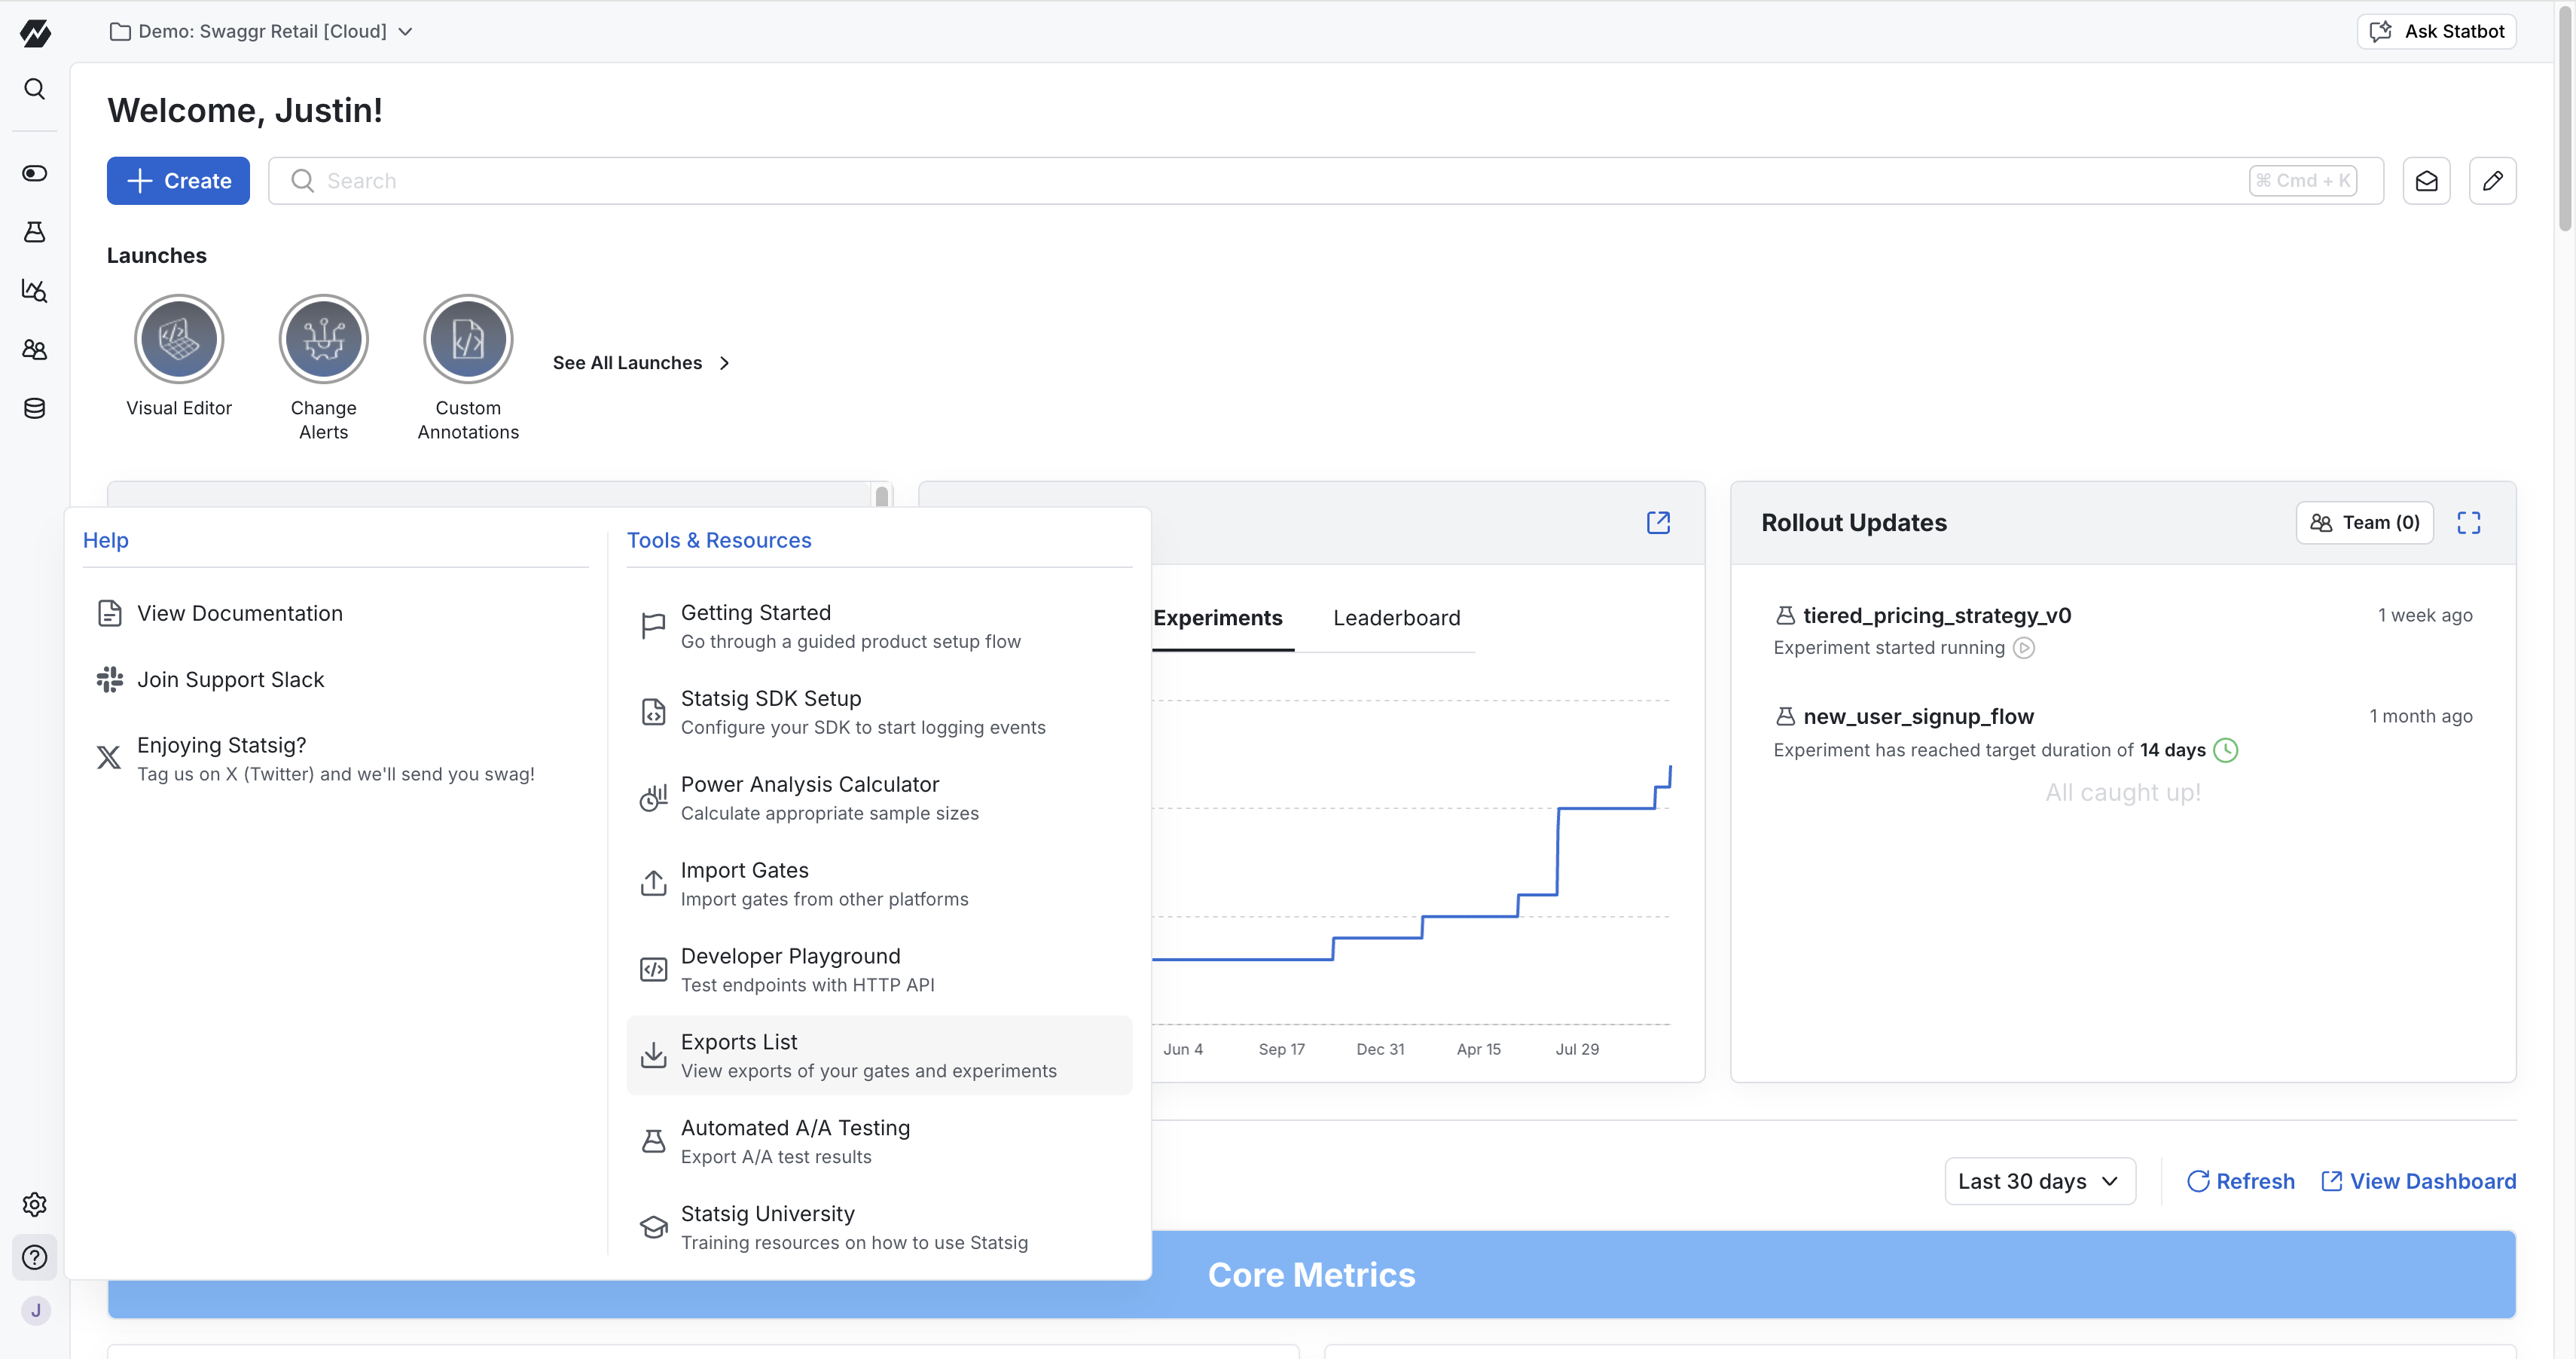
- Go to Statsig Console.
- Navigate to the Help and Tools Section on the side navigation bar.
- Go to "Exports List".
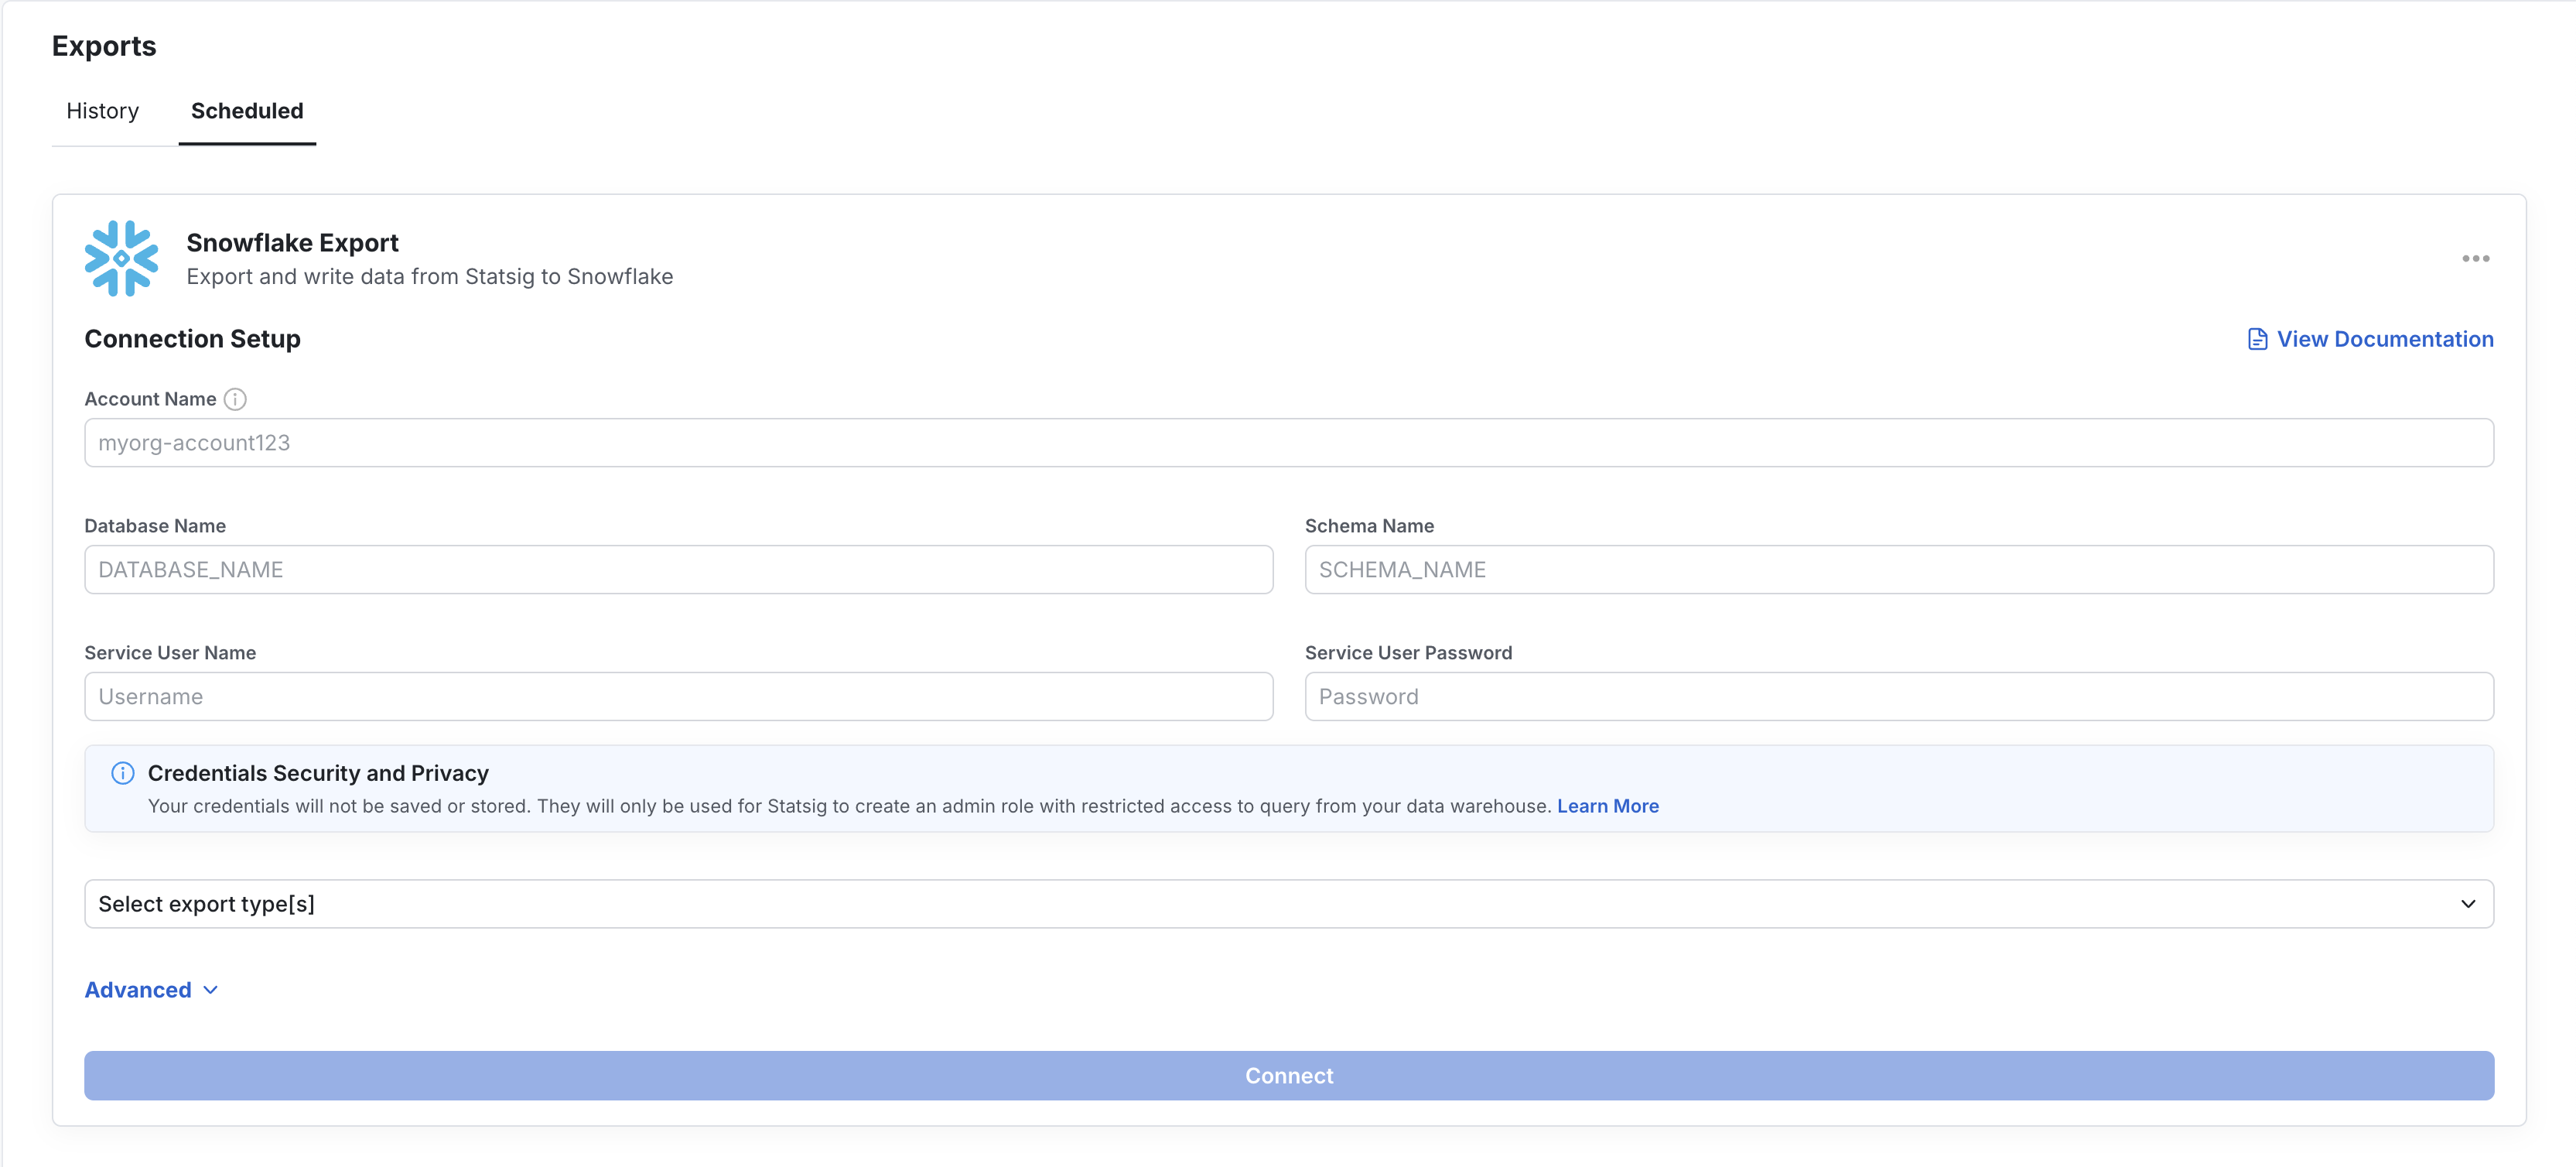
Under the Scheduled Export tab, set up a data warehouse connection. Configure the connection with the necessary credentials and grant Statsig Read, Write, and Delete permissions. The warehouse-specific tabs below show the fields Statsig requires and example SQL you can use to create each export table yourself.
Export table schema
Statsig can export both Exposures and Events to your destination. The exported columns are logically the same across SQL warehouses, but the physical types vary by warehouse. S3 is a file destination rather than a SQL table destination.
Setup summary
Configure:
- BigQuery Project ID
- BigQuery Dataset ID
- one destination table name per export type
Permissions:
- Grant the Statsig service account
BigQuery Userat the project level. - Grant the same service account
BigQuery Data Editoron the target dataset.
Statsig uses this access to create the table if needed and validate the connection by inserting and deleting a test row.
If you prefer to create the export tables yourself, you can use SQL like this:
CREATE TABLE IF NOT EXISTS `PROJECT_ID.DATASET_ID.EXPOSURES_TABLE` (
  company_id STRING,
  unit_id STRING,
  unit_type STRING,
  exposure_type STRING,
  name STRING,
  rule STRING,
  experiment_group STRING,
  first_exposure_utc TIMESTAMP,
  first_exposure_pst_date DATE,
  as_of_pst_date DATE,
  percent FLOAT64,
  rollout BIGINT,
  user_dimensions STRING,
  inserted_at TIMESTAMP,
  rule_name STRING,
  group_id STRING,
  non_analytics BOOLEAN
);
CREATE TABLE IF NOT EXISTS `PROJECT_ID.DATASET_ID.EVENTS_TABLE` (
  user_id STRING,
  stable_id STRING,
  custom_ids JSON,
  timestamp TIMESTAMP,
  event_name STRING,
  event_value STRING,
  user_object JSON,
  statsig_metadata JSON,
  company_metadata JSON
);
Exposures
Statsig doesn't export exposures from rules that are 0%/100%.
| Field name | Type | Mode |
|---|---|---|
| company_id | STRING | NULLABLE |
| unit_id | STRING | NULLABLE |
| unit_type | STRING | NULLABLE |
| exposure_type | STRING | NULLABLE |
| name | STRING | NULLABLE |
| rule | STRING | NULLABLE |
| experiment_group | STRING | NULLABLE |
| first_exposure_utc | TIMESTAMP | NULLABLE |
| first_exposure_pst_date | DATE | NULLABLE |
| as_of_pst_date | DATE | NULLABLE |
| percent | FLOAT64 | NULLABLE |
| rollout | BIGINT | NULLABLE |
| user_dimensions | STRING | NULLABLE |
| inserted_at | TIMESTAMP | NULLABLE |
| rule_name | STRING | NULLABLE |
| group_id | STRING | NULLABLE |
| non_analytics | BOOLEAN | NULLABLE |
Events
| Field name | Type | Mode |
|---|---|---|
| user_id | STRING | NULLABLE |
| stable_id | STRING | NULLABLE |
| custom_ids | JSON | NULLABLE |
| timestamp | TIMESTAMP | NULLABLE |
| event_name | STRING | NULLABLE |
| event_value | STRING | NULLABLE |
| user_object | JSON | NULLABLE |
| statsig_metadata | JSON | NULLABLE |
| company_metadata | JSON | NULLABLE |
Troubleshoot exports
Statsig can notify you if your data connection is failing. To enable notifications, go to Settings > My Account > Email Notifications > Edit and select Alerts to subscribe.
If your exports are failing, confirm your warehouse is connected with up-to-date credentials and the necessary Read, Write, and Delete permissions.
Was this helpful?