For AI agents: a documentation index is available at /llms.txt. Append .md to any page URL for markdown, or send Accept: text/markdown.
Interaction Detection
Learn how to detect interactions between overlapping experiments and understand their impact.
Interaction Detection measures whether two overlapping experiments change each other's effect on a metric. It compares experiment B's lift among users in experiment A's test group with B's lift among users in A's control group. A statistically significant difference between those two lifts is the interaction effect. Run Interaction Detection when two experiments share traffic and you want to know whether rolling out both produces the sum of their individual effects. To prevent overlap instead of measuring it, put the experiments in the same Layer.
When overlapping experiments need interaction detection
Statsig recommends running overlapping experiments. Users viewing your landing page may experience multiple experiments at the same time. Running overlapping experiments is supported by industry experience and published research. If you expect two experiments to conflict, make them mutually exclusive with Layers (also called Universes) instead of running them together.
How to use interaction detection
To start an Interaction Detection analysis, go to Experiment > Results > Explore > Interaction Effect Detection.
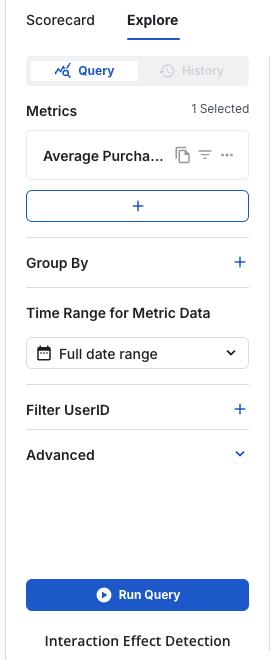
Select a second experiment and the metrics to analyze. Statsig shows a summary with three sections:
- By Groups: unit counts for each combination of group assignments across the two experiments.
- Metric Summary Results: estimated intervals of the difference in metric lift.
- Overlapping Unique Users: an overview of the traffic intersection between the two experiments.
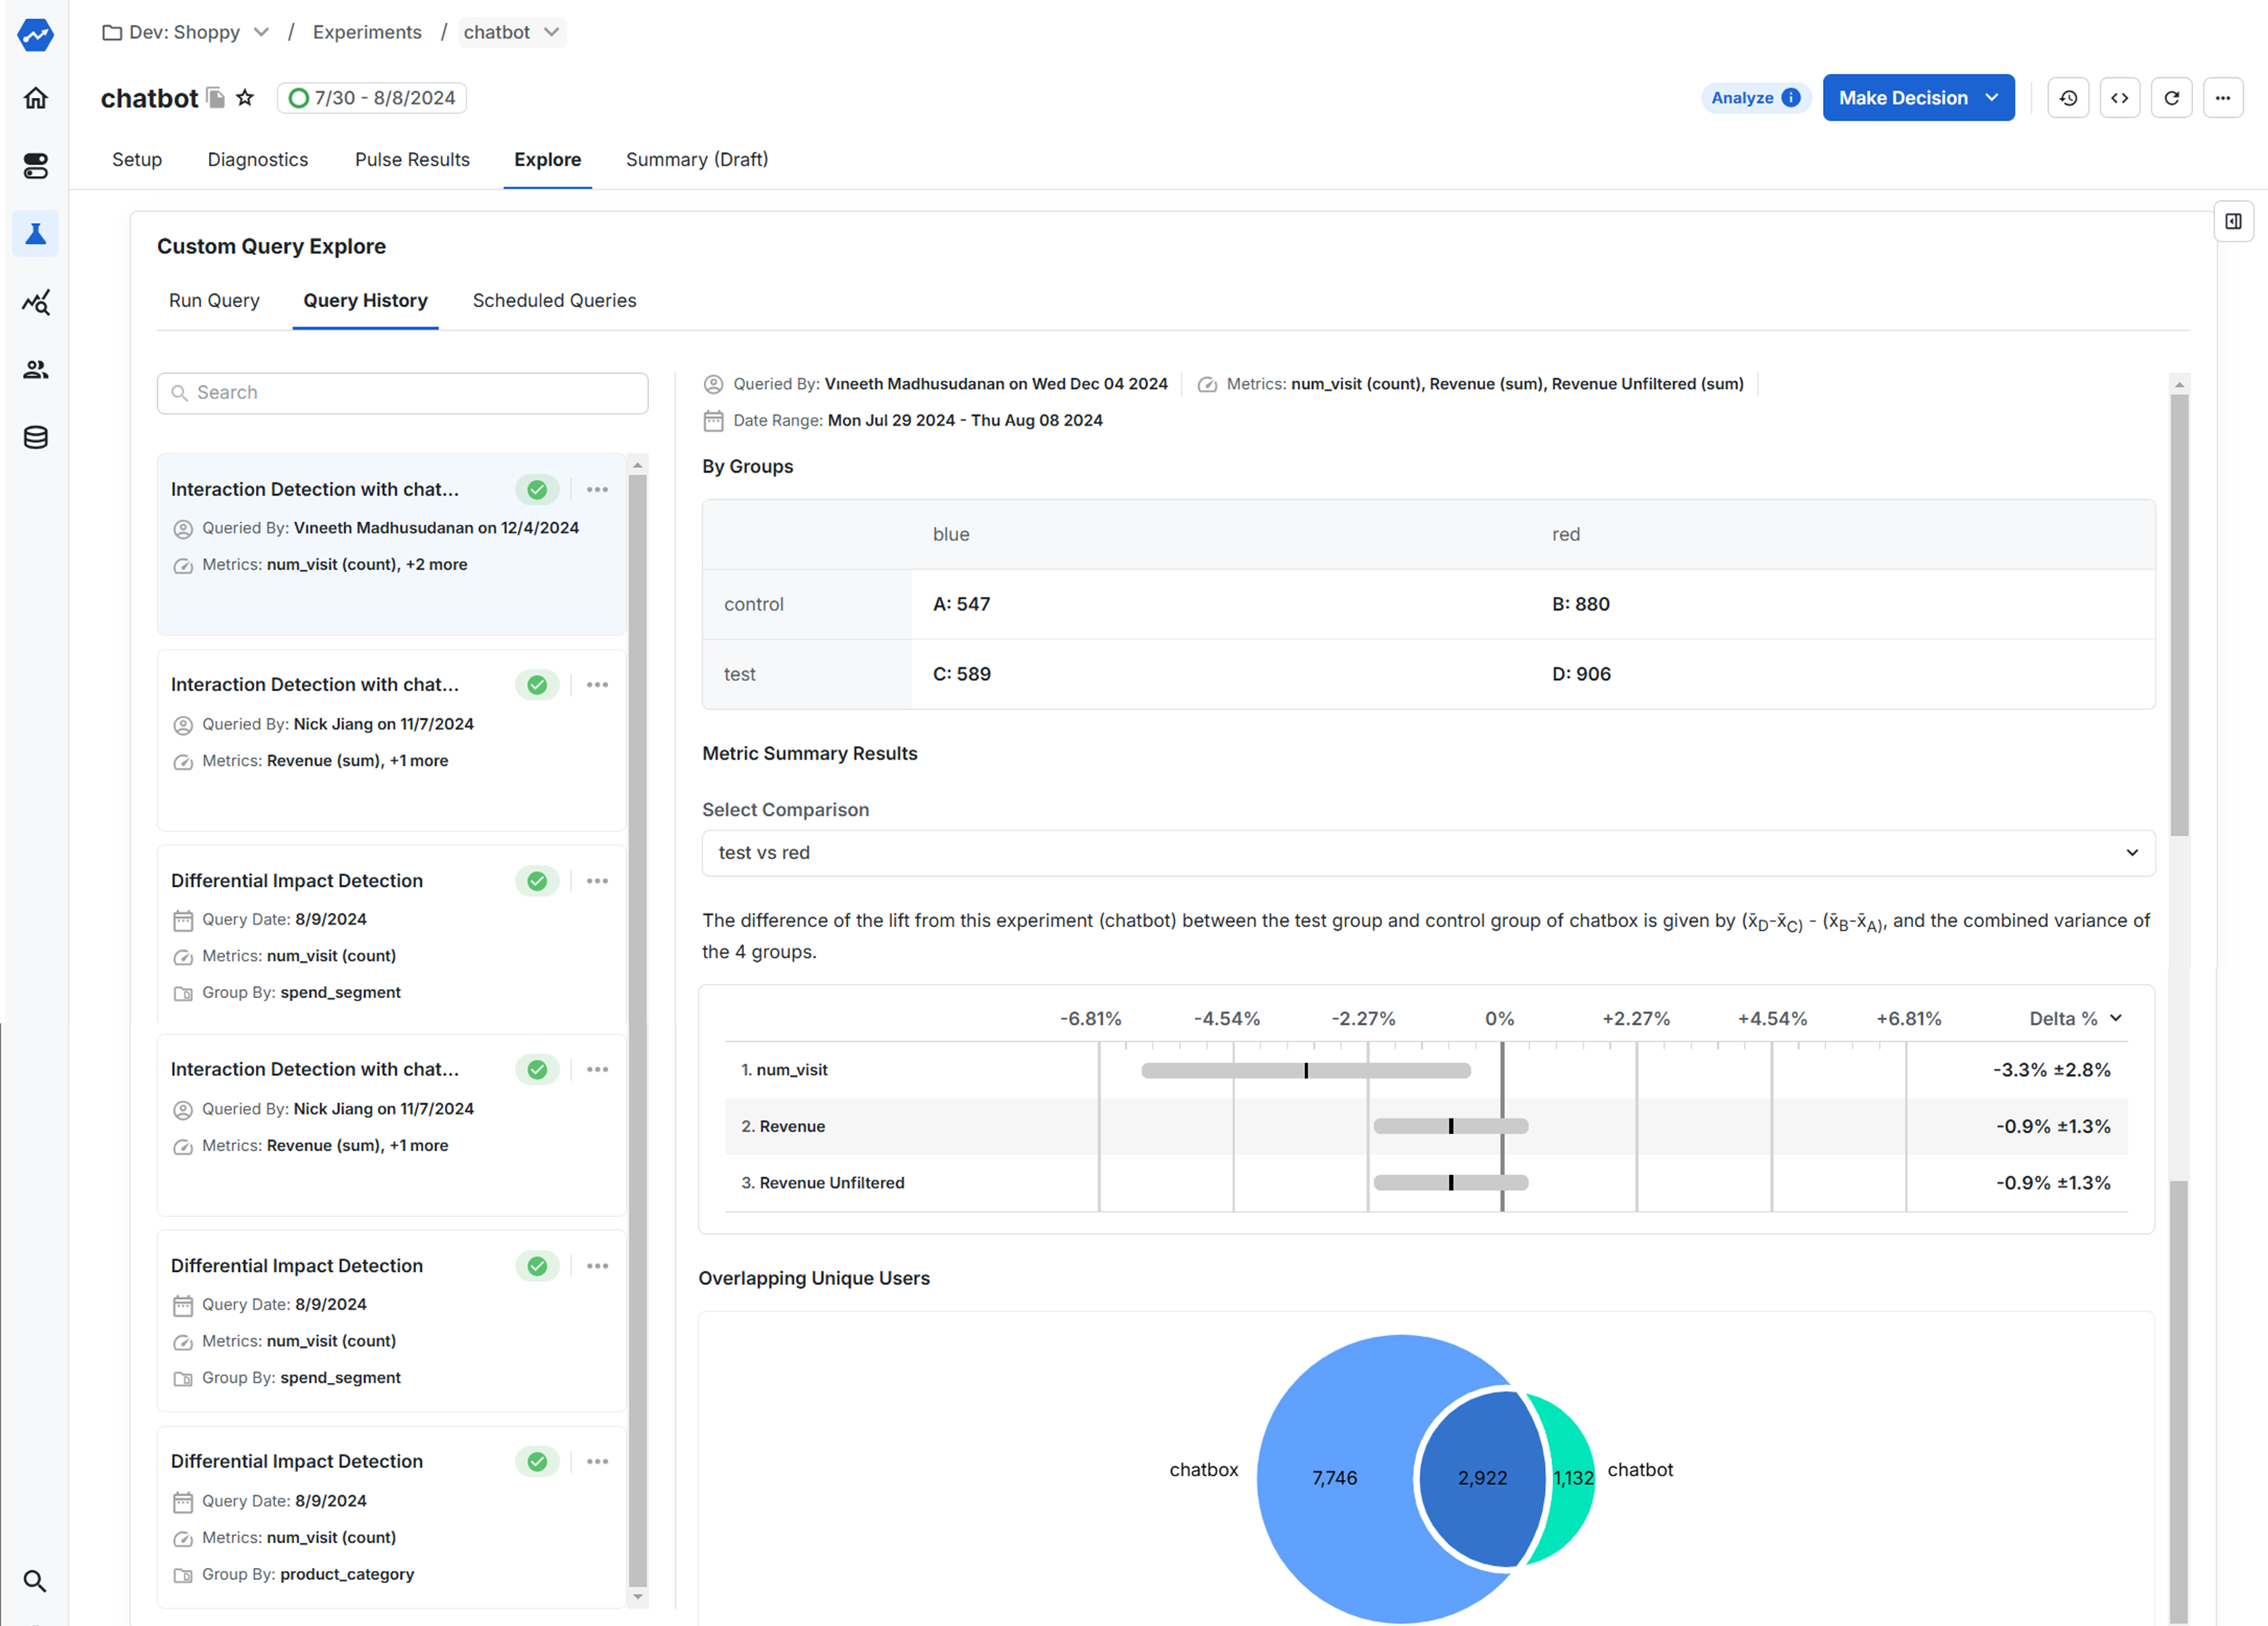
For more examples, refer to the Statsig blog post Interaction effect detection.
Methodology
Assume two experiments, A and B, each with a control group and a test group. The interaction effect measures the overlapping impact on users exposed to both experiment A and experiment B.
Intuition
- The term answers: "If a user is in A's test group, how much does changing B from control to test change the metric?"
- The term answers: "If a user is in A's control group, how much does changing B from control to test change the metric?"
- The difference between those two values shows whether the effect of B depends on whether the user is in A's test or control group. That difference is the interaction effect.
If the result isn't statistically significant, the effect of B is the same regardless of which group the user is in for A (no significant interaction). If it's statistically significant, the effect of B depends on A's assignment (significant interaction).
Directionality
The sign of the interaction effect (positive or negative) indicates whether the two treatments amplify or dampen each other's effects.
- Statistically positive interaction: B's effect is stronger when A is also active.
- Statistically negative interaction: B's effect is weaker, or reversed, when A is active.
Magnitude
The magnitude (absolute size) of the interaction effect indicates how much the combined impact deviates from simple additivity.
For example:
- Experiment A produces a +5% lift on your metric of interest.
- Experiment B produces a +5% lift on the same metric.
- The interaction effect between A and B is –3%.
The –3% interaction effect means that rolling out both experiments together produces an overall impact about 3% lower than the sum of their individual effects. The features interfere with each other.
To get the most accurate estimate of the true combined impact, run a new experiment that includes both features together. Experiments A and B may not have run over the same time period or under identical conditions, and these differences in timing and seasonality can influence the measured interaction magnitude.
When an experiment includes more than two groups, Statsig evaluates interaction effects pairwise between groups. To view the interaction effect for specific group combinations, select the groups in the Select Comparison dropdown in the Interaction Effect Detection results.
Was this helpful?