Autotune
Monitor Statsig Autotune experiments to track variant performance, reward signals, exploration rate, and traffic allocation over time.
How to monitor your Autotune test
Computations and traffic allocation
The results tab within Autotune provides a view of your ongoing and completed Autotune tests. Statsig computes Autotune hourly, with metrics and traffic allocation updated throughout the day. Statsig ingests results from exposures after the attribution window is complete. For example, an exposure at 1pm with a 6-hour attribution window isn't counted until 7pm.
Result
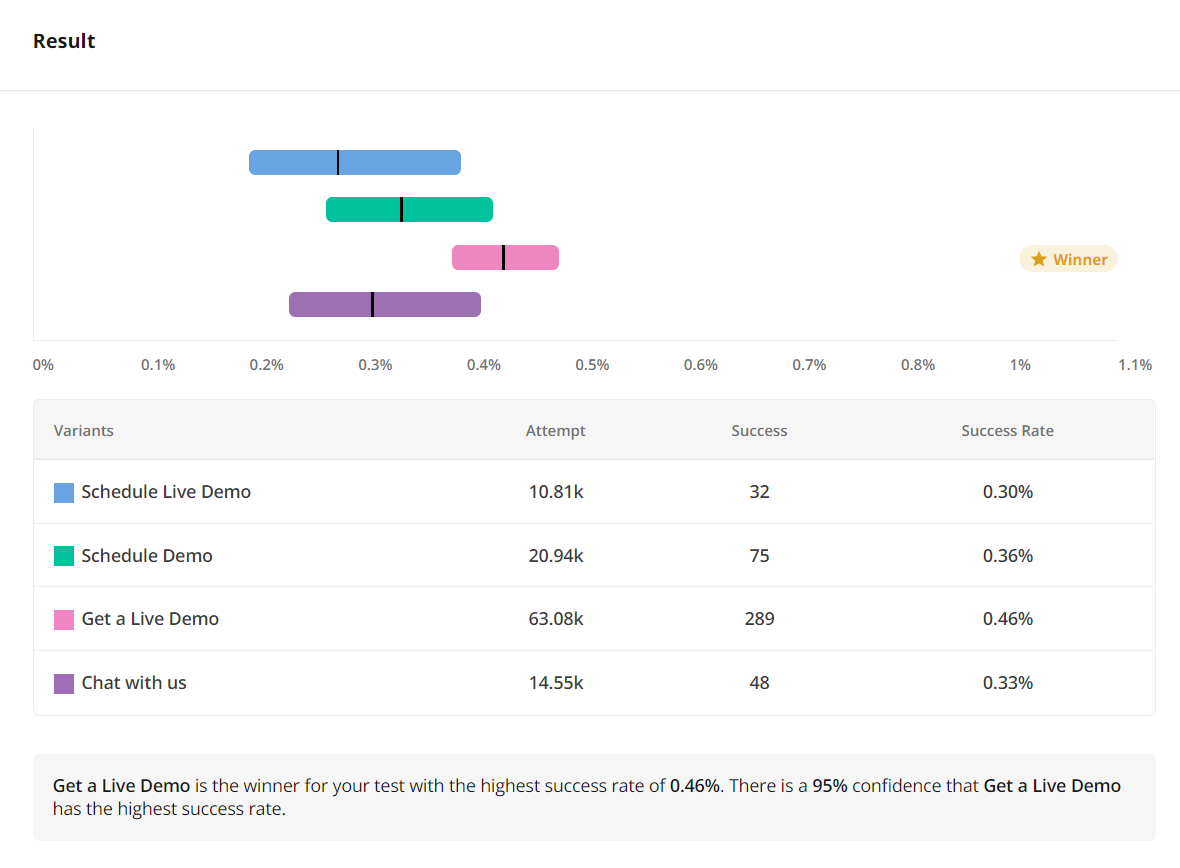
This section shows a summary of your Autotune test. The top bars show a 95% Bayesian Credible interval for the estimated conversion rate (exposure to success event). There's a 95% chance that the real value is within this interval. The table shows the number of exposures, success events, and overall success rate for each variation across the duration of the test, along with a plain-language description of the current test state.
Details
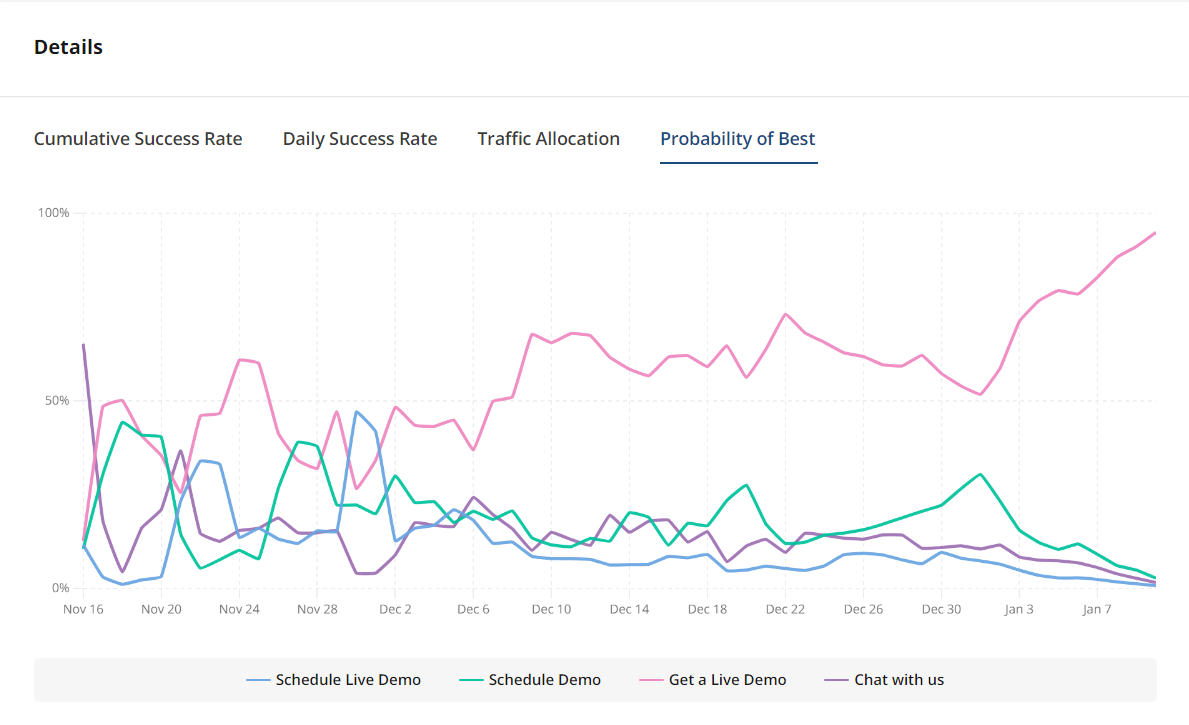
There are several charts provided:
- Probability of Best - shows the progress of the Autotune test, and which variant is currently winning.
- Cumulative success rate - shows the overall success rate (exposure -> success) to date.
- Daily success rate - shows the success rate for each variation per day.
- Traffic allocation - shows the daily number of exposures allocated to each variation on a given day.
Linked experiments
The most reliable way to evaluate whether a bandit is working is to measure whether it drives more of the targeted behavior compared to a baseline experience. You can set up and link an A/B test in Statsig to evaluate this, which also lets you monitor other user behaviors and guardrail metrics.
This is the gold standard of measurement and is highly encouraged.
Standard practice is to wrap the autotune in an experiment with a binary parameter, either as 50/50 or a 90/10 holdback. You can link the experiment to the autotune to get the results on the autotune page. In code, this might look like:
experiment_value = statsig.get_experiment('wrapping_experiment').get('flag')
default_param = '..."
if(experiment_value):
  param = statsig.get_experiment('autotune').get('param_name')
else:
  param = default_param

# use param in code
You would start this experiment at the same time that you launch your autotune.
Was this helpful?