Log your first custom event
How to log custom events to Statsig from client and server SDKs, including event names, values, and metadata used for metrics and analytics.
Statsig provides several ways to get started:
- Statsig web SDKs offer autocaptured web analytics to automatically log common events like pageviews, clicks, and more.
- Statsig offers integrations to connect your existing event data in Segment, mParticle, and other sources.
- All Statsig client and server SDKs provide a simple
logEventAPI to instrument your own events in your app or webserver.
For general guidance on event logging and core concepts, read on or navigate to the "Logging events via SDKs" section below.
Identifying users with the StatsigUser object
Many analytics platforms have a concept of "identifying" a user. In Statsig, this is the StatsigUser object, which is set at initialization time in client SDKs, or with each event in server SDKs.
StatsigUser is a set of properties that describe the user. The JSON definition is consistent across all SDKs and integrations:{
"userID": "123",
"customIDs": {},
"email": "user@example.com",
"ip": "192.168.1.1",
"userAgent": "Mozilla/5.0...",
"country": "US",
"locale": "en-US",
"appVersion": "1.0.0",
"custom": {},
"privateAttributes": []
}
The userID field is reserved for a unique identifier for the user. Use the ID of the logged-in user.
customIDs are explained in the "Group Analytics" section below.
The other fields support targeting and evaluation for feature flags, and can also be used for custom metrics and data queries in Metrics Explorer.
Group analytics
Another core concept in analytics is grouping. A user can belong to a company, organization, page, or other entity.
In Statsig, groups are represented by the customIDs field, a dictionary that can contain multiple IDs for a single user. For example, a user can have the following customIDs:
{
  "userID": "123",
  "customIDs": {
    "companyID": "456",
    "projectID": "abc"
  }
}
Statsig computes all metrics at the user level and also for each custom identifier. This means you can run experiments at a company level, where all users in a company receive the same experience, and compare the impact on company-level metrics.
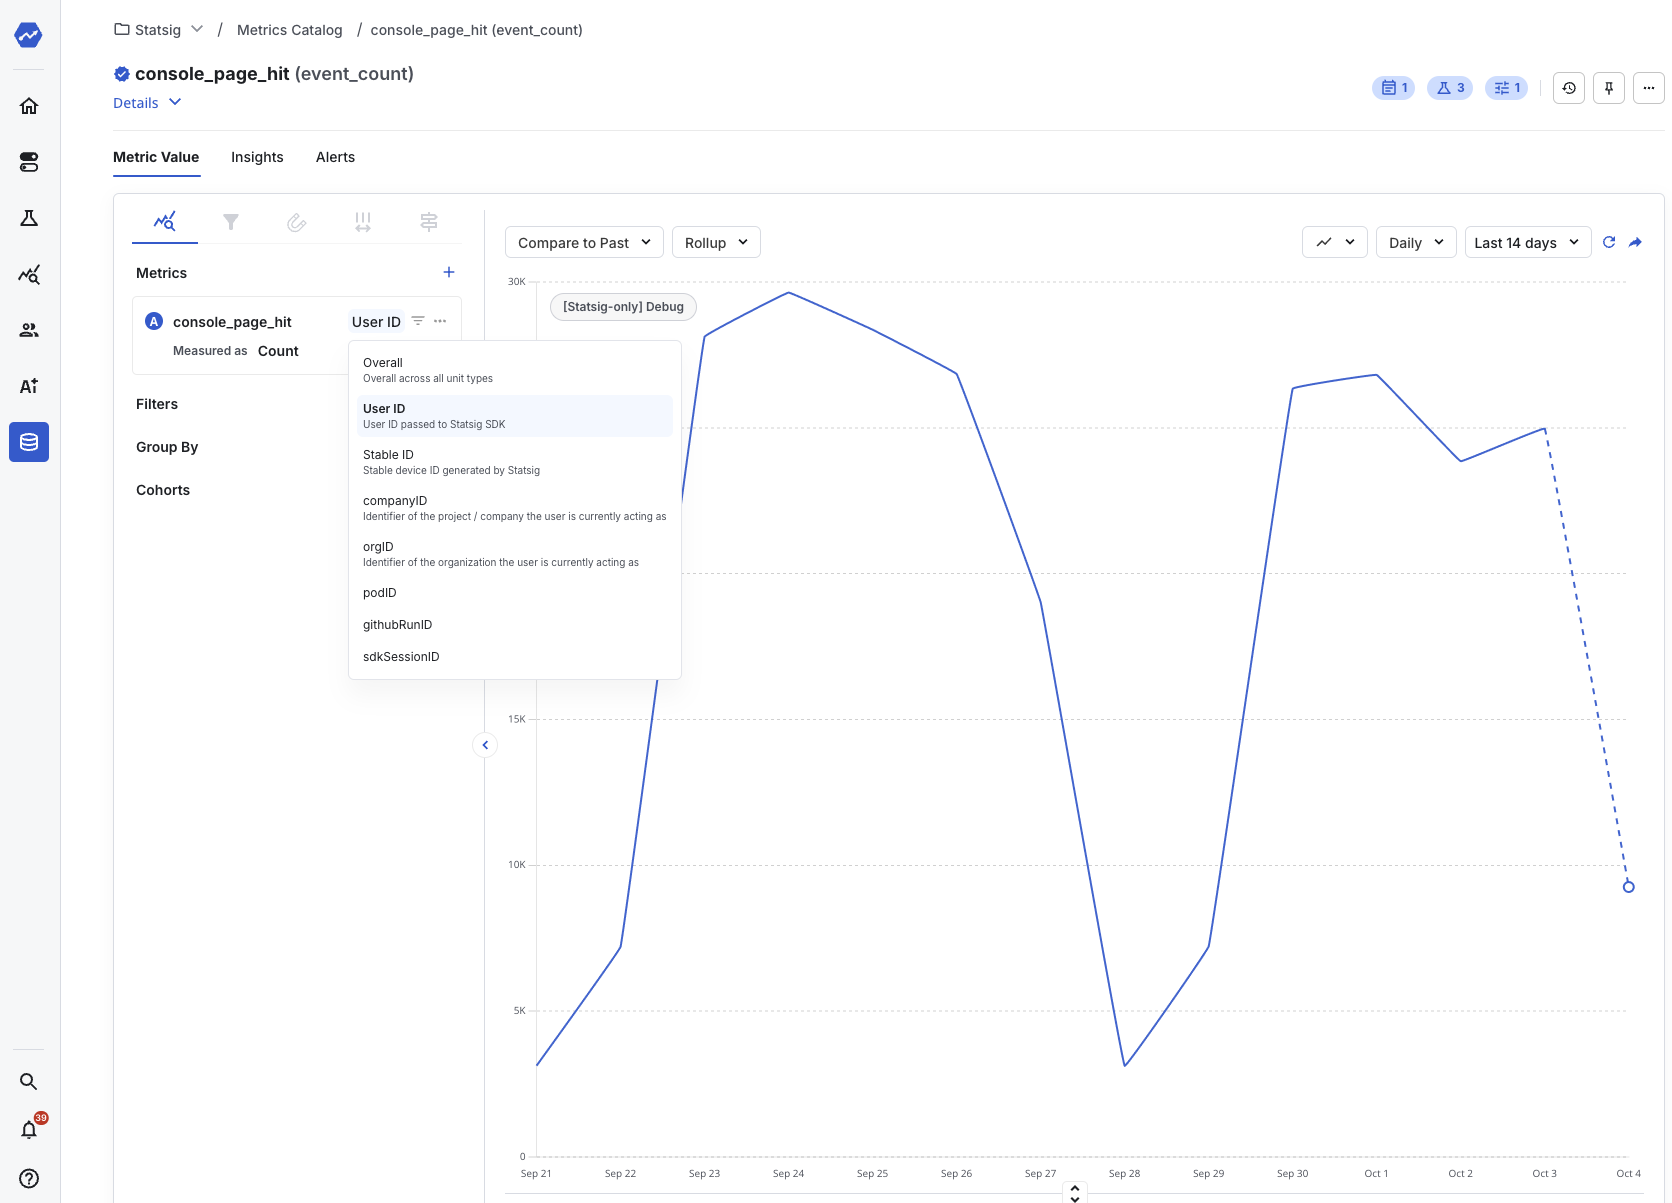
You can also use Metrics Explorer to slice metrics at the company level rather than the user level, if you have configured a customID for it. For example, the Statsig project can display console page views at a user or company level:
To set up a new "group" or "customID":
- Go to your project settings
- Locate the "Custom IDs" section and hit "edit"
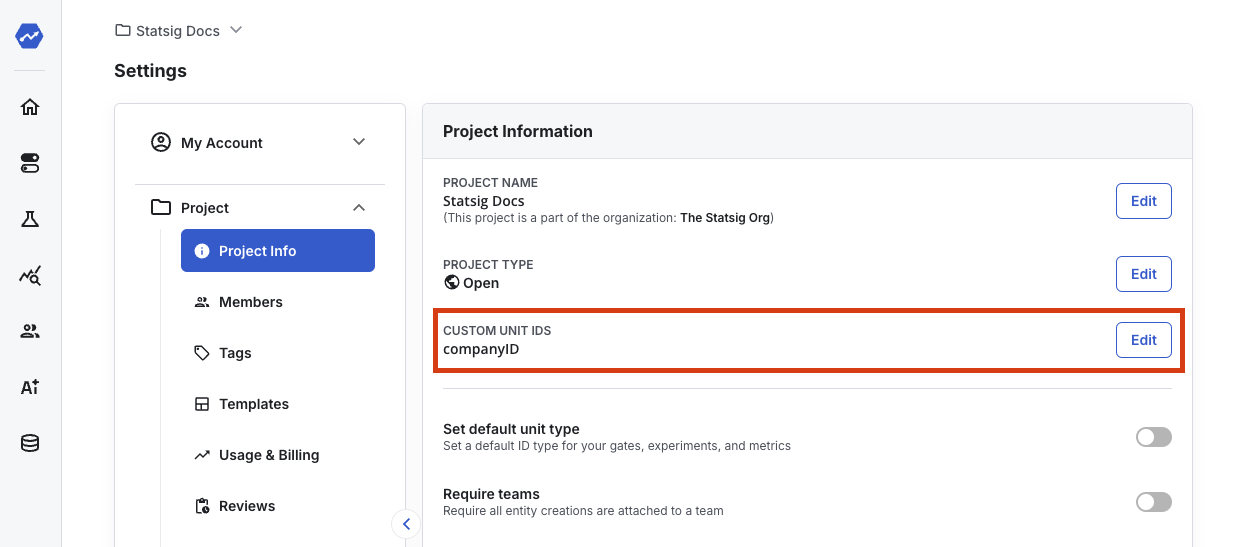
- Name the new
customIDand add a description so other members of your project understand its purpose - Start logging events with that customID in the
customIDsfield of the StatsigUser object
You must provide the set of all IDs on each StatsigUser object.
Best practices
Set all known IDs on each StatsigUser object
To generate metrics for each user and group, Statsig requires all IDs on each StatsigUser object. Pass all identifiers for the user at client SDK initialization time or when calling logEvent in a server SDK, so each identifier contributes to the correct metrics.
If you use a logged-out identifier for anonymous users, continue passing that identifier after the user logs in and you populate userID. This allows gates or experiments targeting the logged-out identifier to continue bucketing the user correctly and enables metrics to be calculated at both the logged-out and logged-in levels.
Deduplicating custom events
Statsig doesn't provide a way to deduplicate custom events that you log.
Naming conventions
Consistency is the most important aspect of event naming. An inconsistent events catalogue becomes difficult to navigate. Statsig accepts any naming convention (for example, Page View, PageView, Page-view, or page_view), but the recommended format is page_view: lowercase, no spaces. You can't use special characters in event names. Statsig drops events that contain the following character set: "\\[\]{}<>#=;&$%|\u0000\n\r". Using the recommended convention avoids duplicate entries with different casing and ensures compatibility with downstream systems connected through integrations.
What to measure
For experimentation and product analytics, log events that correspond to user actions. How you classify events depends on your goals:
- Avoid high-cardinality event names if you have a small user base, because sparse data reduces the reliability of metrics. For example, an eCommerce website should use a generic
product_page_viewevent with contextual page information in theoptional_event_metadataobject, rather than a separate event name for every product page. - If you have a well-defined user funnel, log each step as a separate event.
- If you have a less defined user journey, log generic events (for example,
page_view) and add more detail to the value field (the primary dimension of interest) or theoptional_event_metadataobject.
Logging events through SDKs
All Statsig SDKs provide an API to log events. The API looks like this:
statsig.logEvent(
  event_name,
  optional_event_value,
  optional_event_metadata
);
Where event name describes a notable event in your product, like sign_up, achievement_unlocked, add_to_cart, check_out, etc.
Events can optionally include an event value: for example, the type of achievement unlocked, the name of the product added to cart, or the price of the item purchased. In experiments, the value field generates an automatic breakdown of the event when there are fewer than 8 distinct values.
The metadata field lets you specify additional details about the event. The following examples show how a logEvent call looks:
statsig.logEvent(
  'add_to_cart', // Name
  19.99, // Price
  {
    item_id: 'BC22010',
    cart_size: '2',
    user_segment: 'first_time_purchaser',
  }
);
Size limits on event payload There are limits to how large each event field can be. Object fields have an overall limit of 4096 on its stringified length. String fields have a limit of 64 on its length.
Was this helpful?