Monitor an Experiment
Track health checks, exposures, and diagnostics for active experiments in Statsig Cloud.
After an experiment launches, you can monitor its health and exposure mix directly from the Statsig console.
Experiment health checks
- Open Experiments from the navigation.
- Select the experiment you want to inspect.
- Review the Experiment Health Checks banner at the top of the scorecard.
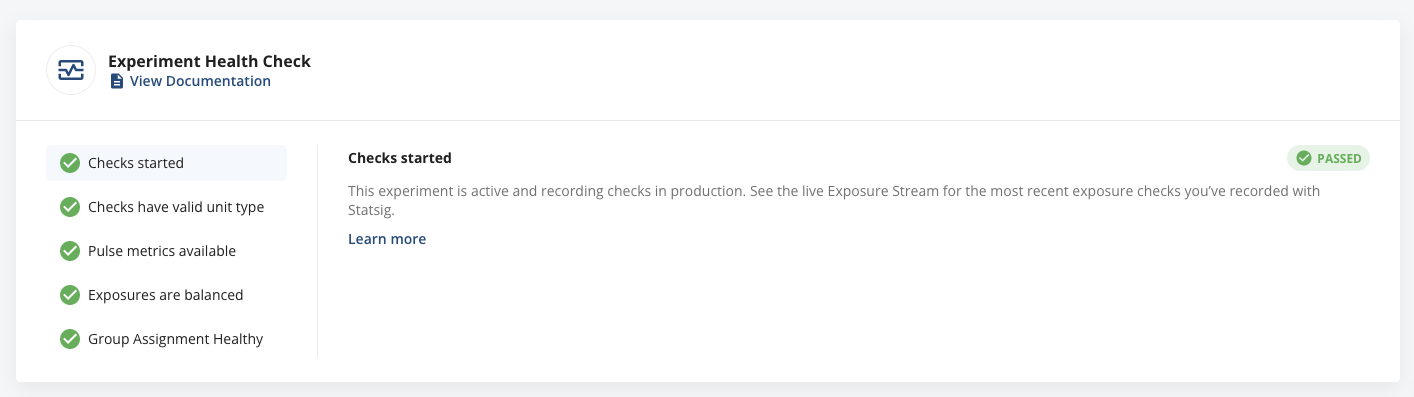
Hover a status icon to read the summary, then click for full context. Common health checks include:
- Checks started - Verifies the SDK is reporting config checks shortly after launch.
- Checks have valid unit type - Confirms checks include the configured unit identifier (userID by default).
- Event metrics have data - Ensures events carry the same unit ID as exposures so Pulse can compute metrics. This often surfaces when downstream tooling (e.g., Segment) omits stableID or custom IDs.
- Pulse metrics available - Indicates Pulse results have landed (typically the day after launch).
- Exposures are balanced - Runs a chi-squared test for sample ratio mismatch (SRM). Occasional warnings happen due to randomness, but persistent red alerts point to assignment or logging issues.
- p-value between 0.001 and 0.01 -> Warning (yellow).
- p-value < 0.01 with <0.1% absolute deviation -> Warning (yellow) with low expected impact.
- p-value < 0.001 and >=0.1% deviation -> Alert (red) requiring investigation.
- Crossover units detected - Flags users exposed to multiple variants. Statsig Cloud keeps these users in both groups (since the SDK rarely produces crossovers) but highlights them so you can address root causes. Reach out if you see rates above 1%.
- Default value type mismatch - Warns if an experiment's fallback default value type disagrees with the parameter definition.
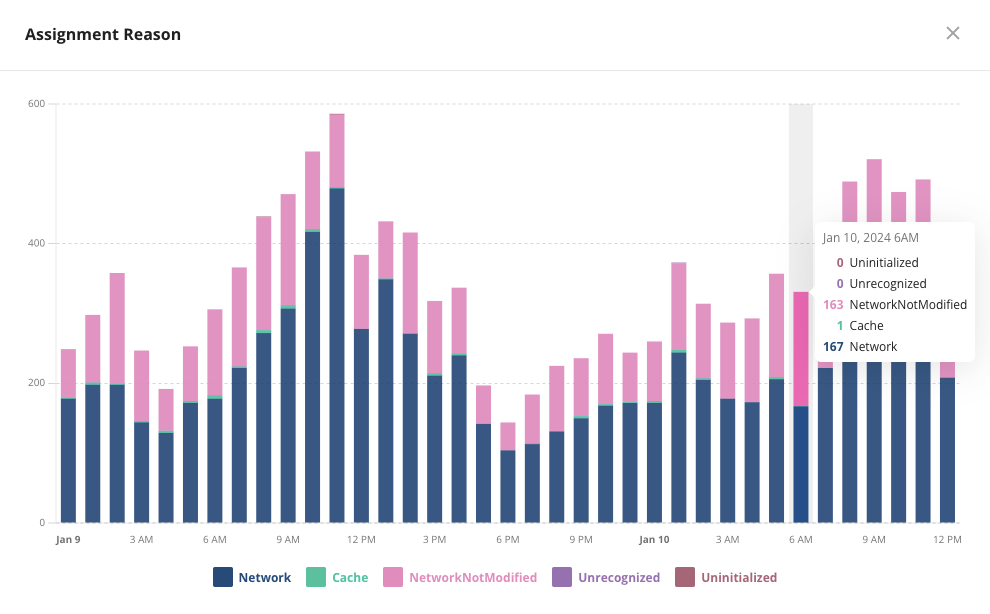
- Group assignment healthy - Surfaces unexpected assignment reasons (e.g.,
Uninitialized,InvalidBootstrap). Click View Assignment Reasons to see the hourly breakdown.
Crossover troubleshooting
Crossover warnings usually mean:
- The request bootstrapped with a different stable ID (
BootstrapStableIDMismatch). - Both client and server SDKs are checking the same gate/experiment without synchronized updates.
If you can't pinpoint the cause, contact Statsig in Slack for help.
Exposure streams
Scroll below the health checks to view exposure streams. These tables show every recent check, including the rule that matched and any secondary exposures (holdouts, targeting gates, etc.). They are useful for validating targeting and confirming ramp progress.
Cumulative exposures
To track growth per variant:
- Open the Results tab.
- Locate the Cumulative Exposures chart.
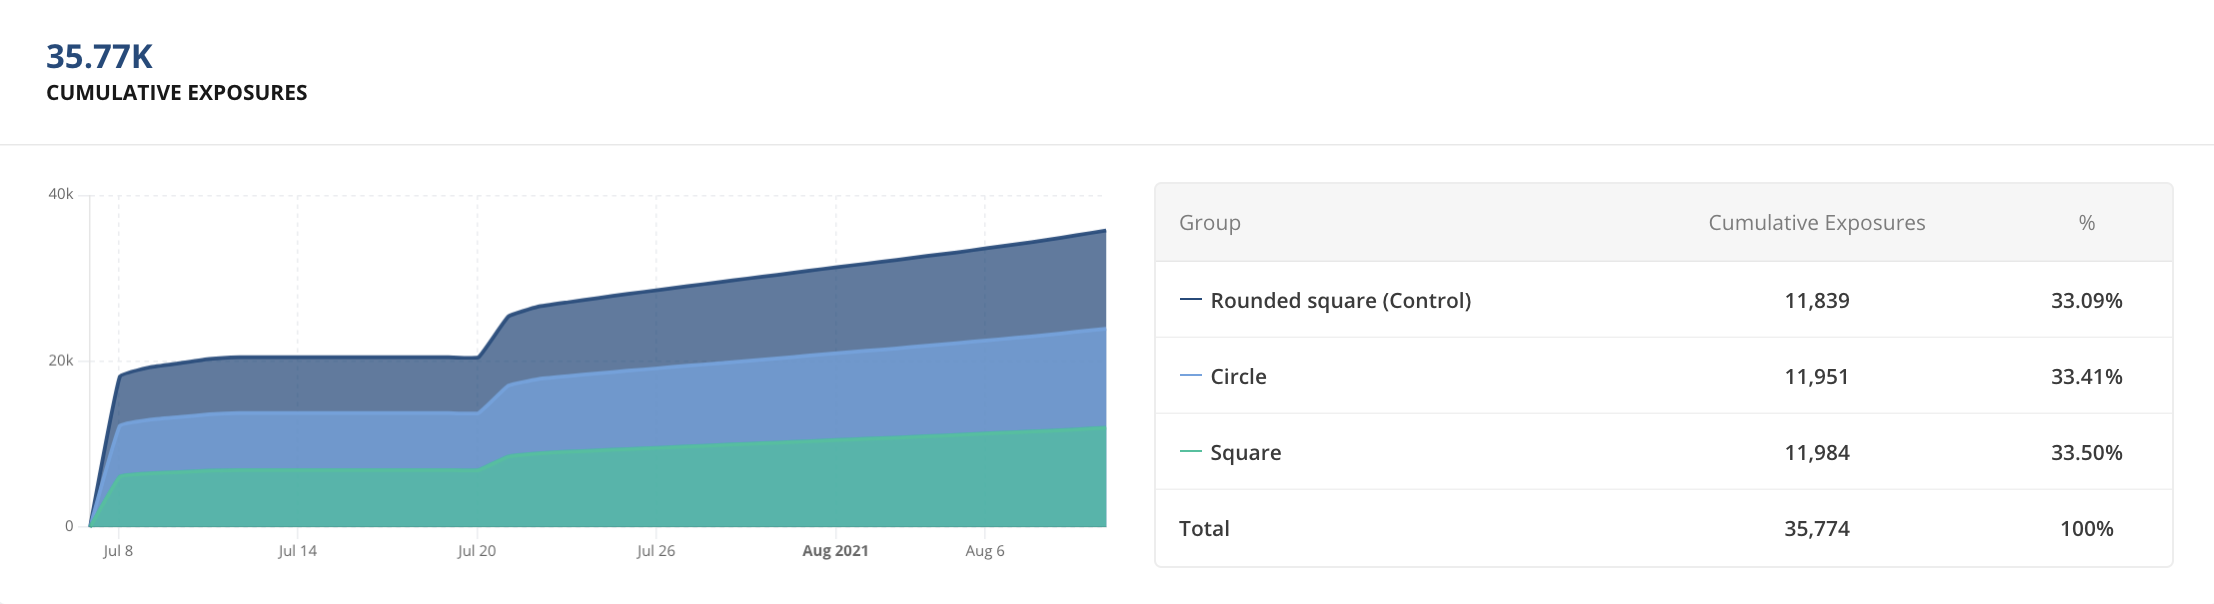
The chart shows how many users have entered each group over time, making it easy to spot ramp issues early.
Monitoring these diagnostics helps you resolve issues quickly and keep experiments on track.
Was this helpful?