Funnel Charts
Provide a granular understanding of what portion of users are completing each step of a journey you define
How funnel charts work
Funnel Charts in Metrics Explorer show what portion of users complete each step of a journey you define through your product or service. These charts are useful for understanding user behavior, identifying bottlenecks, and developing insight-driven product changes that help users convert more successfully.
Example use cases
- Conversion Analysis: Monitor the progression of users through stages like sign-up, adding to cart, and purchase completion.
- Identifying Drop-off Points: Pinpoint where users drop off, so you can target improvements at those steps.
- Comparing User Segments: Observe how different user segments move through the funnel, highlighting variations in behavior based on demographics, user types, or other criteria.
- Product Optimization: Determine which features or steps effectively move users to the next stage, and which require improvements.
- Experiment Analysis: Understand the conversion rates before and after first exposure to an experiment.
Defining a user funnel
Step 1: Add steps to your funnel
To define a funnel, select a series of events that represent different parts of a product flow you want to understand.
To do so:
- Go to Metrics Explorer under Analytics in the Navigation Bar, and switch over to the Funnel Charts view.
- Add steps to your funnel using the + icon. Optionally add filters to funnel steps to target specific event or user properties. For WHN, add steps directly from your Metric Source. For Statsig Cloud, use events or metrics for the steps.
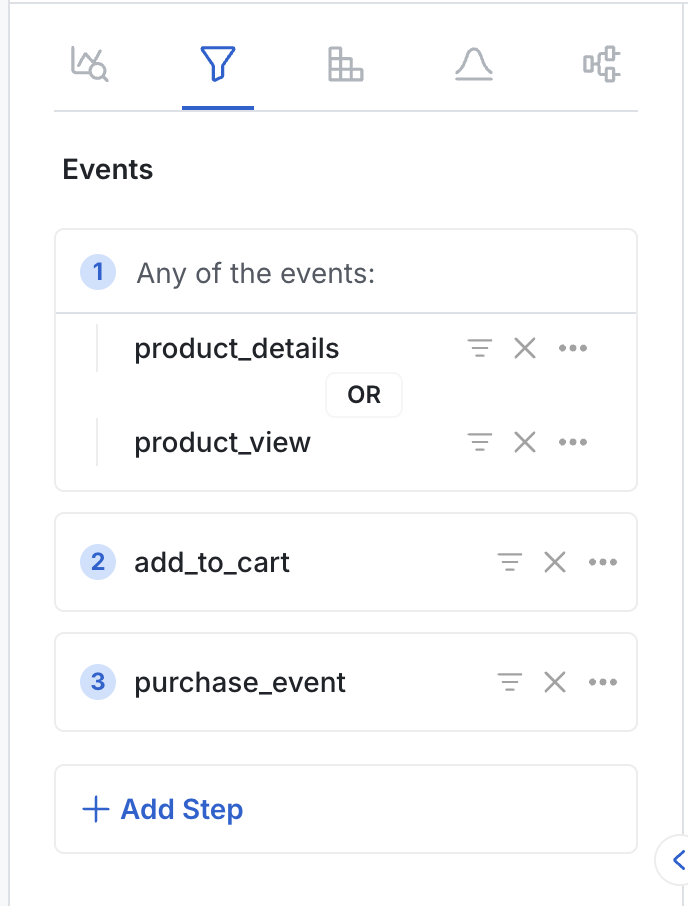
Combining multiple events into one step
You can combine multiple events into a single step. This is useful when more than one qualifying event represents a single meaningful portion of your funnel. Combined events use OR logic. To do this:
- On the step, click the … button and select Combine Events.
- Select an additional event to add.
- Add any filters to each event in the funnel step.
Repeat as needed. You can combine up to 5 events per step.
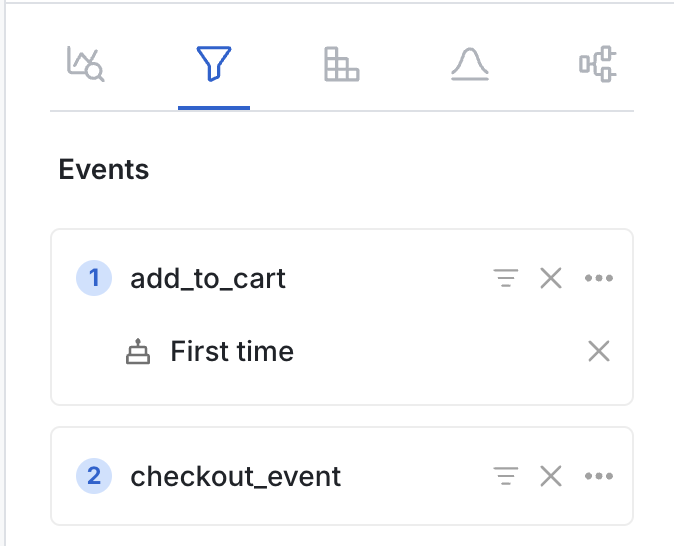
Filtering to the first time a user performed an event
Filtering to the first-time experience is useful because first-time behavior can affect long-term retention and may differ significantly from general product flows. You can filter funnel events to the first time a user (or other unit ID) ever performed an event:
- Click … next to the event.
- Select Filter to First Time.
Renaming steps
When sharing a Funnel Chart (for example, by saving it to a dashboard), logged event names may not be easily readable. You can rename funnel steps for legibility:
- Click … next to the event name.
- Click Rename Funnel Step.
- Enter a readable name for the step.
Renaming a step doesn't change the underlying event name. The rename applies only to the funnel being configured.
Step 2: Select a graph type
Statsig supports three graph types for understanding conversion funnels:
- Conversion Rate: A standard funnel view showing a step-by-step breakdown of where users drop off and how many convert through each step.
- Conversion Rate Over Time: Shows how the overall conversion rate has changed over time. Useful for understanding how features and product changes affected the funnel conversion rate.
- Time to Convert: Shows the distribution of time it takes users to complete the funnel.
Step 3: Choose an ID type
In general, construct funnels using a userID to understand the rate at which individual users complete each step.
Some funnels may involve multiple people in an organization. For example, you may want to understand end-to-end company onboarding where different people handle purchasing, deploying, and using the service.
Statsig supports individual or group analytics, letting you analyze funnel success at the user level or for whole groups such as organizations or companies.
You can choose any ID type defined in your Statsig project when creating a funnel.
If you select an experiment exposure, make sure the ID type matches that of the experiment.
Group analytics isn't a paid add-on at Statsig, and comes at no extra cost for all tiers.
Step 4: Define the conversion window
After you define your funnel, you can limit the analysis to users (or other unit IDs) who converted within a specified time frame. Statsig counts users who start the funnel but don't convert within this time frame as dropped off.
Step 5: Drilldown
To understand how conversion varies between user groups, use the Group By feature to split funnels by properties, experiment groups, or feature flag groups. Click + to the right of Group By and select the property, experiment, or feature flag to split the funnel conversion analysis by.
Advanced funnel analysis
Ordered or unordered funnels
Ordered funnels are the default and the most common scenario. They require a user to complete the selected events in the specified order to count as converted. The user may perform other events between the specified events and still count as converted. For example, for an ordered funnel with events A, B, C, and D, the sequence A→B→B→A→C→D counts as converted.
To check only whether a user completed all events regardless of order, toggle Ordered off in the advanced settings. Unordered funnels require only that the user completes the specified events within the given time range.
Unique users (or unit ID) vs total conversions
You can define funnel analysis by the total number of conversions or the number of unique users who convert. The default is Unique Users.
Daily aggregation
When enabled, this setting calculates funnel conversions per calendar day. Statsig counts a unit with funnel conversions on multiple days as multiple conversions. This setting is on by default.
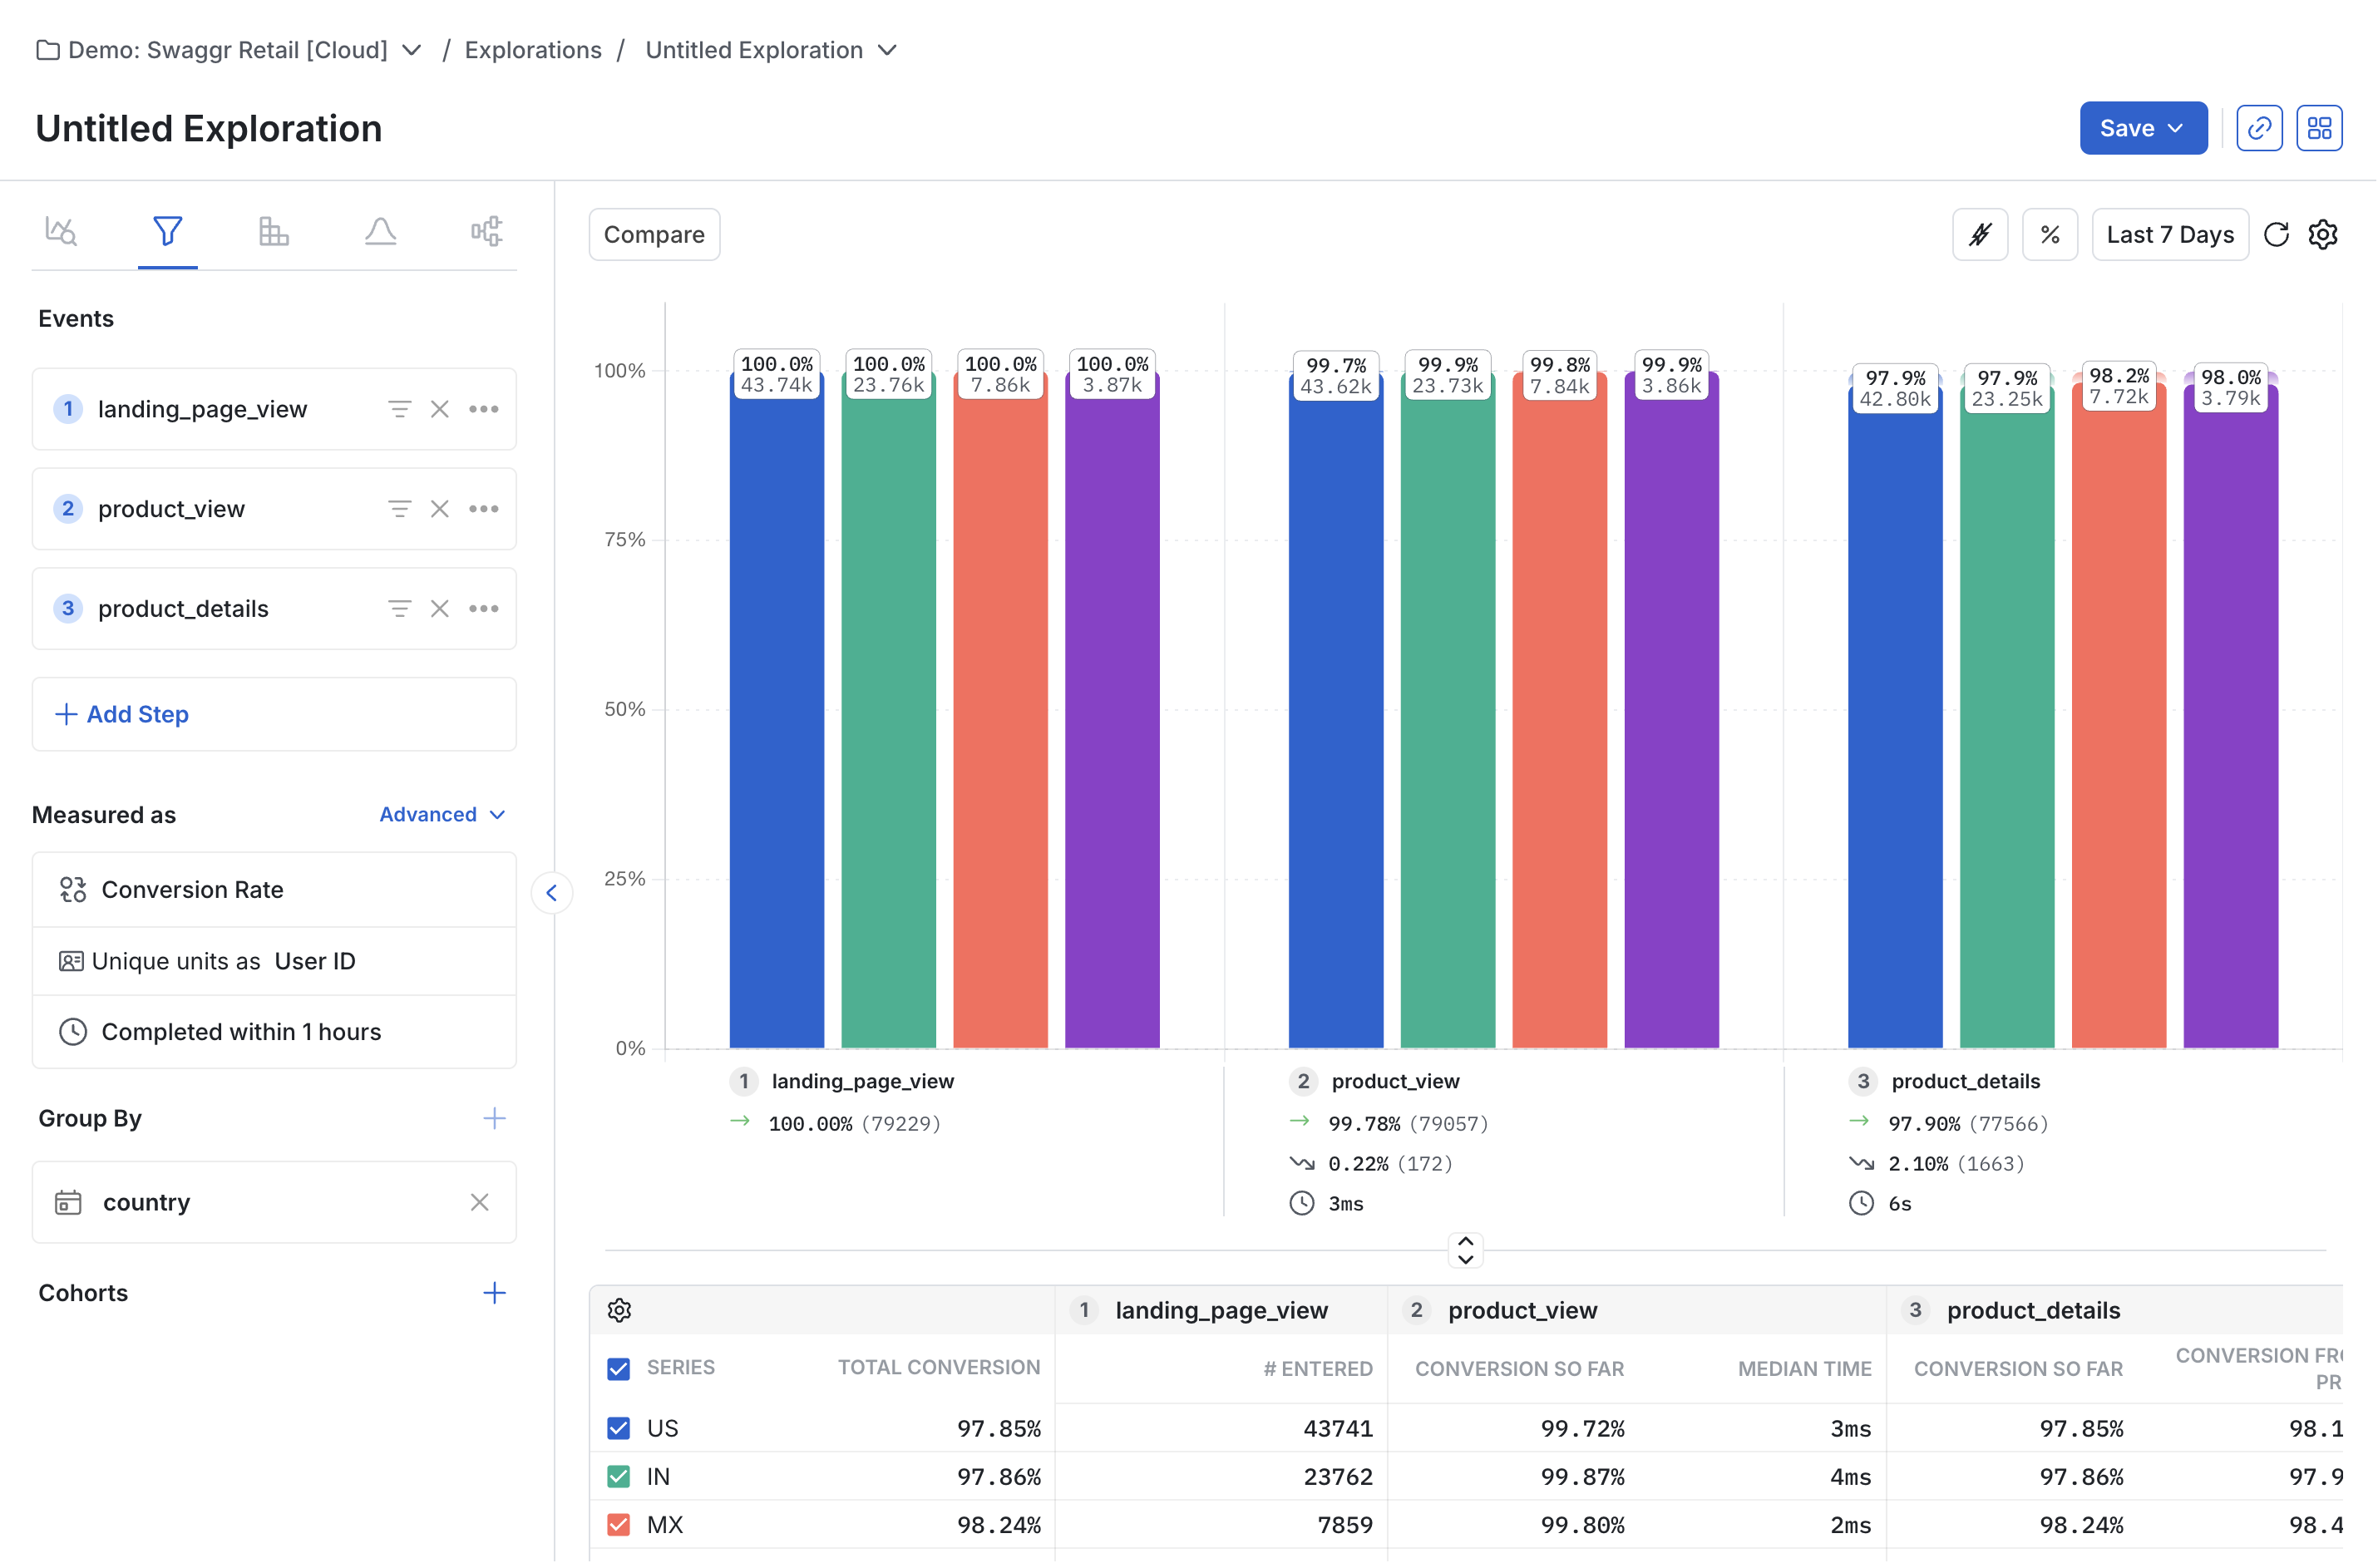
Interpreting your user funnel
Conversion rate vs. number of conversions
At the top right of the funnel chart, the Conversion Rate vs. Conversions selector lets you switch the y-axis between conversion rate and number of conversions. When used with a Group By, toggling between the two views shows both relative and absolute conversion scales across different user groups.
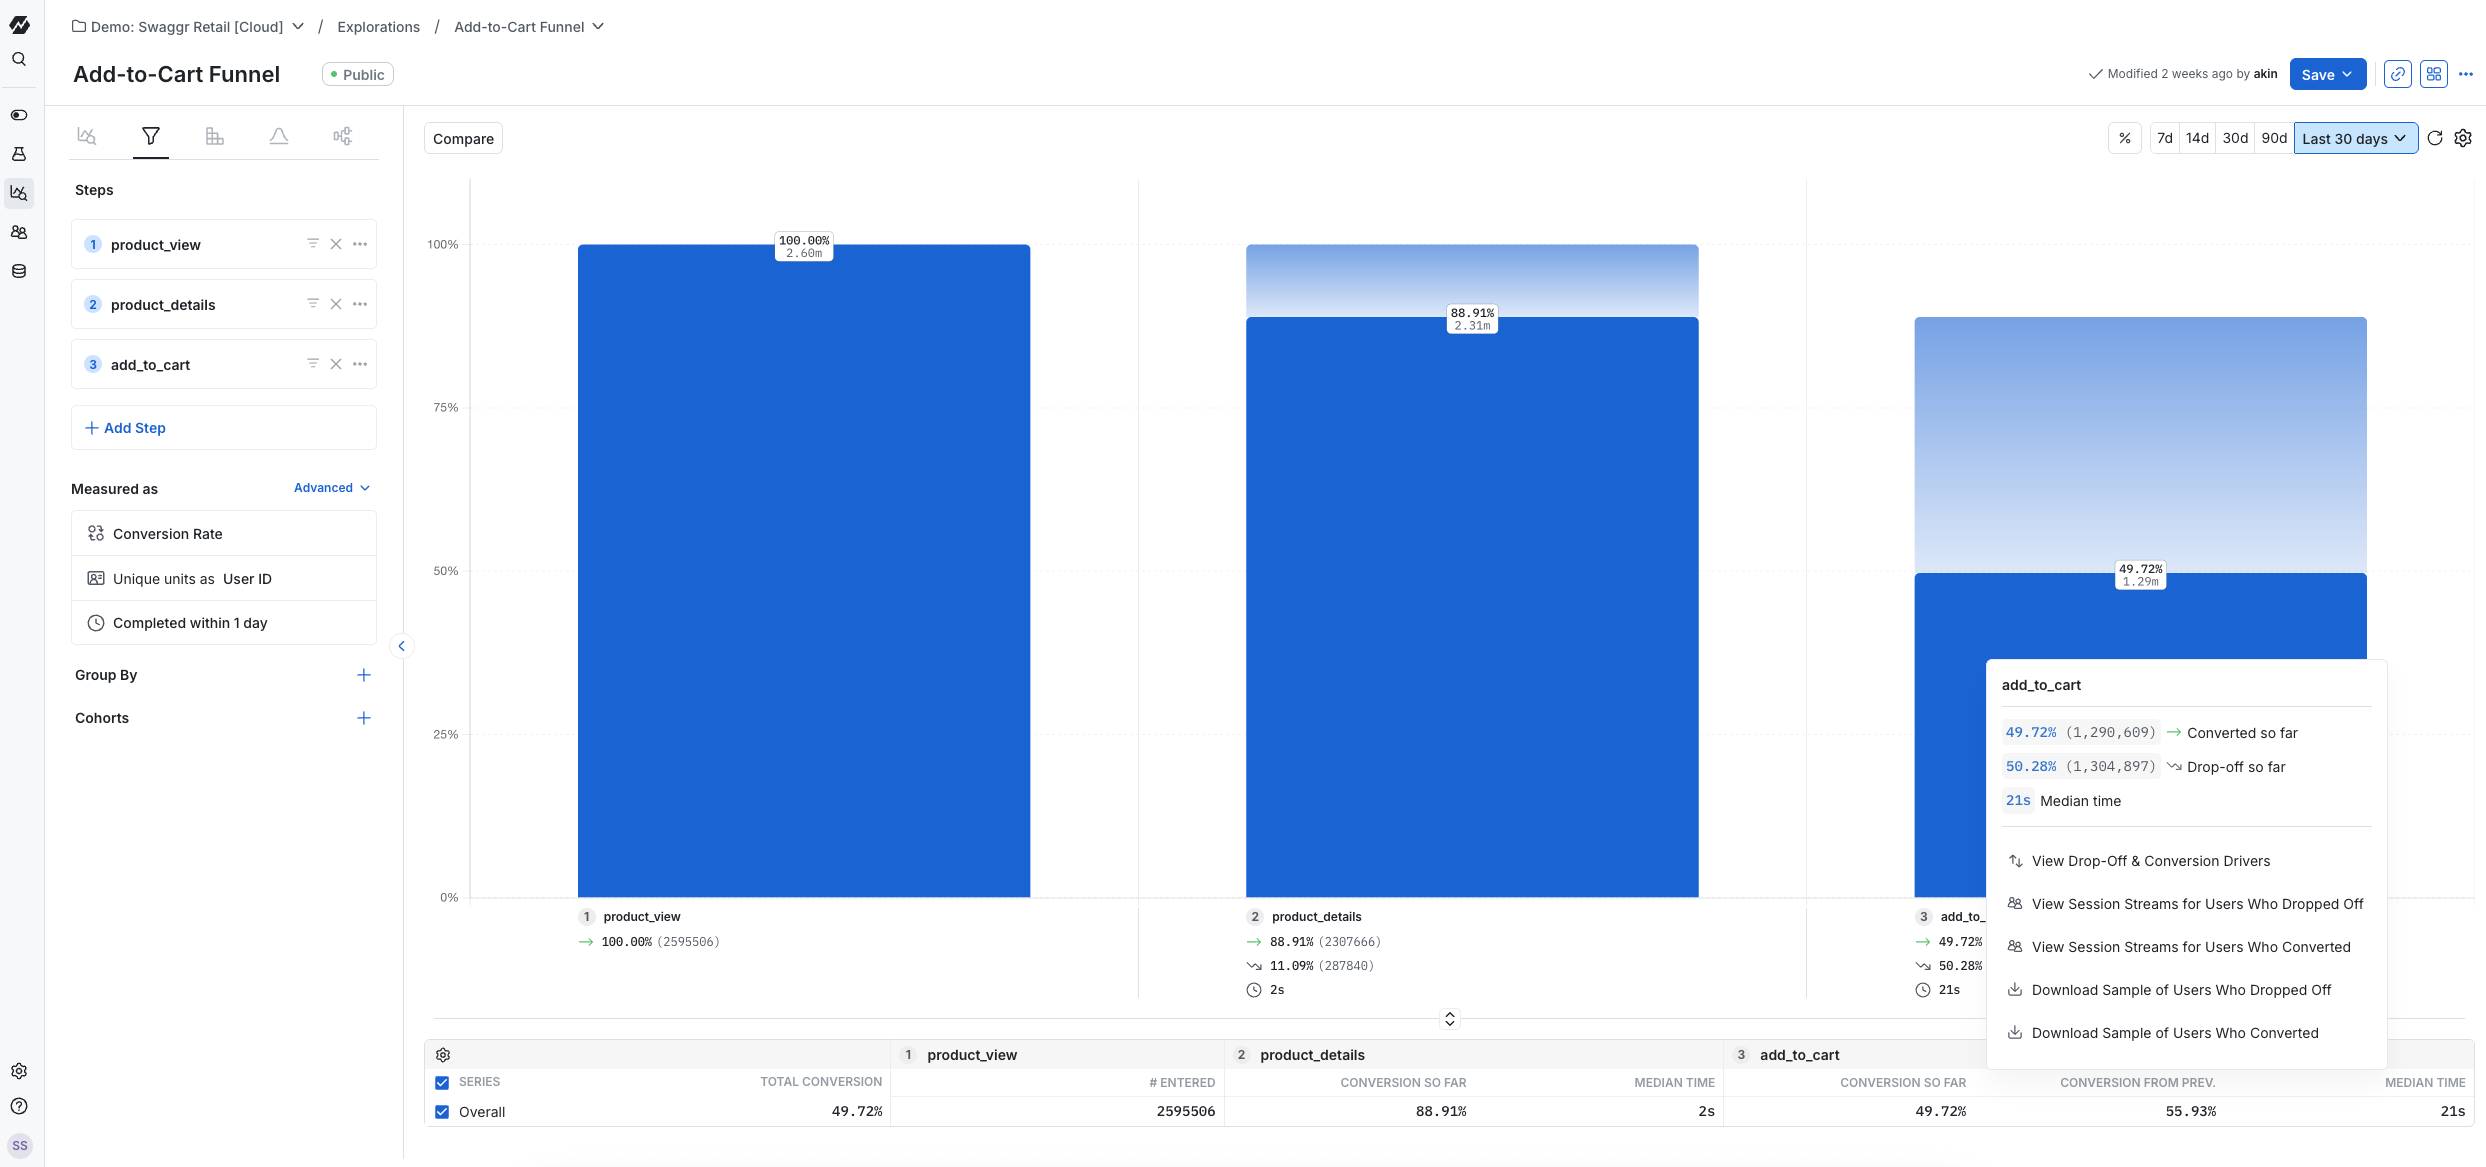
Conversion summary and table
Under each funnel step, a summary shows:
- The percentage and number of units that converted, relative to the first step
- The percentage and number of units that dropped off, relative to the first step
- The average time for each user to convert
The conversion table shows the percentage and number of units that converted relative to both the first step and the previous step. This is useful when grouping by a property to compare conversions between user groups.
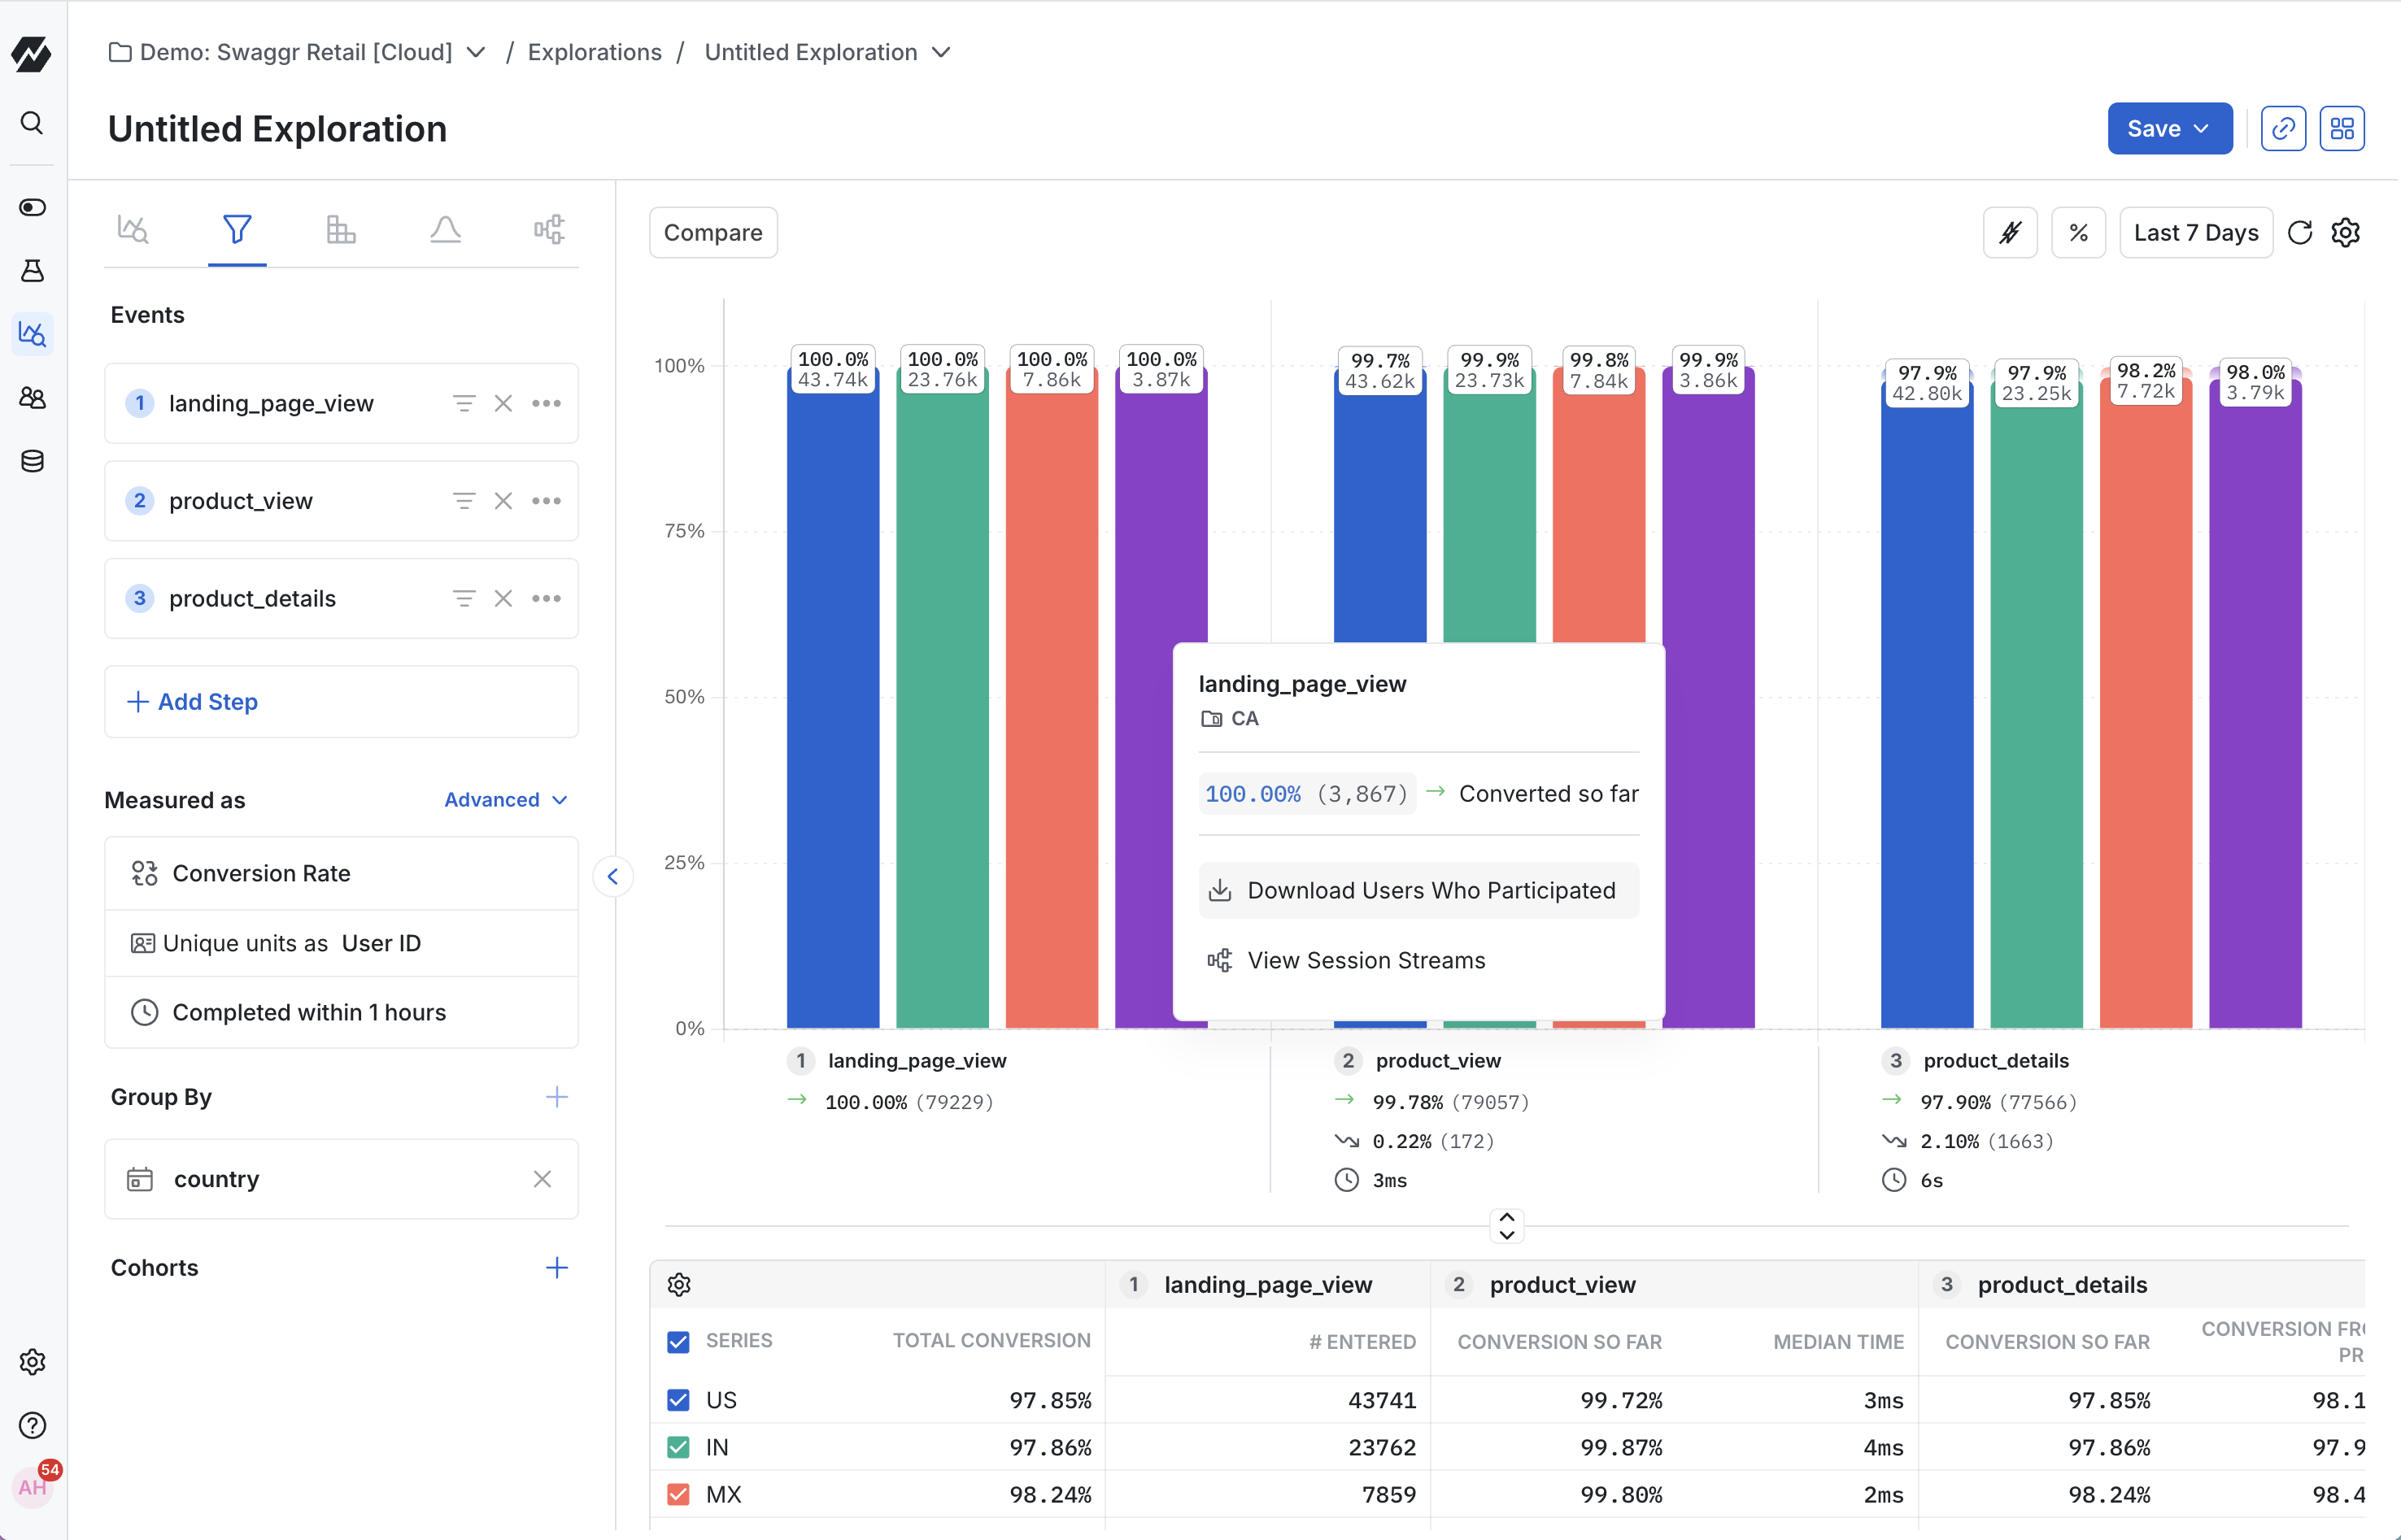
User exploration
By clicking any bar in the funnel, you can download all users in that segment who dropped off or converted as a CSV file. You can also view session streams to get an event-by-event understanding of a user's experience before and after that point in the funnel.
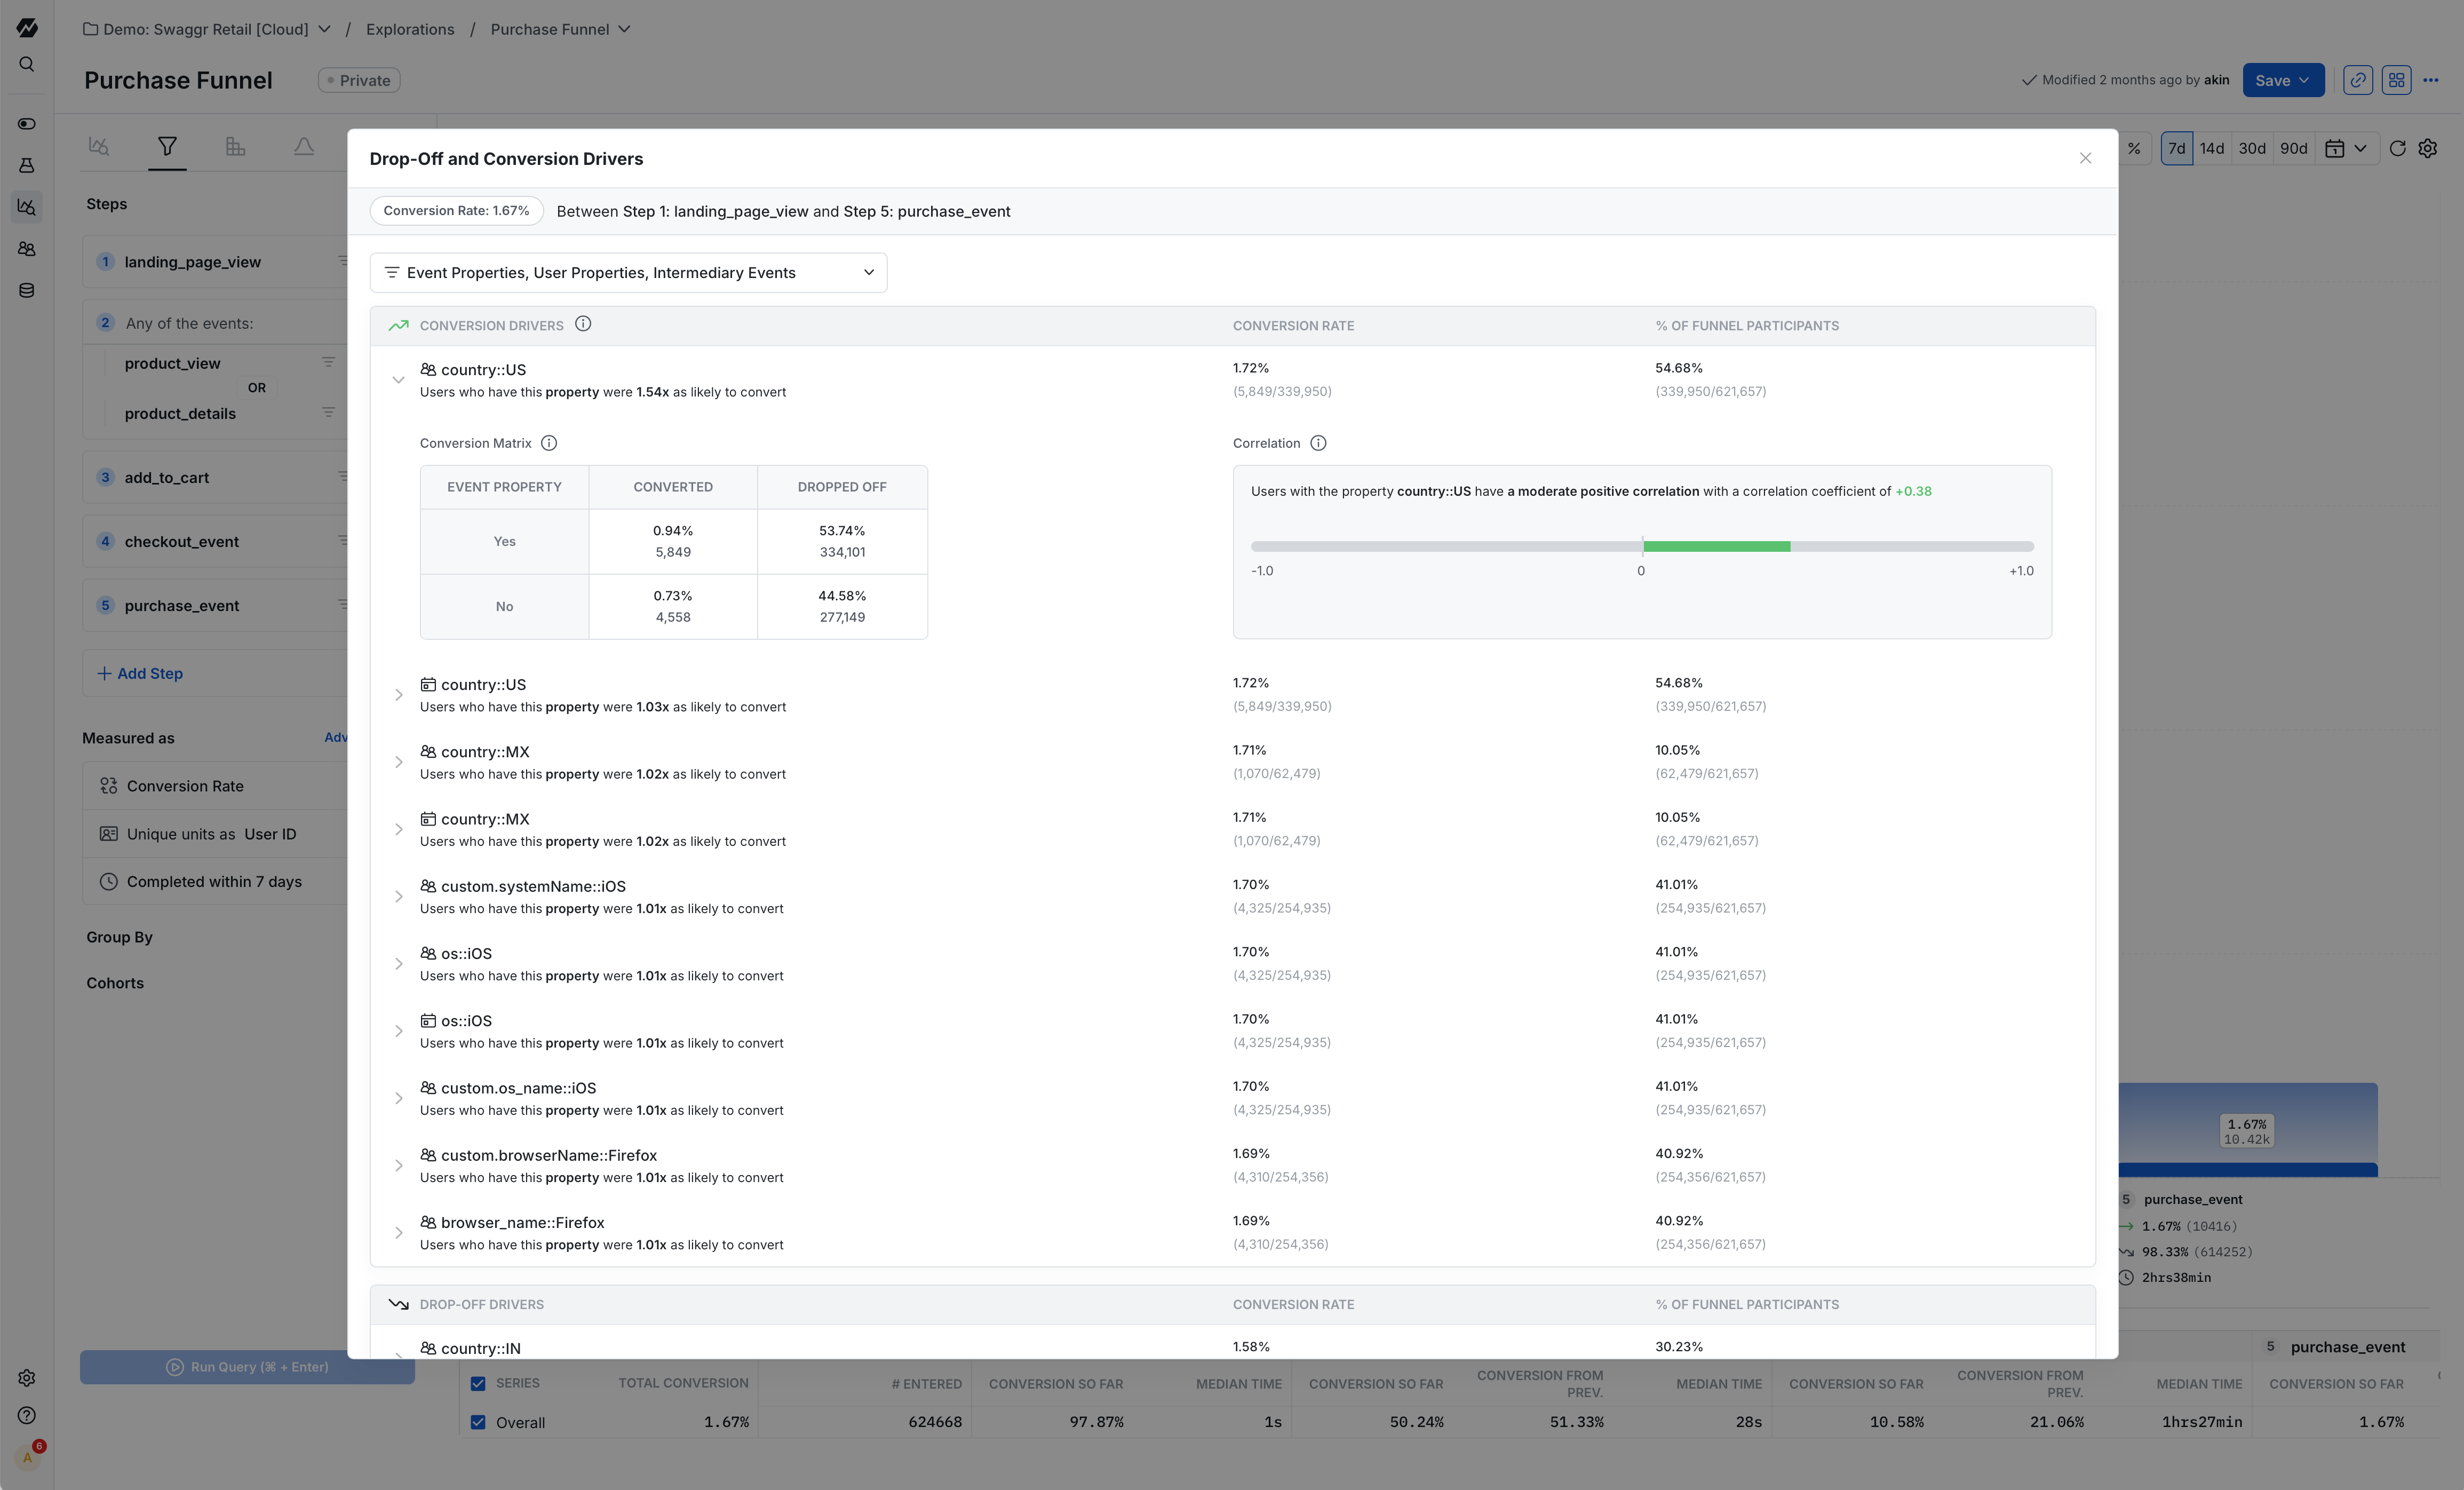
Conversion Drivers
Conversion Drivers identify statistically significant factors that correlate with funnel conversion or drop-off at each step. The analysis surfaces event properties, user properties, and intermediary events that influence user progression through the funnel.
To access Conversion Drivers:
- Click on any funnel step
- Select "View Drop-Off & Conversion Drivers"
- Configure the analysis scope using the dropdown filters
Analysis configuration
You can configure which data types to include in the analysis:
- Event Properties: Attributes attached to events (e.g., platform, plan_type, referral_code)
- User Properties: User-level attributes (e.g., country, account_age, signup_method)
- Intermediary Events: Events that occurred between the selected funnel steps
Driver metrics
Each identified driver displays:
- Conversion Likelihood: A multiplier of the funnel's conversion rate (e.g., users with platform::Android are 1.2x as likely to convert)
- Conversion Rate: Percentage of users with this factor who converted
- Participant Share: Percentage of total funnel participants who had this factor
Detailed analysis
Click on any driver to access the drilldown view, which provides:
- Conversion Matrix: Side-by-side comparison of conversion outcomes for users with and without the factor
- Correlation Coefficient: Statistical measure of the factor's association with funnel completion (also known as the phi coefficient)
You can group the funnel by any identified driver by clicking the group by option. This reconfigures the funnel chart to show conversion performance segmented by the selected property.
Use cases
Conversion Drivers are useful for:
- Exploratory analysis when investigating funnel performance without predefined hypotheses
- Root cause analysis of conversions and drop-offs
- Validating assumptions about user segment behavior
- Monitoring funnel performance changes over time
Conversion Drivers require a Pro plan subscription or Enterprise plan with the Advanced Analytics package.
Was this helpful?