Dashboards
The most effective way to consume, share, and save the insights that matter most for your product
Dashboards bring the charts, metrics, experiments, and feature gates you care about into one view that your team can share, save, and revisit. Use a dashboard to track long-term product health, monitor a feature launch, or send stakeholders a recurring snapshot of the metrics that matter. You can start from a Statsig template or build one from scratch.
Creating a dashboard
There are two ways to create a dashboard:
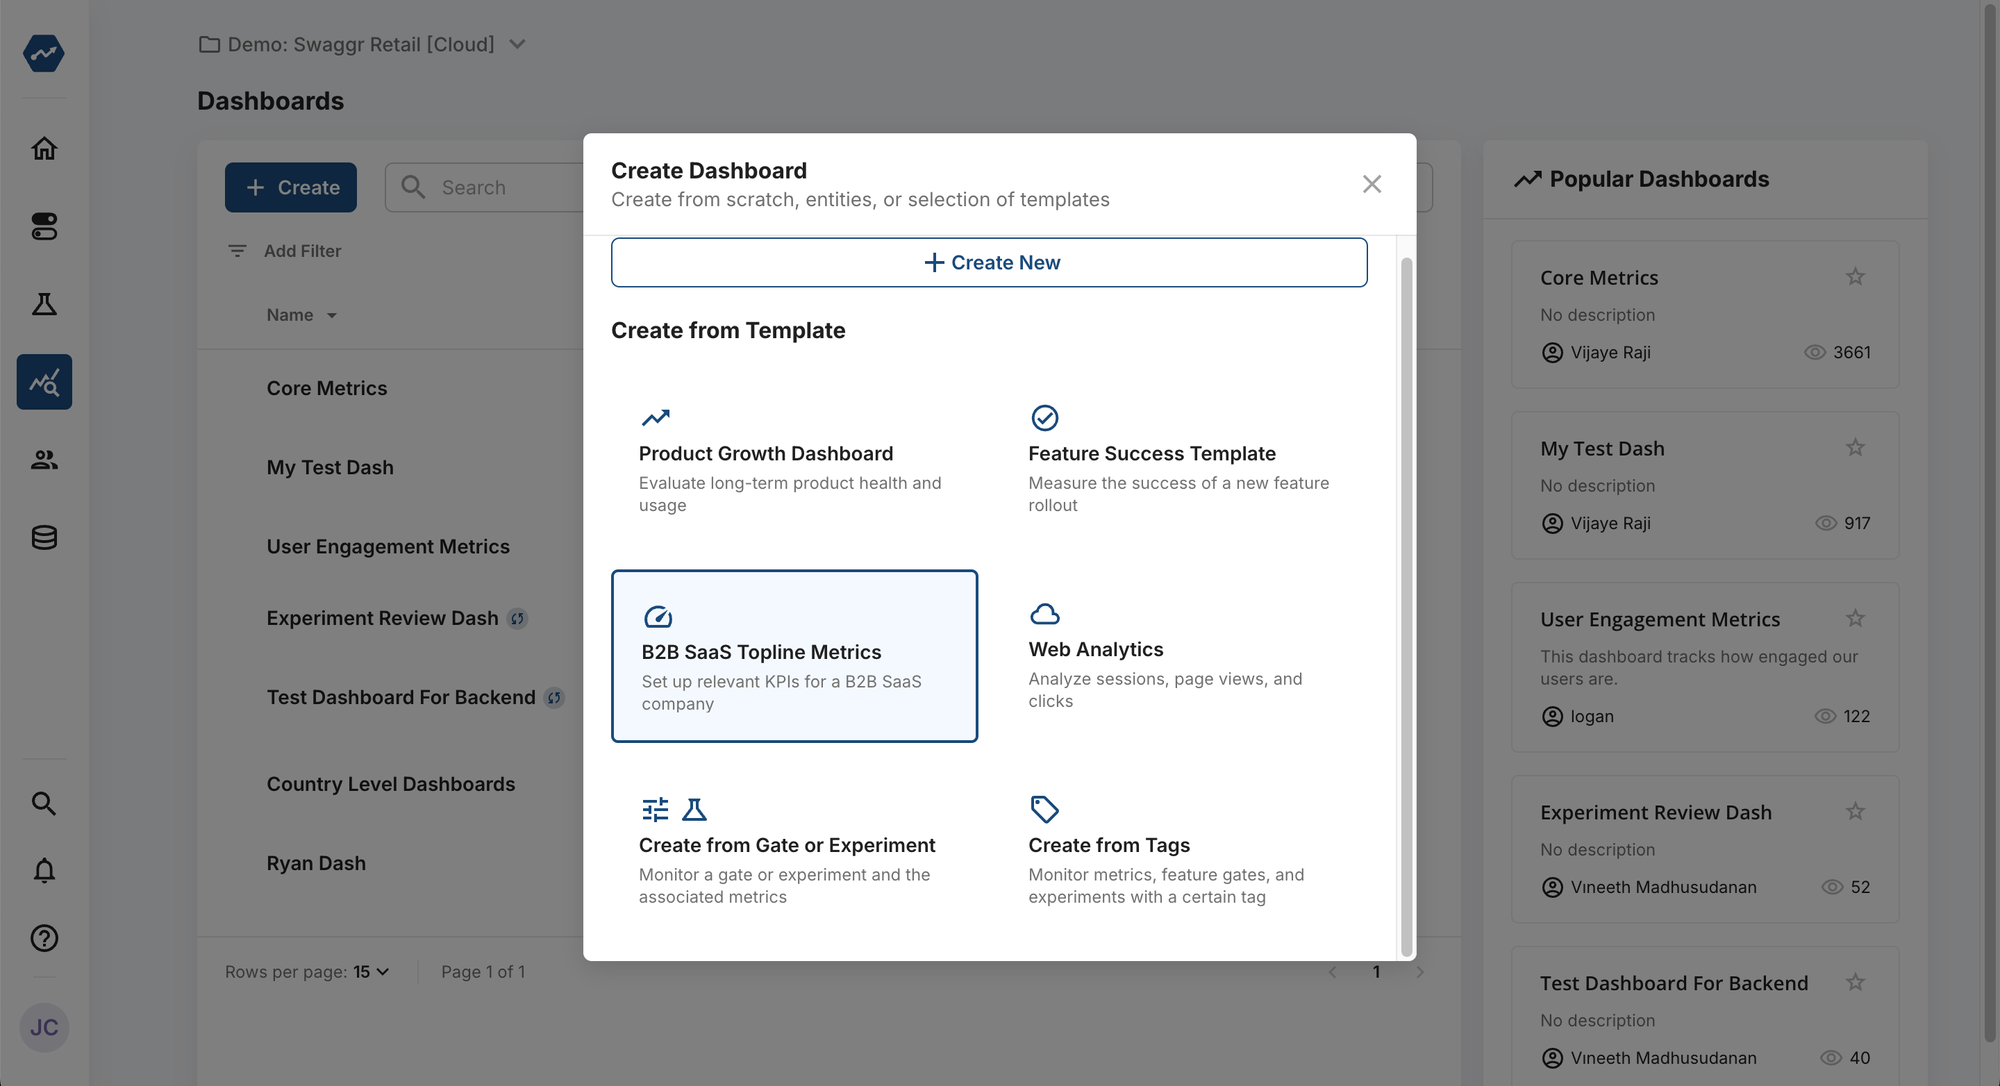
- Navigate to the Dashboards tab and click Create. You can choose one of Statsig's Dashboard Templates or create a custom dashboard.
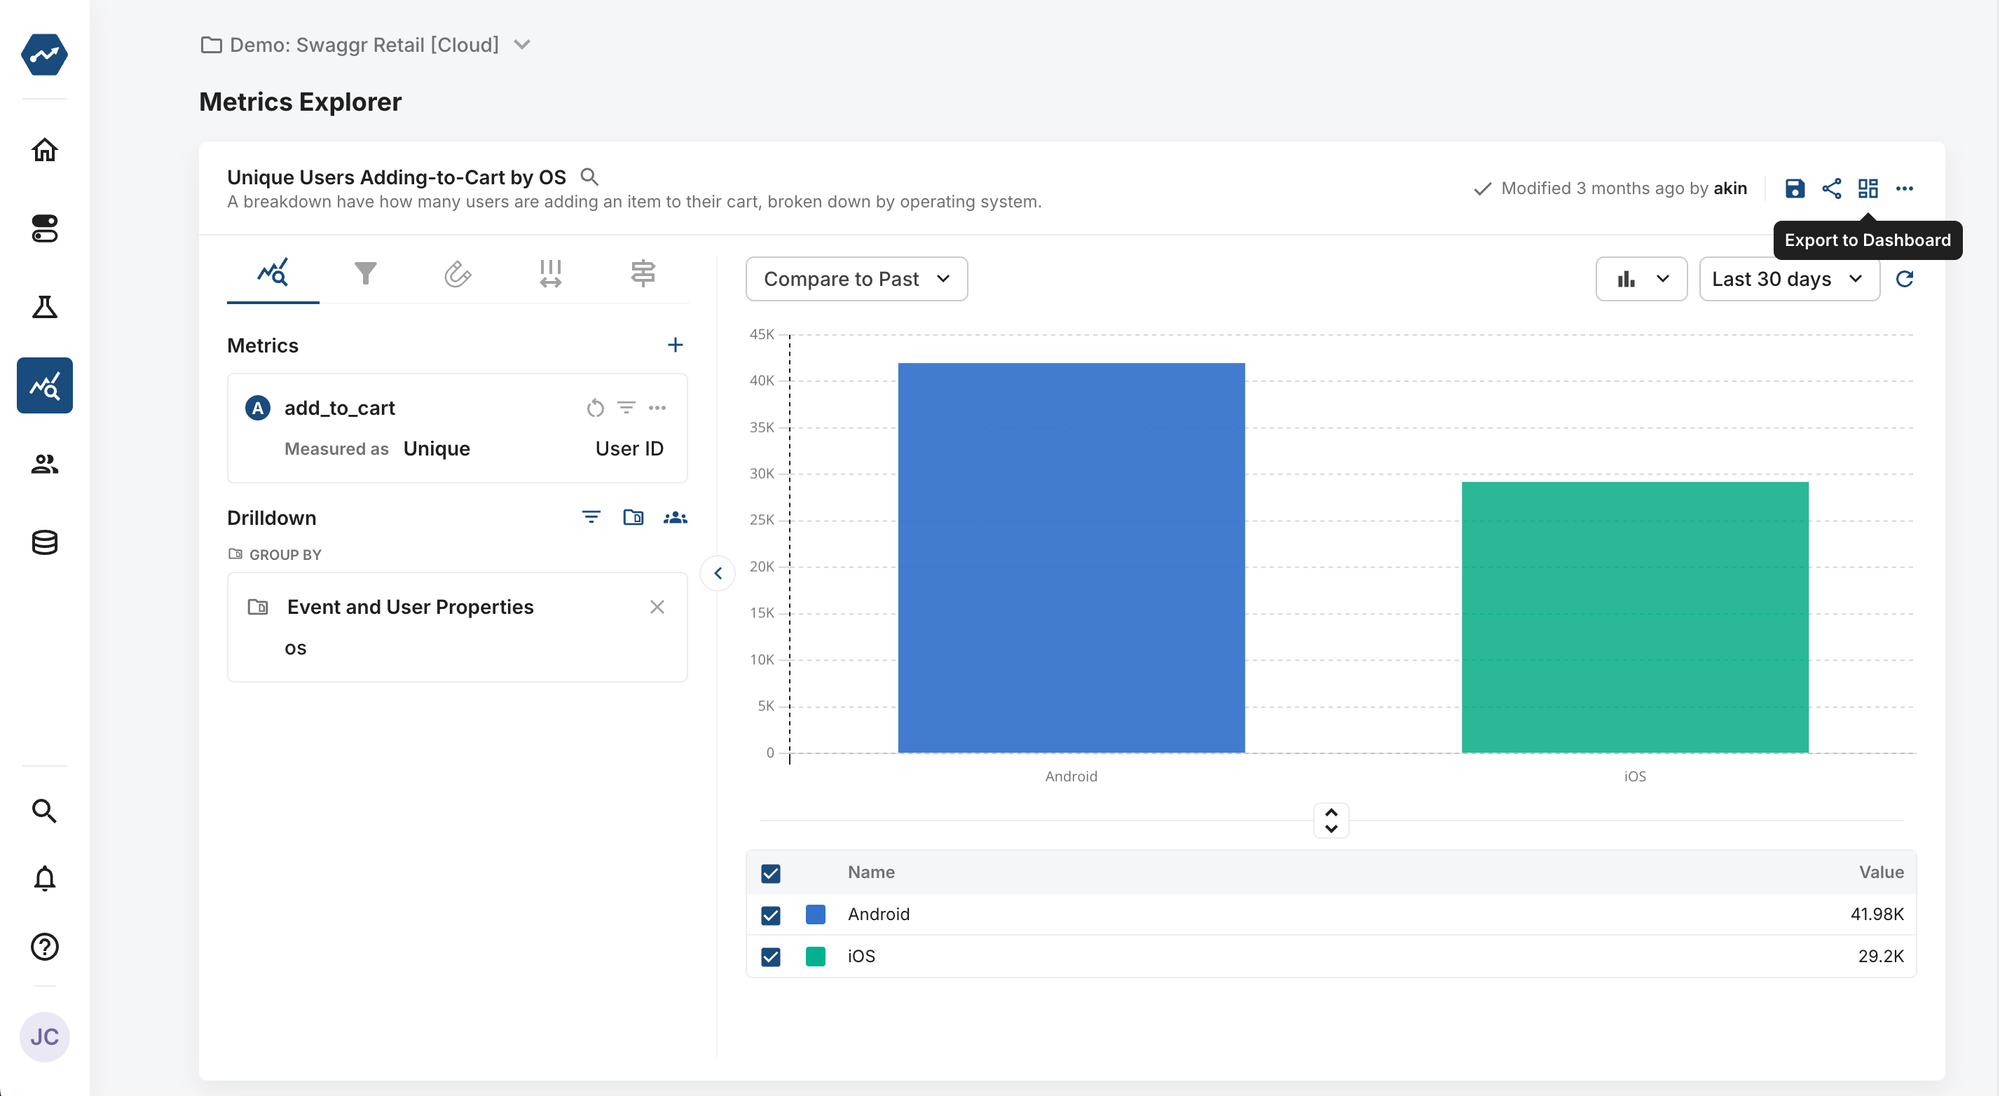
- You can also create a dashboard directly from Metrics Explorer. To do this, after you finish building a chart:
- Click Export to Dashboard at the top right corner of the chart.
- Name the chart.
- Select Create New Dashboard from the Dashboard Destination selector.
- Give your new dashboard a name.
Adding charts, feature gates, and experiments to a dashboard
Dashboards help teams share and review product insights. You can add Metric Charts and track ongoing Pulse results from A/B tests and feature launches.
There are several types of dashboard widgets you can add or create including:
- Charts: Create a new chart directly from a dashboard or export a chart created in Metrics Explorer to a dashboard. Supported charts include:
- Drilldown Charts
- Funnel Charts
- Retention Charts
- Distribution Charts
- User Journey Charts
- Text: Annotate dashboards with context or create section headers for better readability.
- Single Value: Highlight a hero metric with clarity by adding a single value to the dashboard.
- Experiment, Feature Flag: Get a quick snapshot of an experiment or feature flag.
- Funnel Metrics: Visualize custom funnel metrics.
To add a widget to a dashboard
- Click Add Widget.
- Select the type of widget you want to add.
- Configure the widget, for example select a chart type and then select events and metrics you want to track.
- Save the widget to the dashboard.
Exploring your dashboard
Edit date ranges
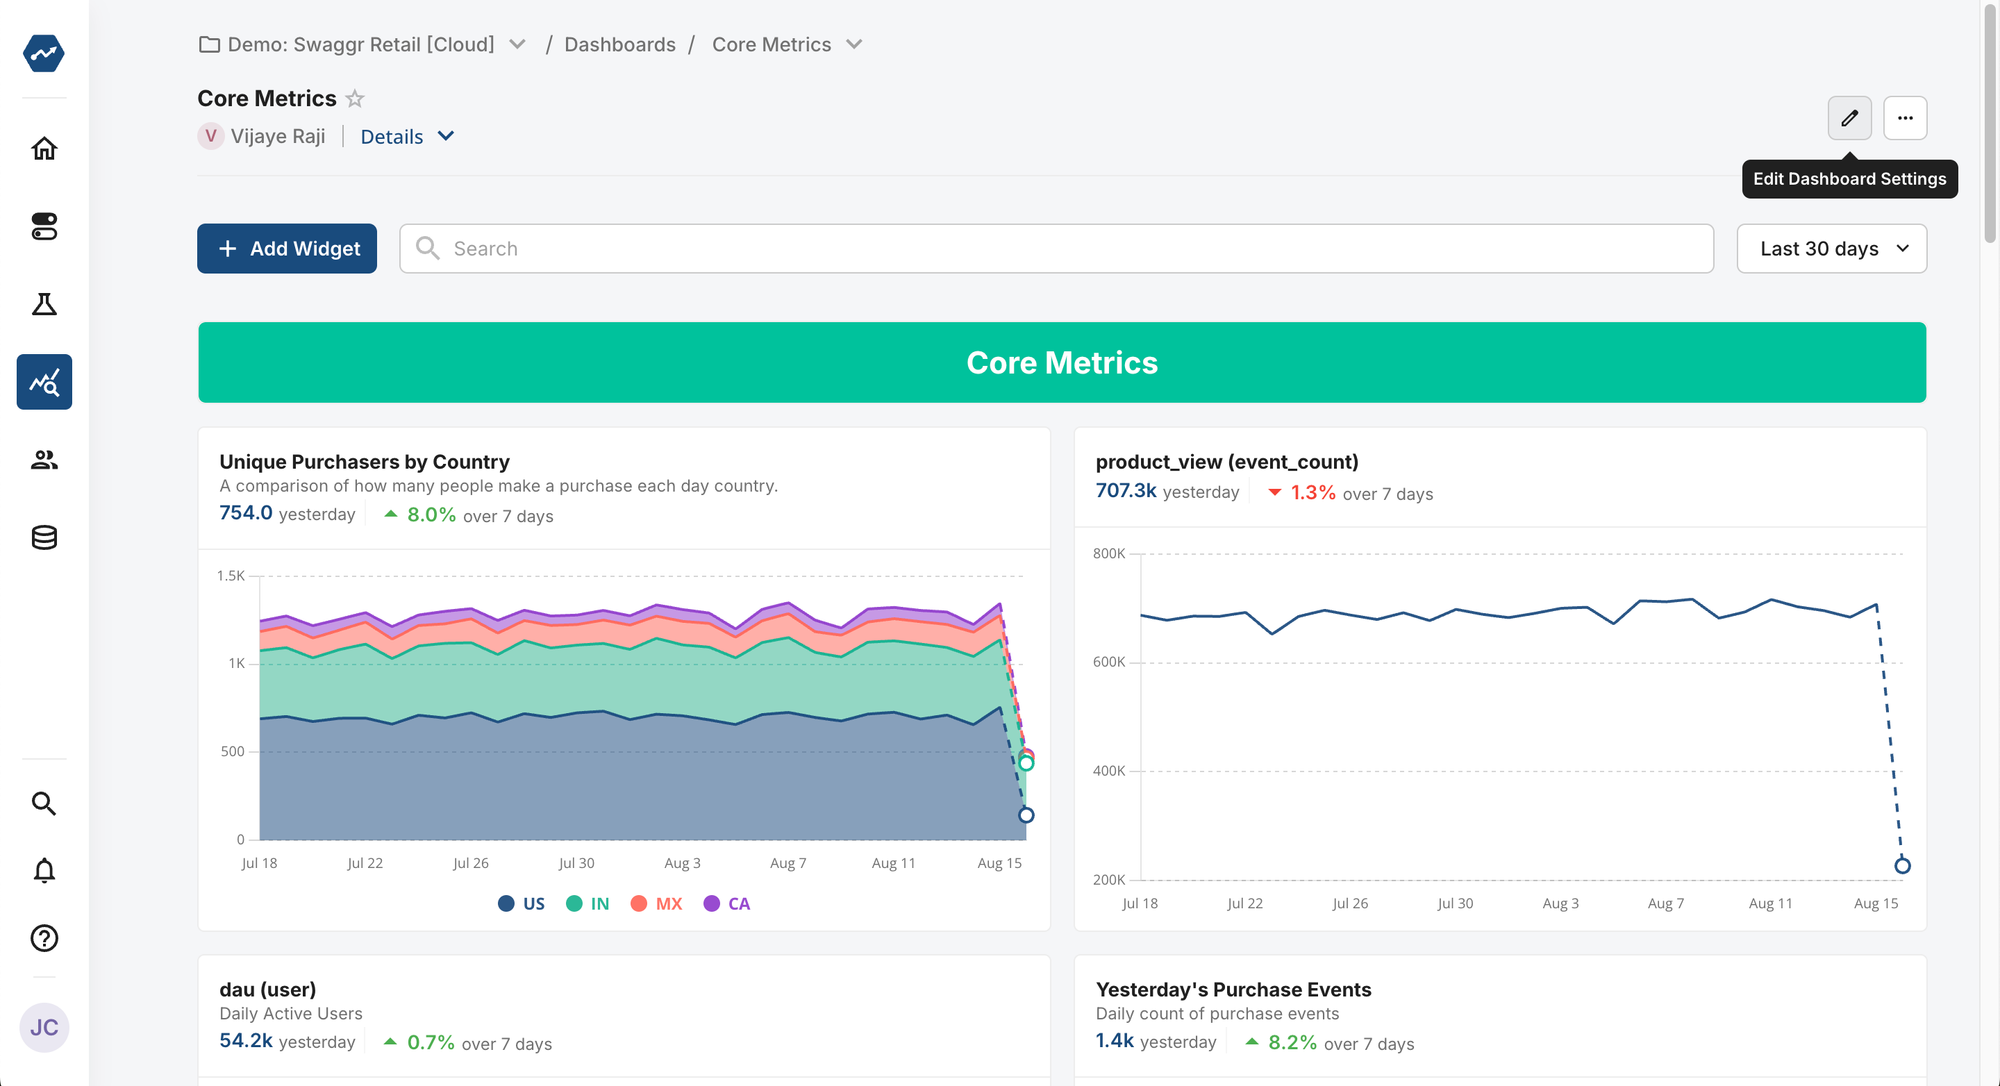
By default, Statsig syncs charts and widgets on a dashboard with the date range set for the entire dashboard. To update this default date range, click the pencil icon in the top right corner. In the settings panel, you can modify the dashboard's title, description, and Default Date Lookback Range. Statsig applies this range automatically each time you open the dashboard. If you choose Chart Default, each chart uses the date range originally set when you first added the chart to the dashboard.
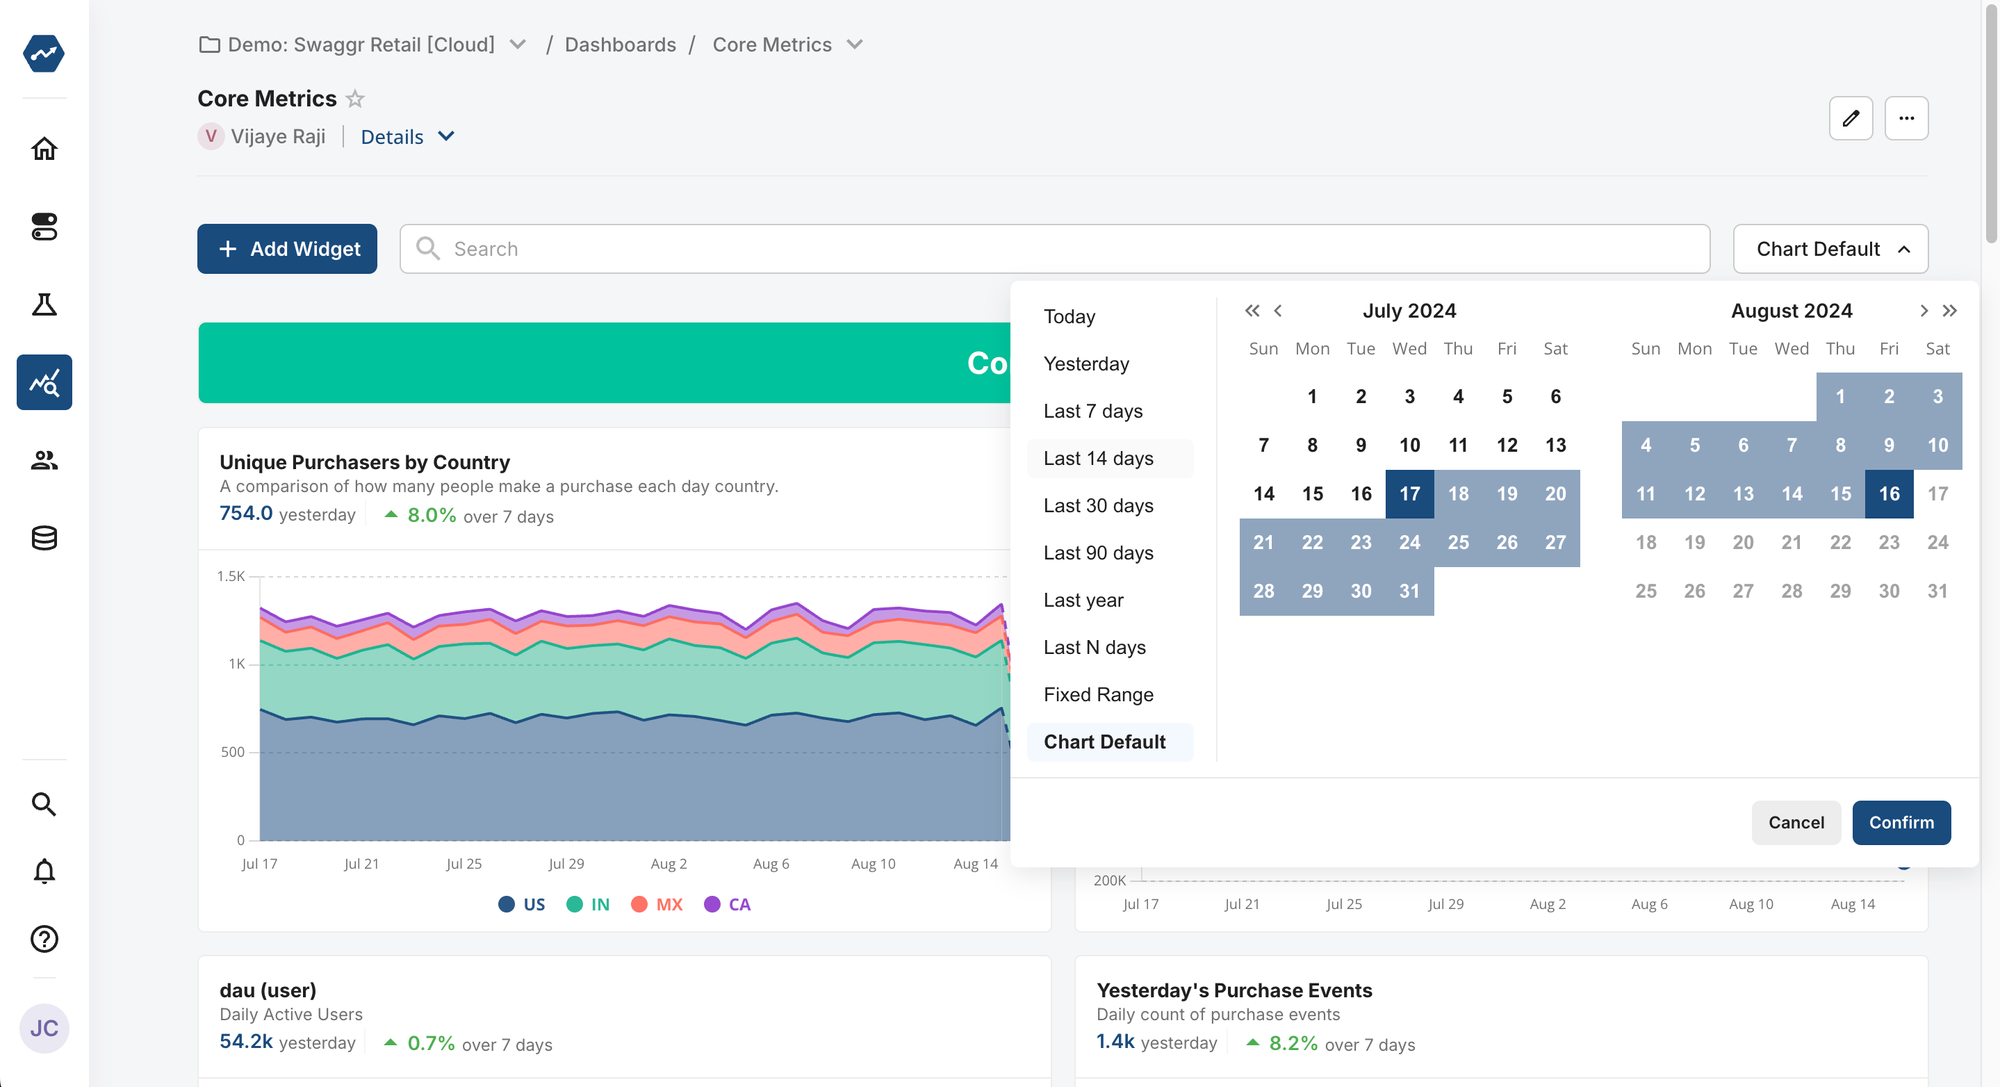
You can also change the date range dynamically by modifying the date picker at the top right of the dashboard. Changes to this selector synchronize all charts and widgets on the dashboard. Statsig doesn't save these changes when you reopen the dashboard.
Exporting your dashboard
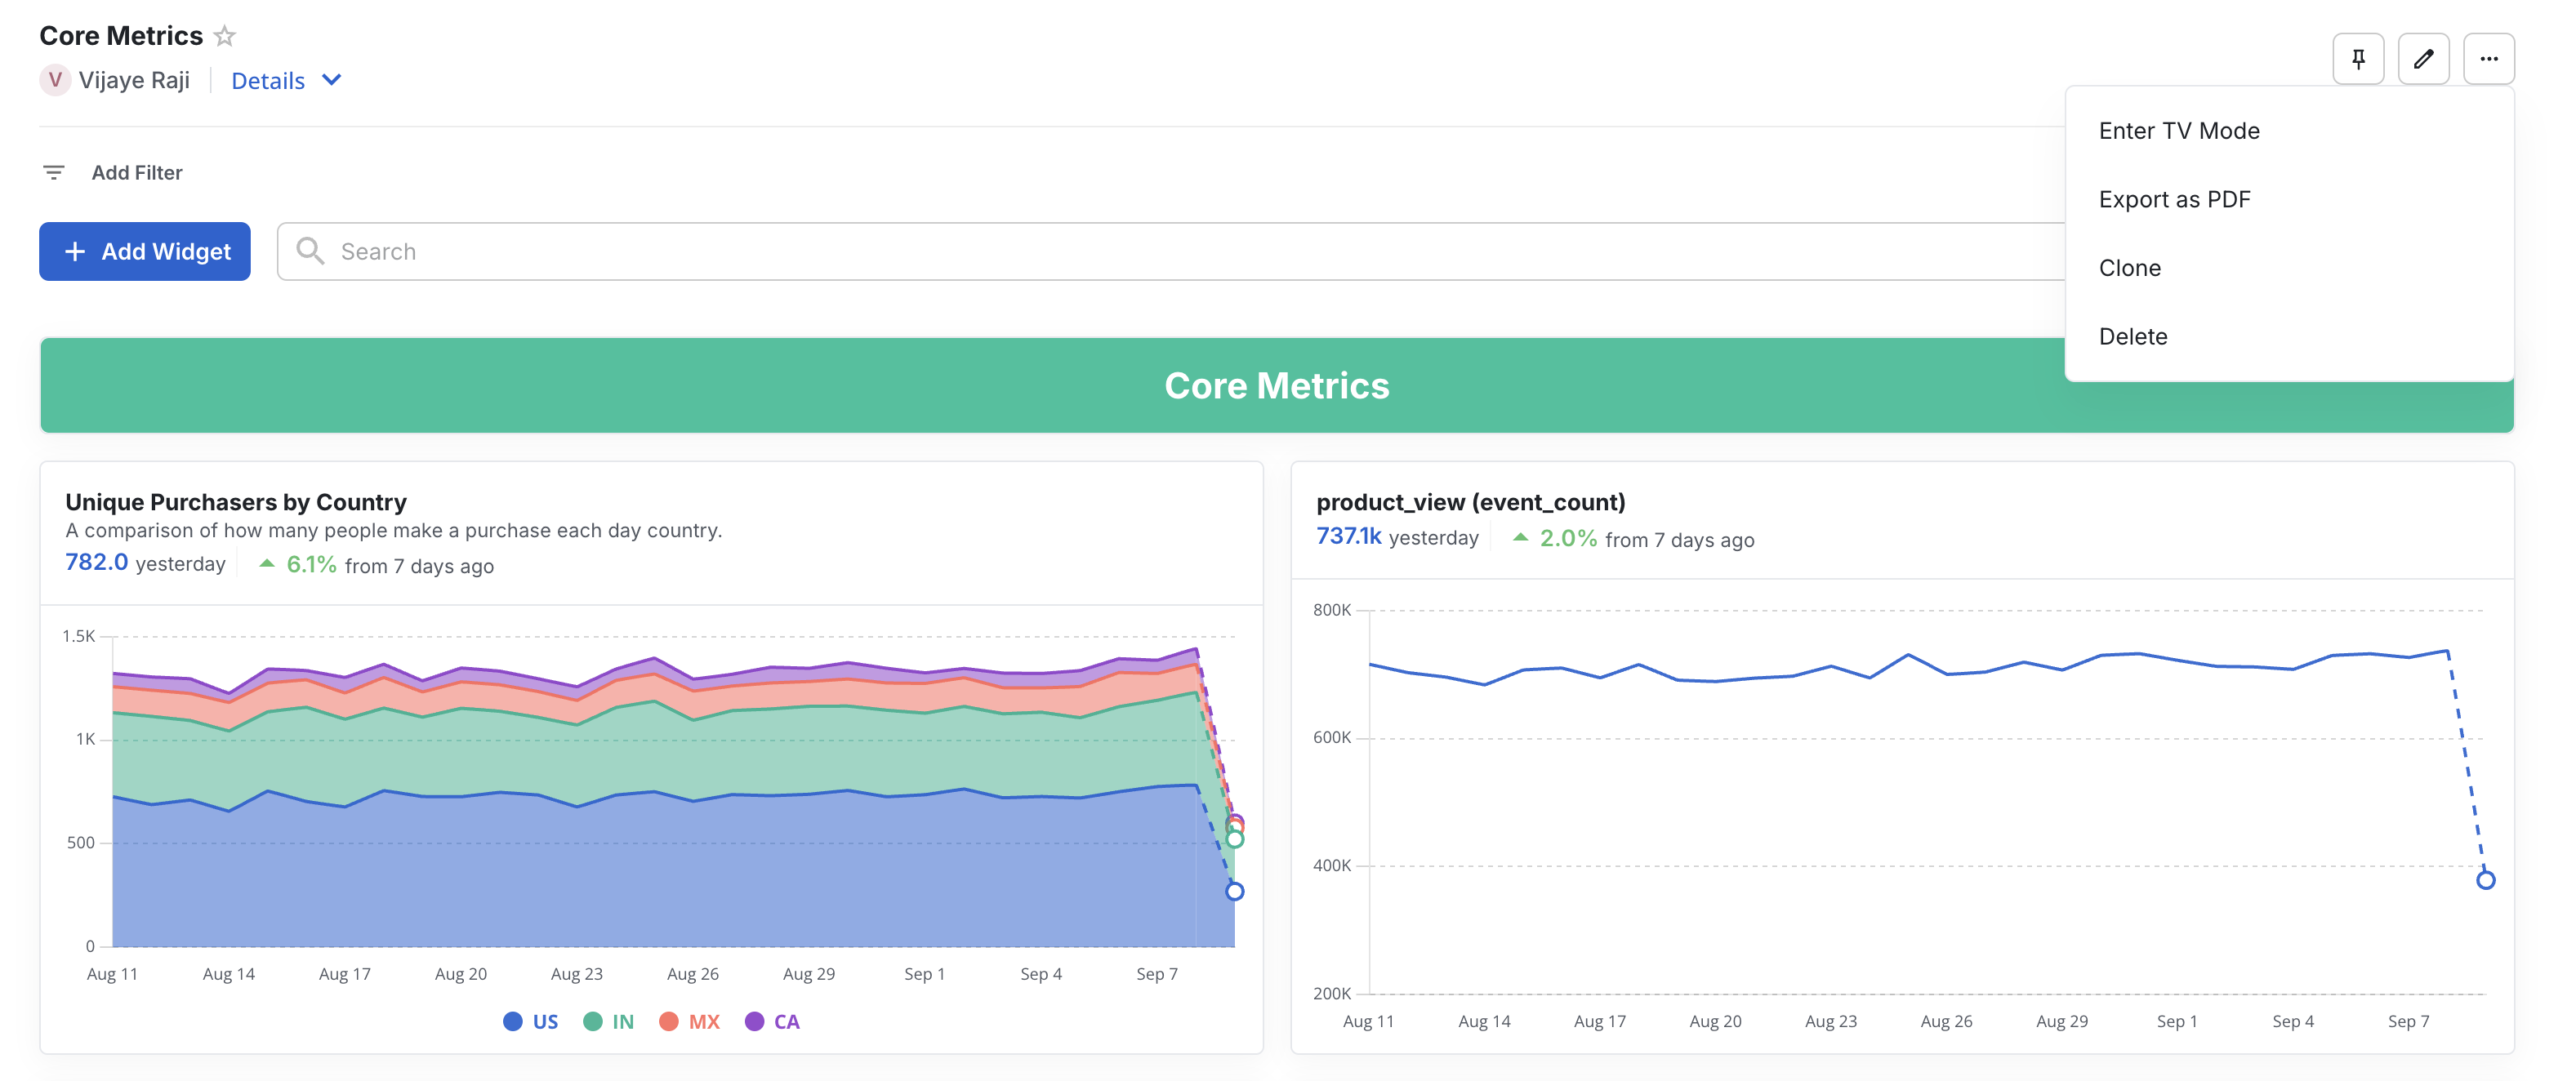
To share a static version, print, or save your dashboard, click the settings dropdown (...) in the top right corner and select Export as PDF. Statsig generates a PDF of the dashboard and downloads it automatically within a few seconds.
Cloning your dashboard
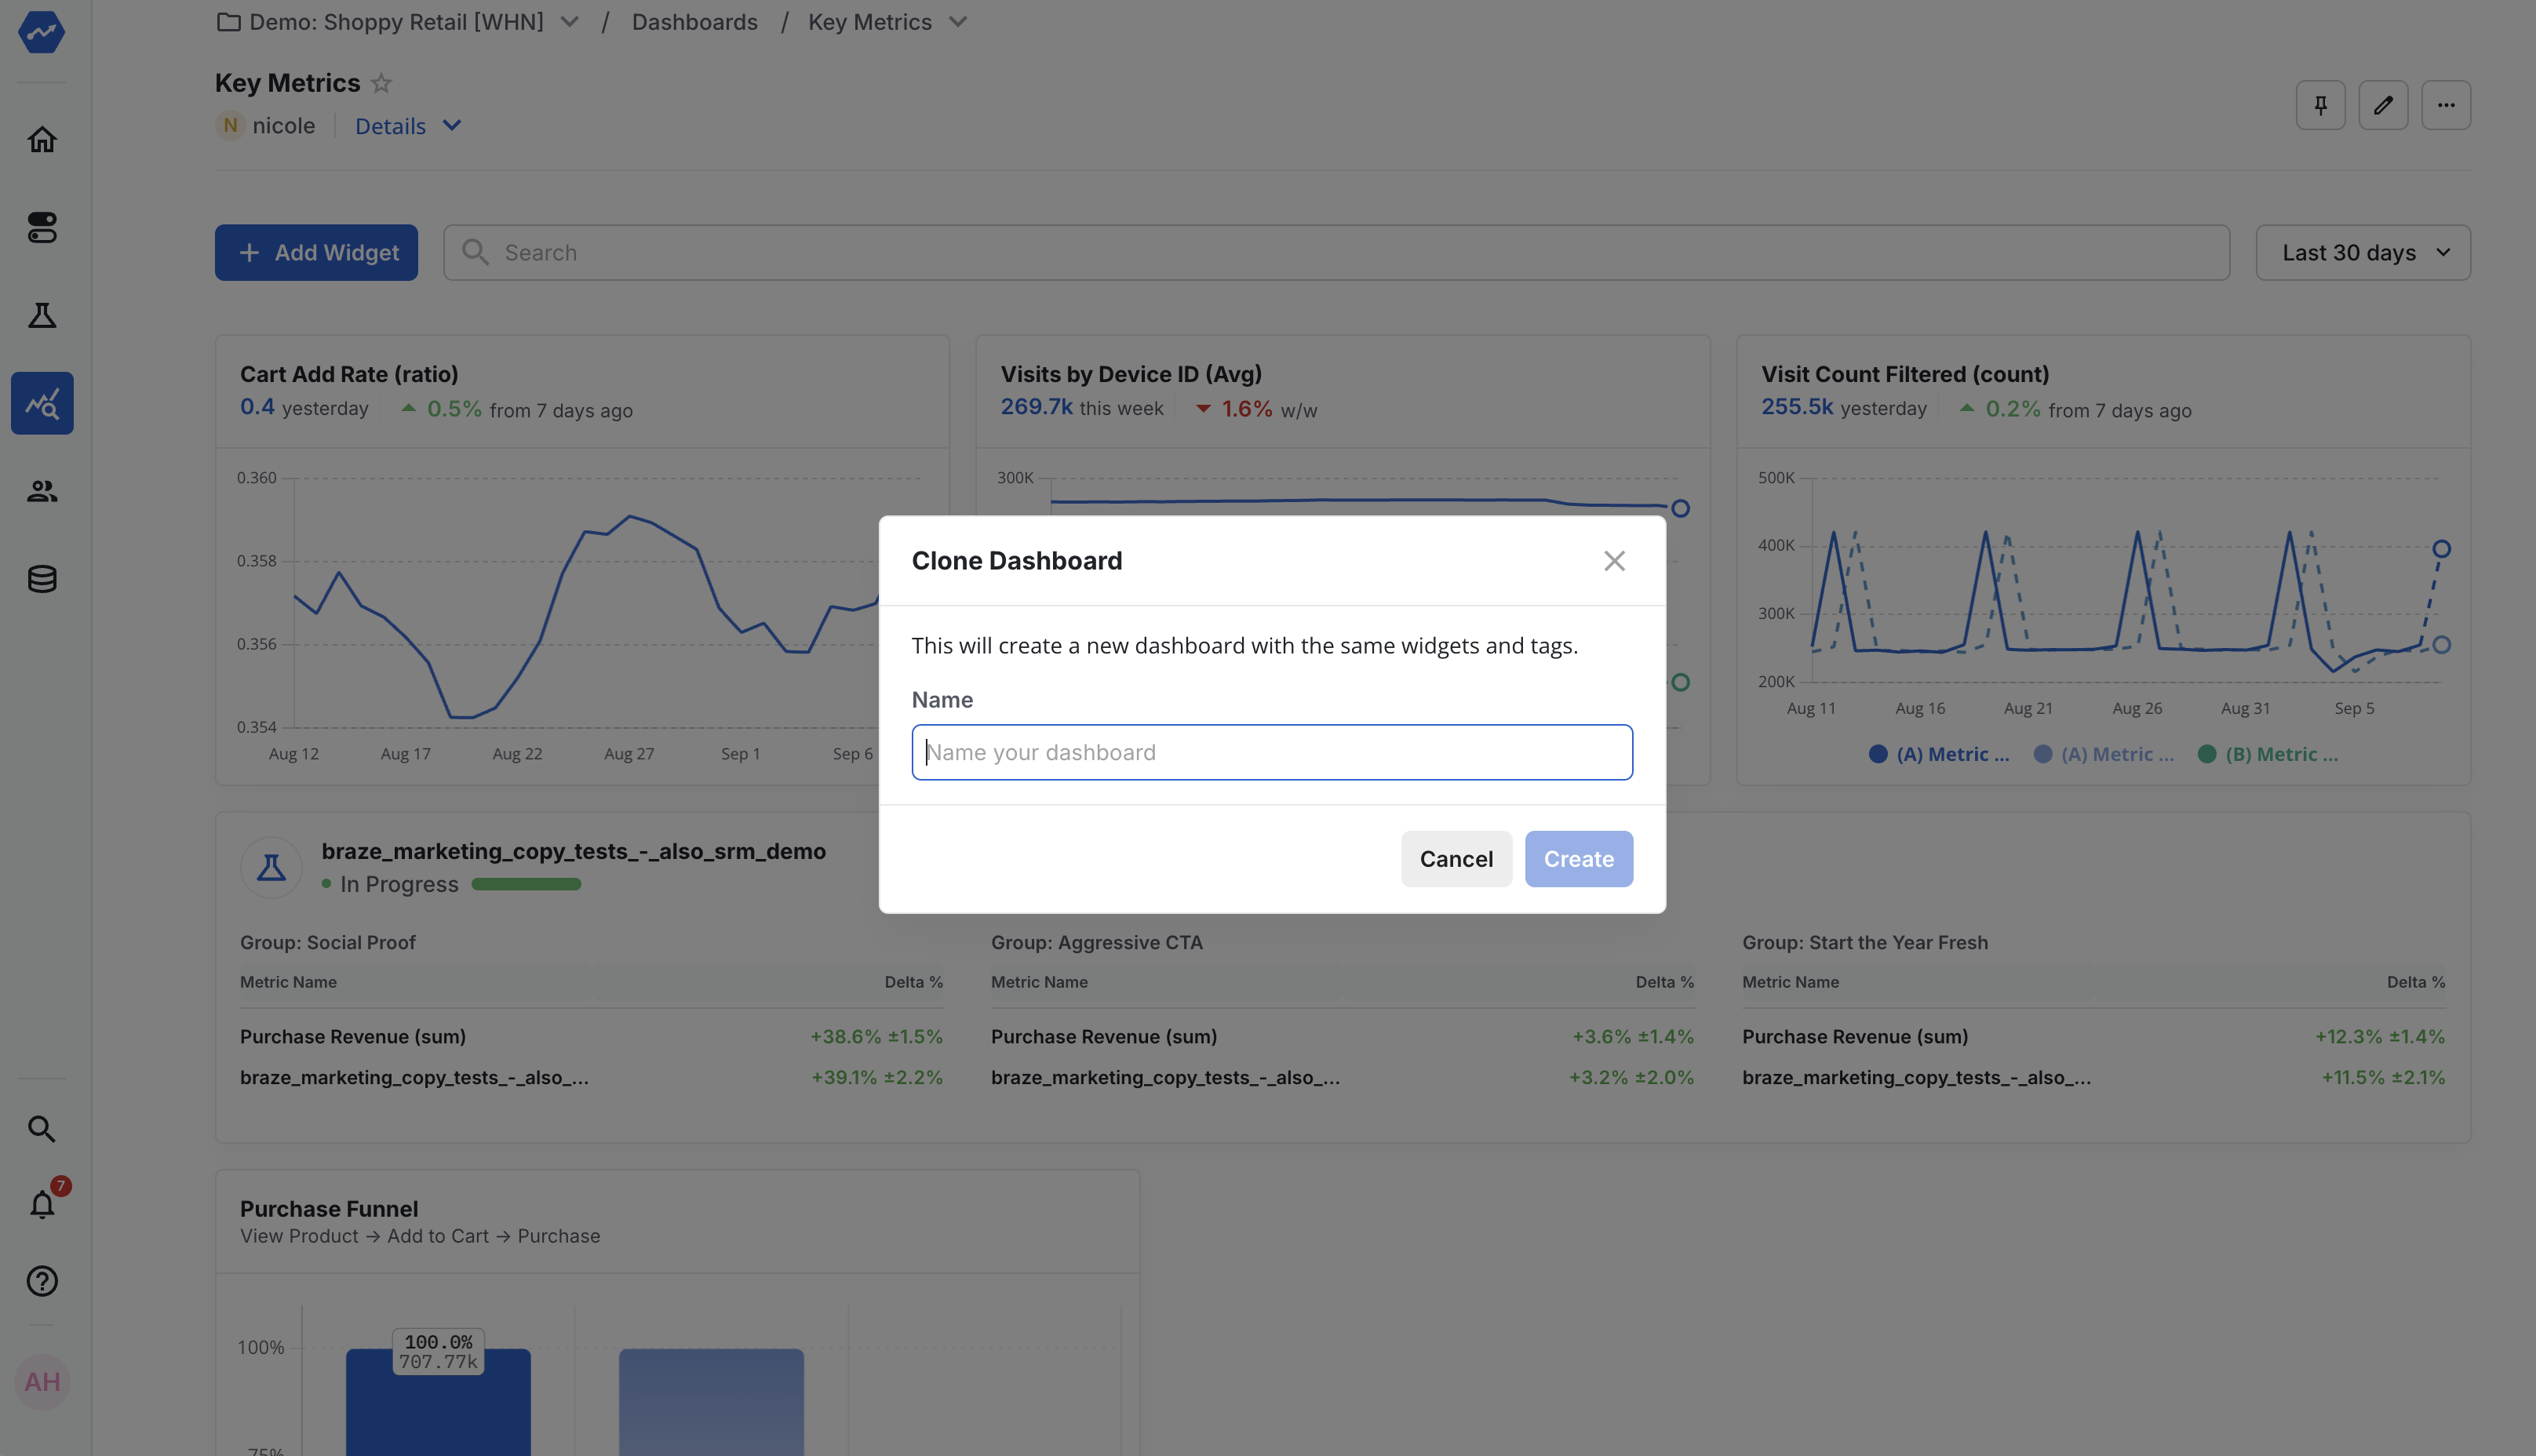
To duplicate a dashboard, open it, click the settings dropdown (...) in the top right corner, and select Clone. A dialog appears to confirm the clone. After cloning, Statsig takes you to the new dashboard.
Filtering your dashboard
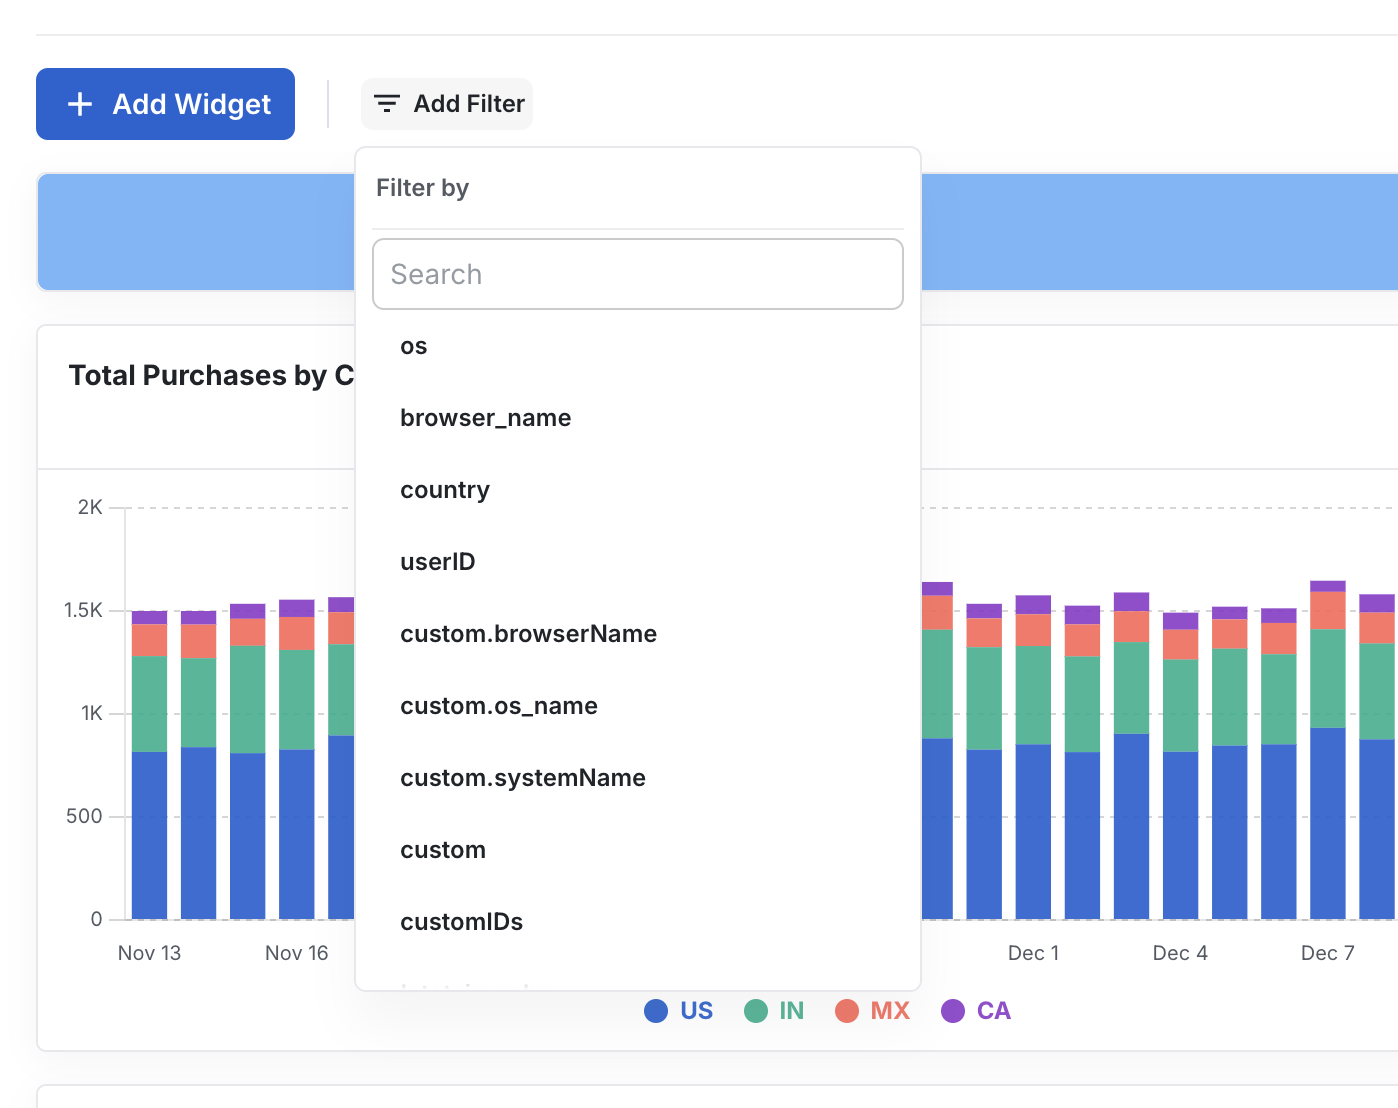
Select the filters button below the dashboard name to add a global filter. The filter applies across all eligible widgets, so you can view updated results without filtering each widget individually. You can also use free-form text to apply generic filters, such as filtering emails that contain @gmail.com.
When you expand a dashboard widget that has a dashboard filter applied, the filter appears as an Inherited Dashboard filter. Any changes you make at the widget level are temporary and Statsig doesn't save them.
Default dashboard filters
Default dashboard filters let you pin commonly used filters directly to your dashboards. These filters appear at the top of the dashboard and apply across all eligible widgets, enabling quick comparisons across dimensions like company, region, or platform, without rebuilding filters from scratch.
To configure default dashboard filters:
- Navigate to your dashboard and click the settings cog ⚙️
- Scroll to Default Filters and configure the filters you want to pin to the dashboard.
- Click Save.
After configuration, the pinned filters appear at the top of the dashboard. You can swap filter values to see how different users, cohorts, or properties affect the same set of charts. When you change a filter value, all charts update automatically. Dynamic filtering lets you reuse the same dashboard instead of duplicating dashboards or manually editing each widget's filters.
Refreshing your dashboard widgets
To ensure your dashboard data is up to date, you can refresh dashboard widgets in several ways:
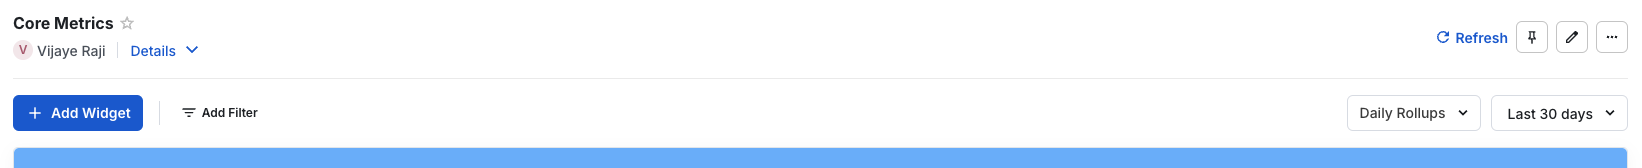
Manual Refresh: Click the refresh button shown below to refresh all dashboard widgets at once.
Automatic dashboard refreshes: Statsig can automatically refresh dashboards on a schedule. Statsig caches results for faster loading.
You can configure a refresh frequency for each dashboard (for example, hourly or daily). Queries for that dashboard run on the specified schedule and store the results. When someone opens the dashboard, the most recent cached data appears immediately without triggering fresh queries.
To configure automatic dashboard refreshes:
- Navigate to your dashboard and click the settings cog.
- Scroll to Schedule Dashboard Refresh and set the interval.
- Click Save.
This feature is useful for shared dashboards or recurring check-ins where fresh data should be ready without manual effort.
Dashboard subscriptions
Dashboard subscriptions send a scheduled snapshot of a dashboard to your team so stakeholders can stay up to date without opening Statsig.
What gets delivered: A subscription delivers a snapshot of the dashboard at send time, including:
- Dashboard title and link
- All widgets currently on the dashboard
- The dashboard’s default date range (and any pinned default dashboard filters, if configured)
Depending on your workspace setup, Statsig can deliver subscriptions by email and/or Slack.
Creating a subscription:
- Open the dashboard you want to subscribe to.
- Click the settings menu (...) in the top right corner.
- Select Add/Manage Dashboard Subscription.
- Configure your delivery channel (email, Slack), recipients (emails or Slack channel), and schedule (for example, daily or weekly).
- Click Save.
Organize your dashboard
A well-organized dashboard conveys what information is most important and shows the relationship between items. You can move and resize dashboard widgets in place.
Each dashboard uses a grid layout. To move a widget, click and hold empty space on the widget and drag it to the target position. To resize a widget, click and hold the bottom right edge and drag to the target size.
View and edit a chart in a dashboard
You can add any chart supported in Metrics Explorer to a dashboard. Dashboard charts are interactive, not static.
To explore a chart on the dashboard, click the [ ] icon. When expanded, you have access to the full Metrics Explorer and can modify the query, date range, and chart title. These changes are for exploration only and don't permanently alter the chart on the dashboard.
To save changes, configure the chart and click Save to update the existing chart, or Save As to create a new chart on the dashboard.
Tips
Dashboard templates
Dashboard templates reduce time to insights. Statsig compiles industry-standard metrics so your data visualization focuses on critical success indicators. You can start with a template and add additional charts as needed. Statsig offers the following templates:
- Product Growth
- Use Statsig's built-in metrics like DAU, WAU, Stickiness, etc. to track long-term product health
- Feature Success
- Input a feature usage event, like form_submit or purchase_completed, to evaluate the success of your feature rollout with usage and retention metrics
- Optionally, you can add a feature adoption event or related feature flag to broaden the scope of your tracking
- B2B SaaS Topline Metrics
- Input a key feature event and user subscription events to monitor product usage, user retention and subscription conversion rates over time
- Web Analytics
- Available with Autocapture, track essential web metrics like page views, clicks, and sessions duration. Go to the Autocapture guide for more information.
- Create from Gate or Experiment
- Input your Gate or Experiment of interest to generate a focused dashboard with related monitoring metrics
- Create from Tag
- Utilize Statsig's project tagging to create and easily maintain a dashboard with the metrics, experiments, and feature flags you care about
Finding dashboards
After you create a dashboard, the Dashboards tab offers several ways to find it:
- In the Dashboards tab, click the search box and select My dashboards to find dashboards you created.
- In the Dashboards tab, click the filter icon to scope to dashboards with specific tags or created by specific team members.
- In the Dashboards tab, search for the dashboard name.
- Anywhere in Statsig, open global search with cmd+k and type the dashboard name.
Was this helpful?