Topline Alerts
Get notified when metrics shift beyond a fixed threshold or relative change in value.
This feature is in Early Access. During this time, aspects of the functionality may still be developed, and this documentation may not always be up to date. If you have any questions, contact Statsig Support.
Topline Alerts watch an event or metric you choose and notify you when its value crosses a fixed threshold or changes beyond an amount you set. Use them to catch shifts in metrics like P90 latency or usage as they happen, and route notifications to email, the Statsig Console, and Slack.
Contact Statsig to enable Topline Alerts for your project.
Topline Alerts are available in Statsig Cloud and Statsig Warehouse Native with support available for three types of Topline Alerts:
| Alert Condition Type | When to Use | Example |
|---|---|---|
| Threshold | Use when you want to stay above or below a fixed number. | “Alert me when P90 latency spikes above 15 seconds.” |
| Change | Use when the absolute size of the change matters. | “Alert me when hourly P90 latency increases by 10 seconds.” |
| Change (%) | Use when the relative size of the change matters more than raw numbers. | “Alert me when hourly P90 latency increases by 50%.” |
Creating a topline alert
Navigate to Topline Alerts
Go to Analytics → Topline Alerts in the product menu.
Create a New Alert
Click +Create and give the new alert a name.
Select the Event or Metric Source
Pick the data you want to monitor.
- On Statsig Warehouse Native: Select a Metric Source, filter, and group by the dimensions you want.
- On Statsig Cloud: Select the event, aggregation, filters, and group-by conditions for this alert.
This example sets up an alert to monitor P90 latency for
mex_queryevents, filtering out internal employee queries and grouping by thehadGroupBydimension.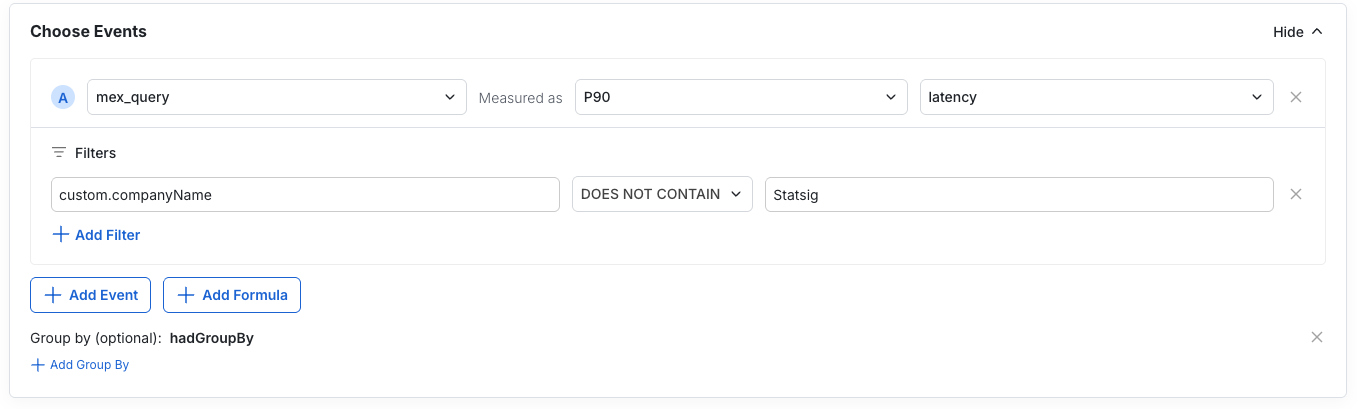
Review the Alert Preview
The preview shows how your metric is trending with the current setup. Confirm values look correct, or open the metric in Metrics Explorer for deeper analysis.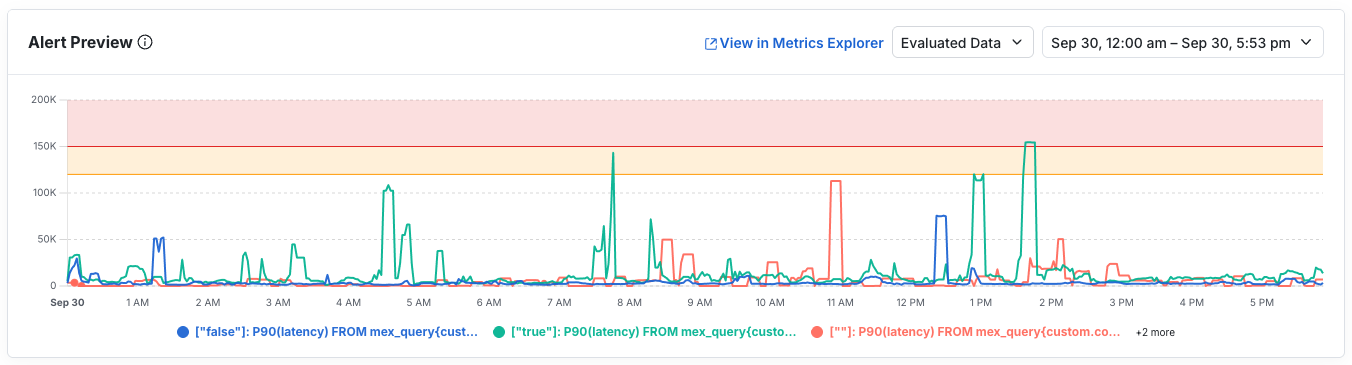
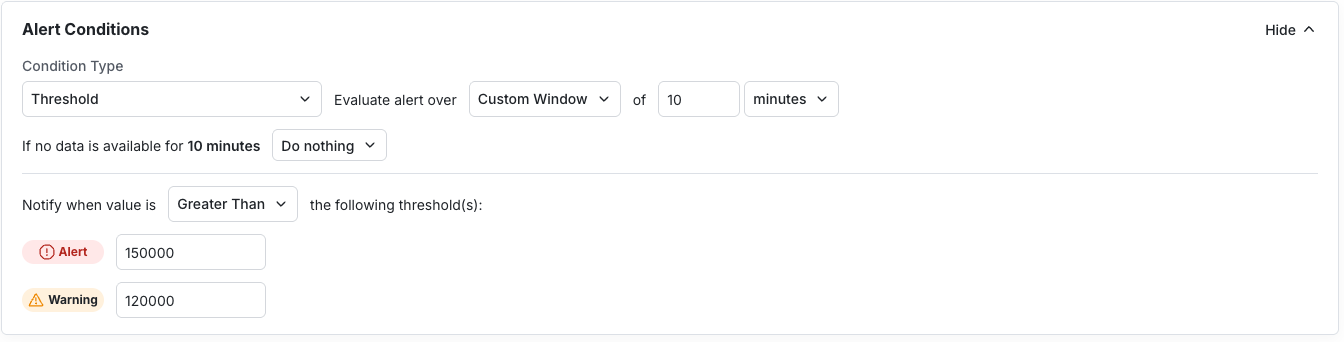
Set Alert Conditions
The preview updates along with each change. Define the:
- Condition type (threshold, change, change %)
- Directionality
- Alert and Warn values
- Evaluation window
On Warehouse Native: Define the evaluation frequency, lookback, and max delay. These values directly influence warehouse compute costs.
Add Notifications
Notifications go to email, the Statsig Console, and Slack (if connected). Project-wide defaults live in Settings.
- Draft a clear, actionable message subscribers receive when the alert fires.
- Add subscribers.
- Set alert priority.
- Configure re-notification rules if alerts should resend while conditions hold.
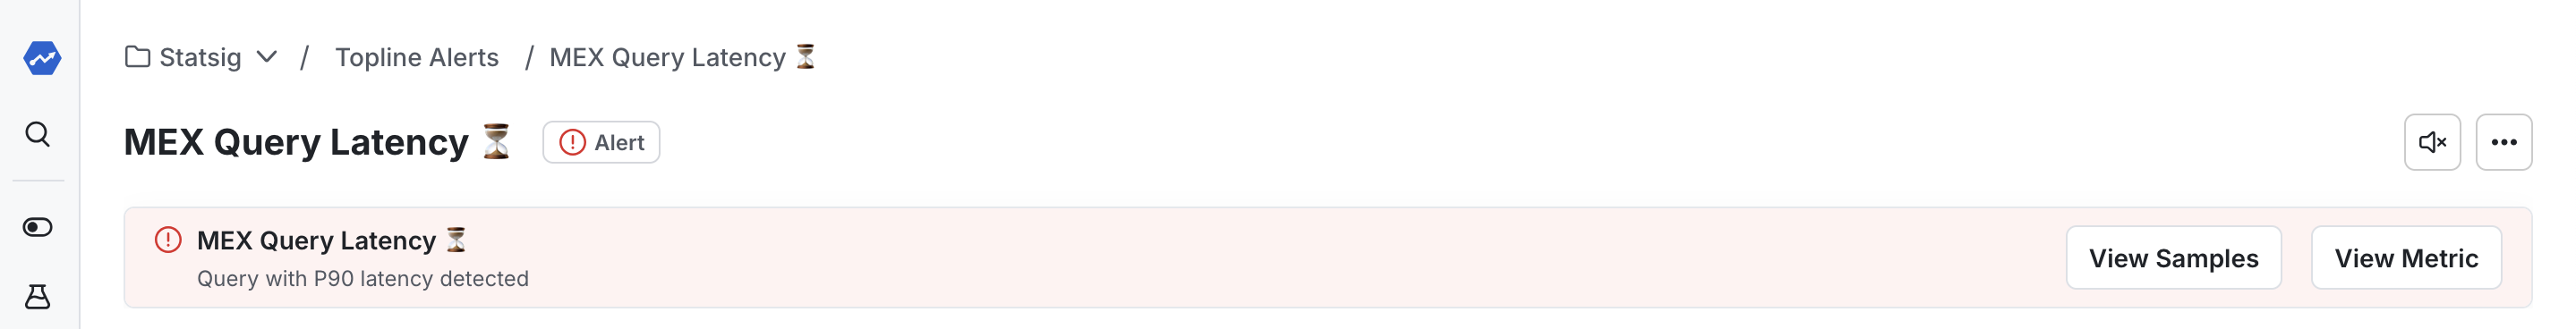
Save and Monitor
After saving, triggered alerts appear at the top of the page. From here you can:
- View samples of the event.
- Open the trend in Metrics Explorer.
- Mute the alert temporarily if it's noisy or already under investigation.
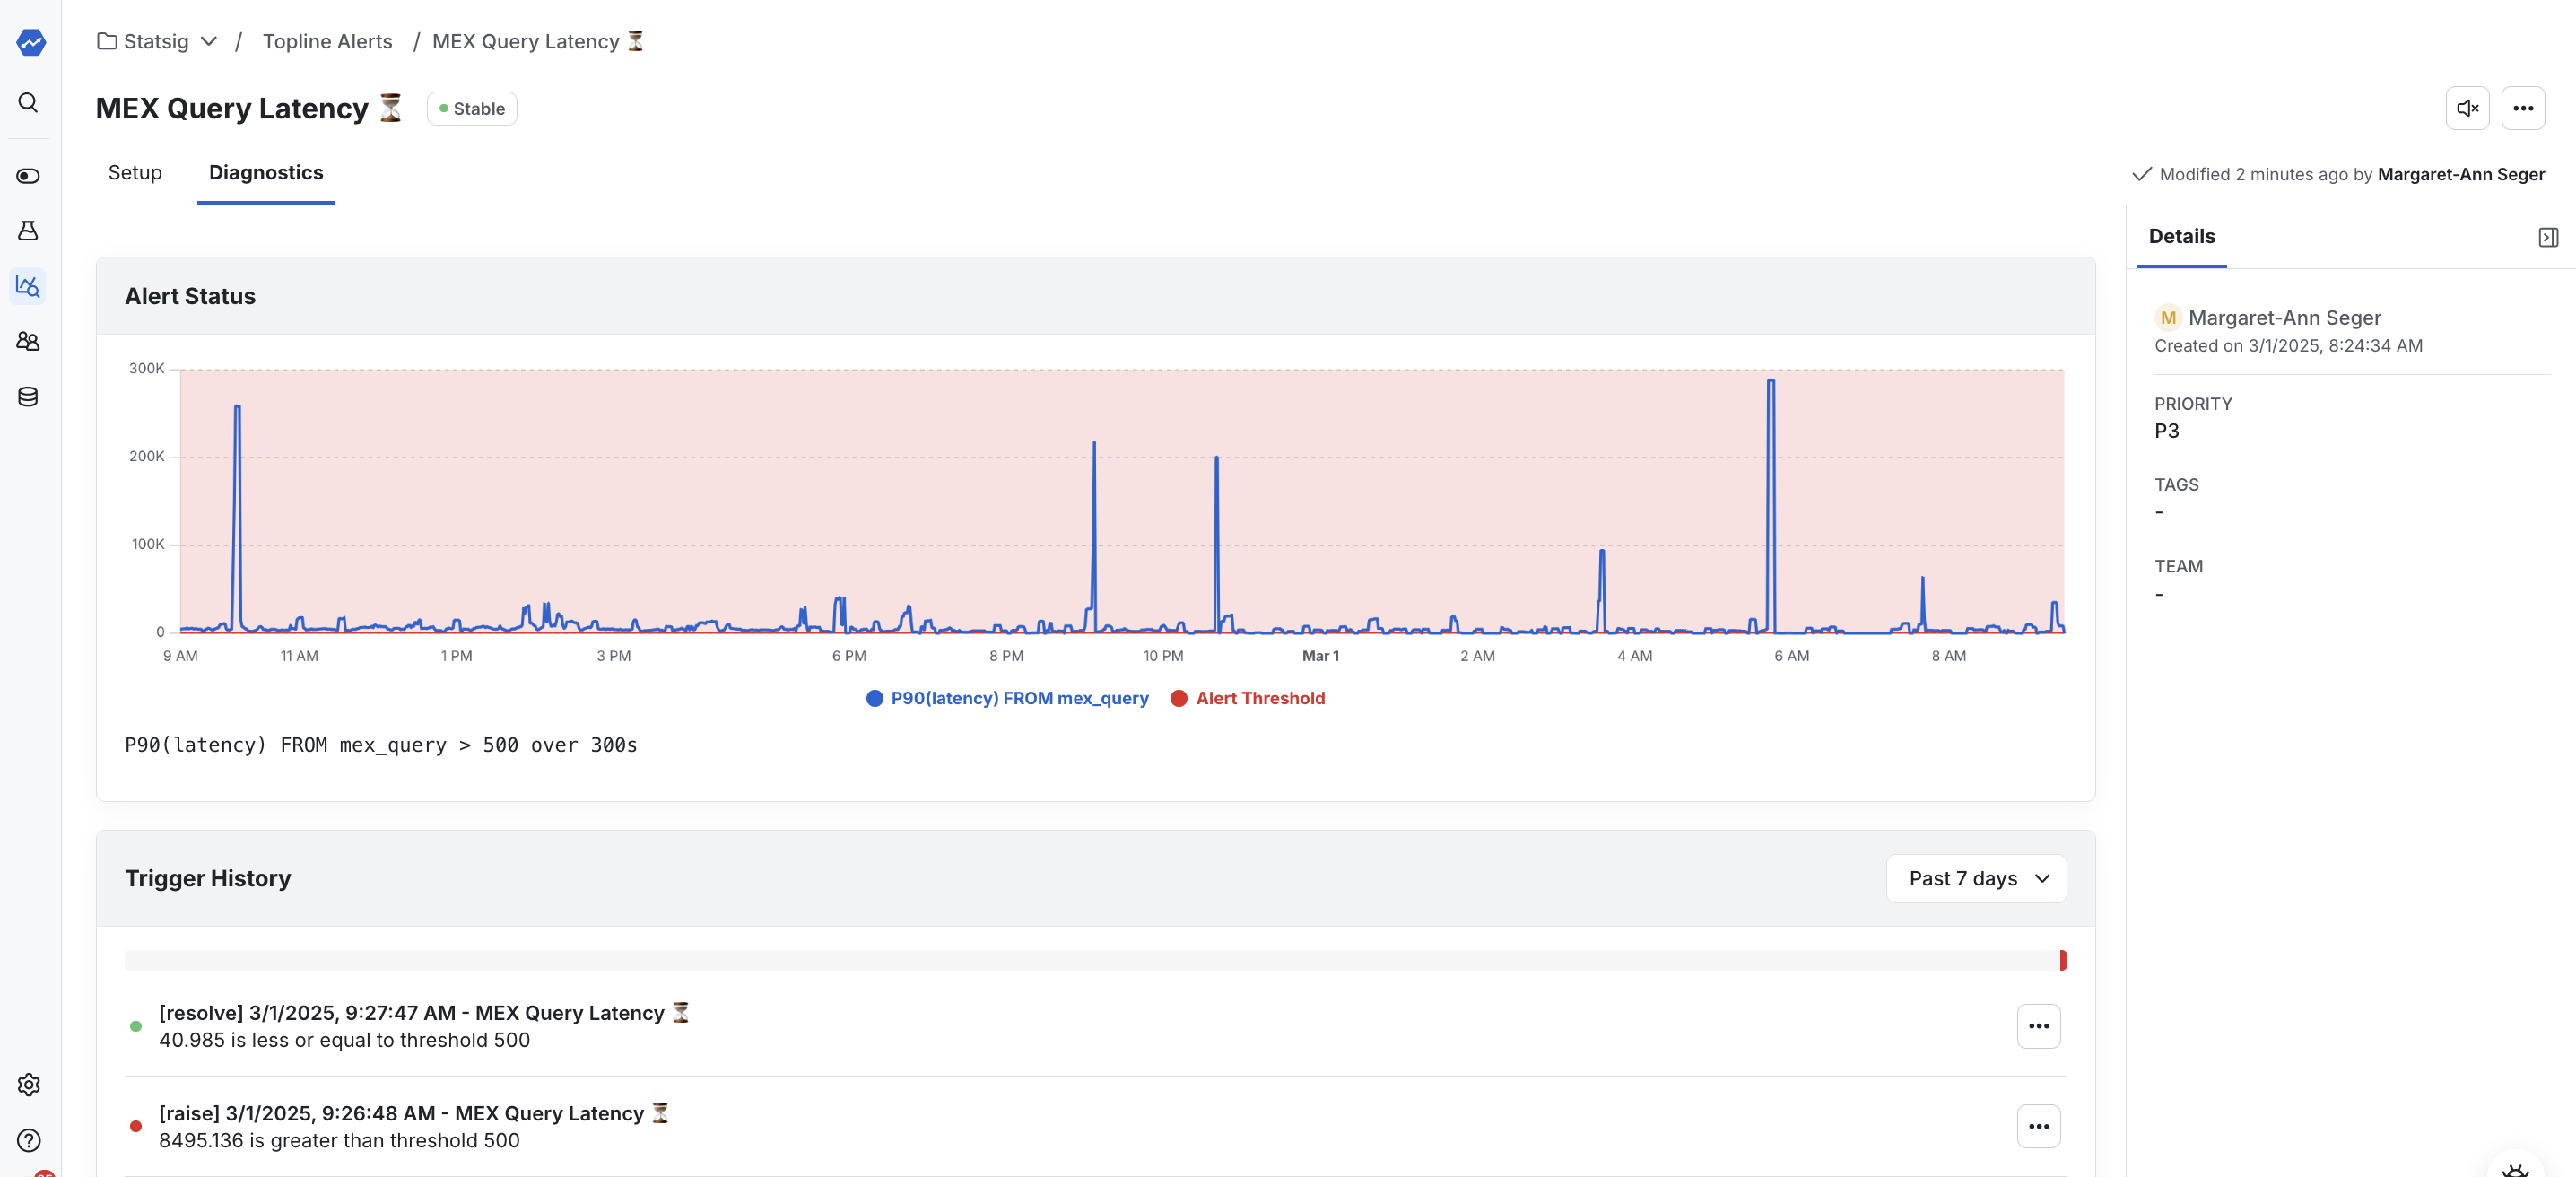
Diagnostics
Navigate to the Diagnostics tab to review alert history, inspect samples, open Metrics Explorer, or mute noisy alerts.
Related resources
Was this helpful?