Topline Alerts with Logs
Detect infrastructure regressions by evaluating logs in real time
When to use log-based alerts
- Monitoring success rates: Catch regressions before they impact SLOs.
- Detecting error spikes: Trigger when 5xx or other errors rise above baseline.
- Isolate by segment: Identify failures concentrated in a region, client, or device type
Create a log-based Topline Alert (Statsig Cloud)
This example creates a monitor for the success rate of a GET request.
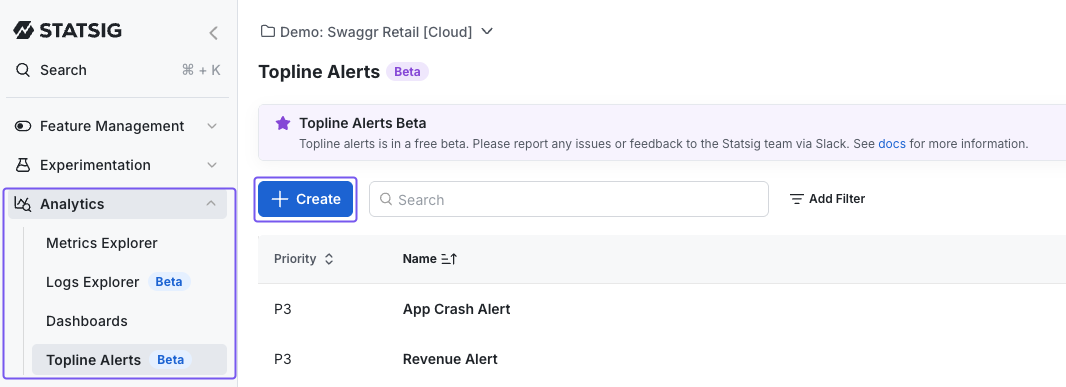
Navigate to Topline Alerts
- Go to Analytics → Topline Alerts in the product menu.
- Click +Create.
- Enter a name for your alert.
Define Alert Criteria
- Select
statsig::log_lineas your event. - Apply filters to define what constitutes success and failure.
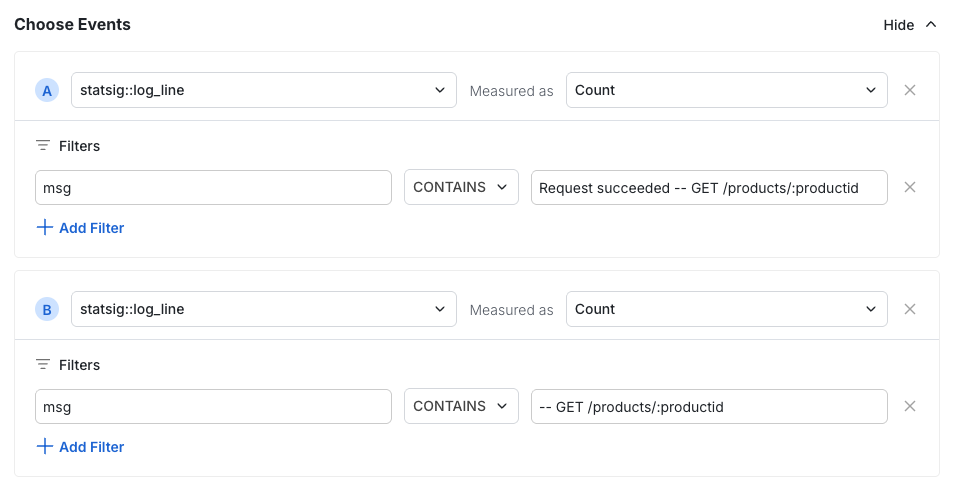
- Select
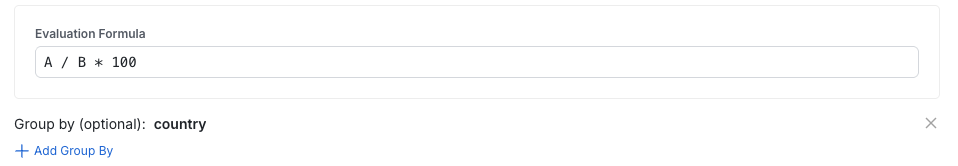
Set Up Evaluation Formula
- Define the formula for calculating your success rate.
- (Optional) Add a group-by dimension.
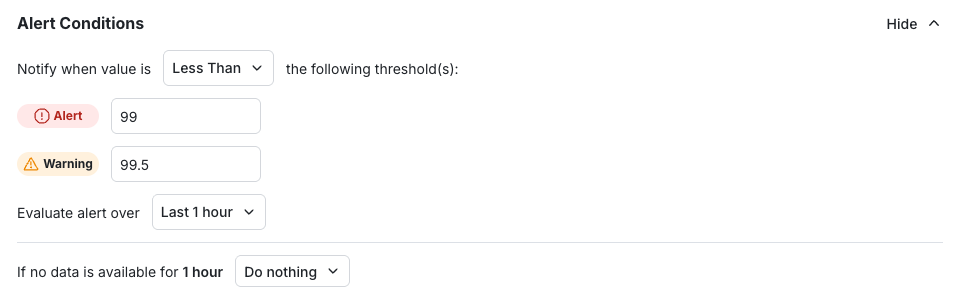
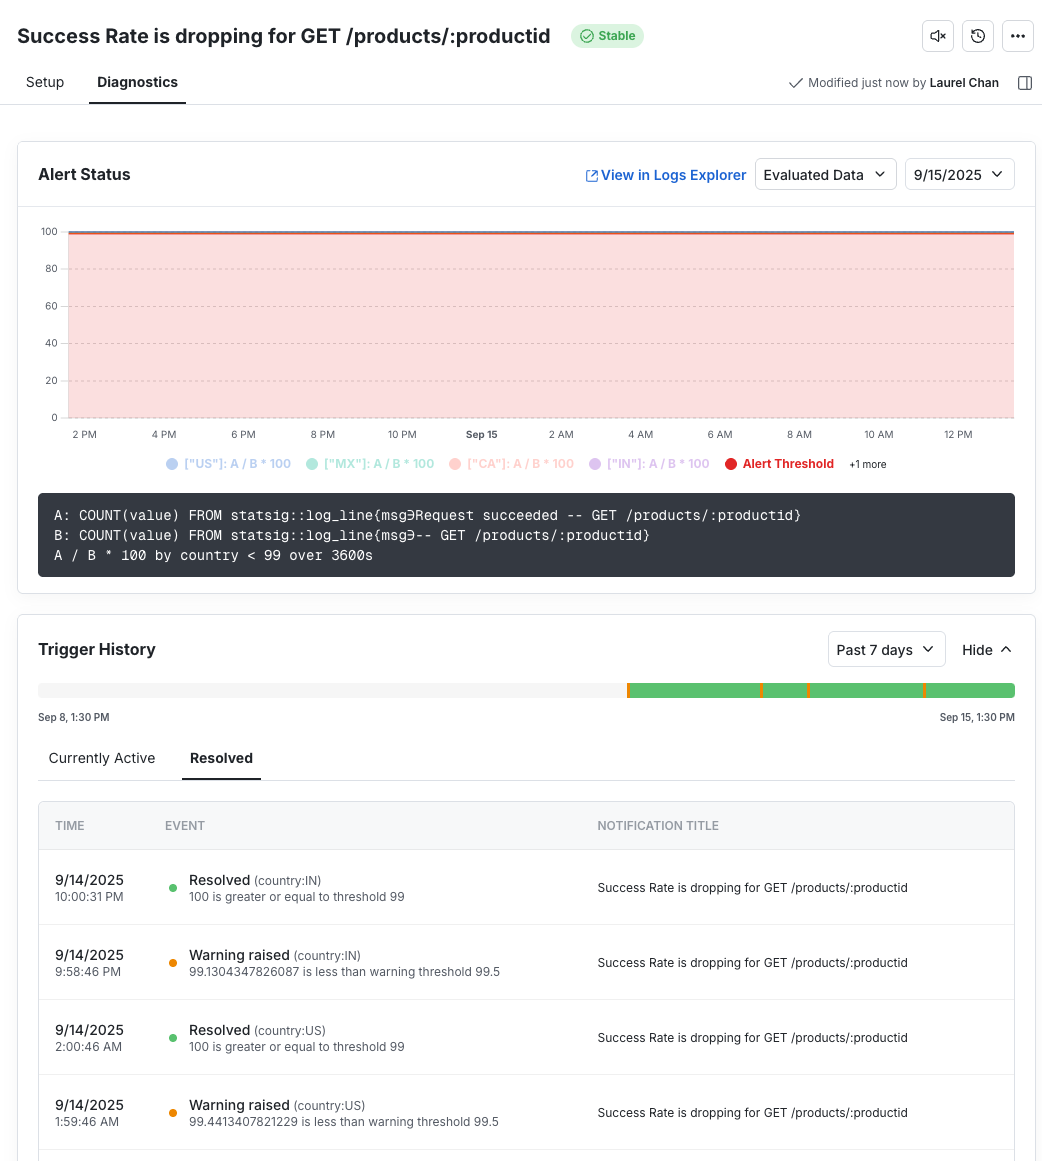
Configure Alert Thresholds
- Set thresholds and the evaluation window.
In this example, Statsig triggers a warning when success rate drops below 99.5% and an alert when success rate drops below 99.0%.
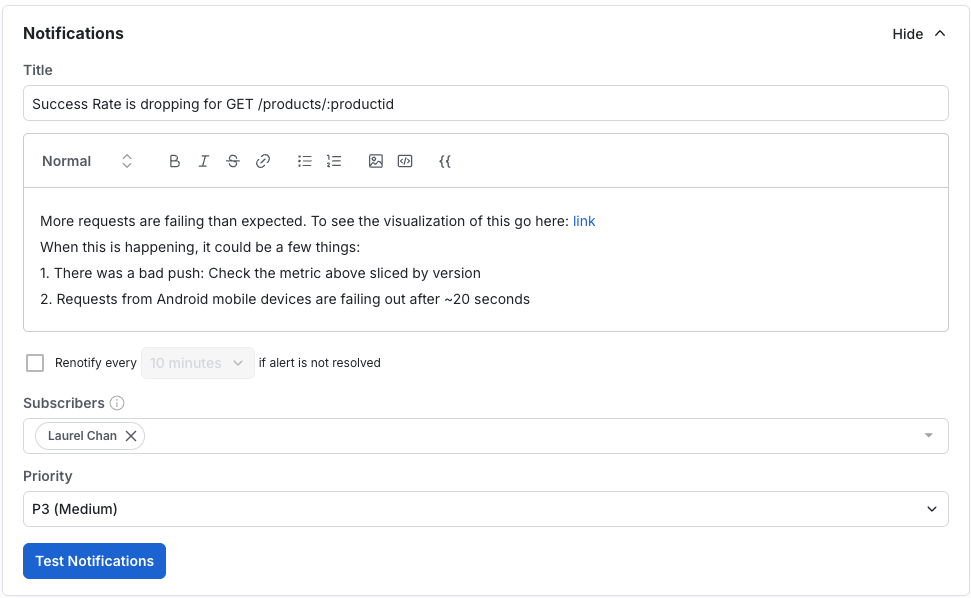
Configure Notifications
- Add the alert title and description for context.
- Include diagnostic hints (e.g. "Check version X" or "Android requests timing out").
- Add subscribers.
- Set priority.
Save the Alert
- Click Save.
- After you save your alert, visit the Diagnostics tab to view a history of alert triggers.
Best practices
- Set up Slack notifications for team visibility
- Keep formulas simple (ratios & percentages are easiest to scan)
- Add group-by dimensions (like country or app version) to pinpoint where issues occur
- Write clear notification text that explains what the alert means
Was this helpful?