Running an A/A Test using Sidecar
Learn how to run an A/A test with Statsig Sidecar to validate your experimentation setup and metrics configuration.
Statsig Sidecar runs an A/A test directly on your website: both variants apply the same change, so any difference in results points to a setup problem rather than a real effect. Run an A/A test to validate a new experimentation engine and confirm your metrics and exposures are configured correctly before your first real A/B test.
This guide assumes you have successfully set up and configured Statsig Sidecar. For a step-by-step guide, go to “Setting up Sidecar”.Why run an A/A test
The most common reason to run an A/A test is to validate a new experimentation engine you're integrating with, such as Statsig. For new users, running an A/A test first provides a low-stakes environment. You can confirm that you set up your metrics correctly and that exposures are recorded as expected before you start your first real A/B test.
How to run an A/A test
Step 1: Create a new Experiment in Sidecar
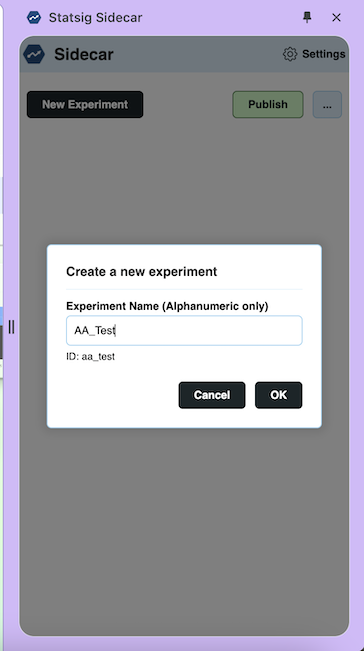
Navigate to the page on your website where you want to run an A/A Test. Open the Statsig Sidecar extension and select New Experiment. Fill in the title of your A/A test.
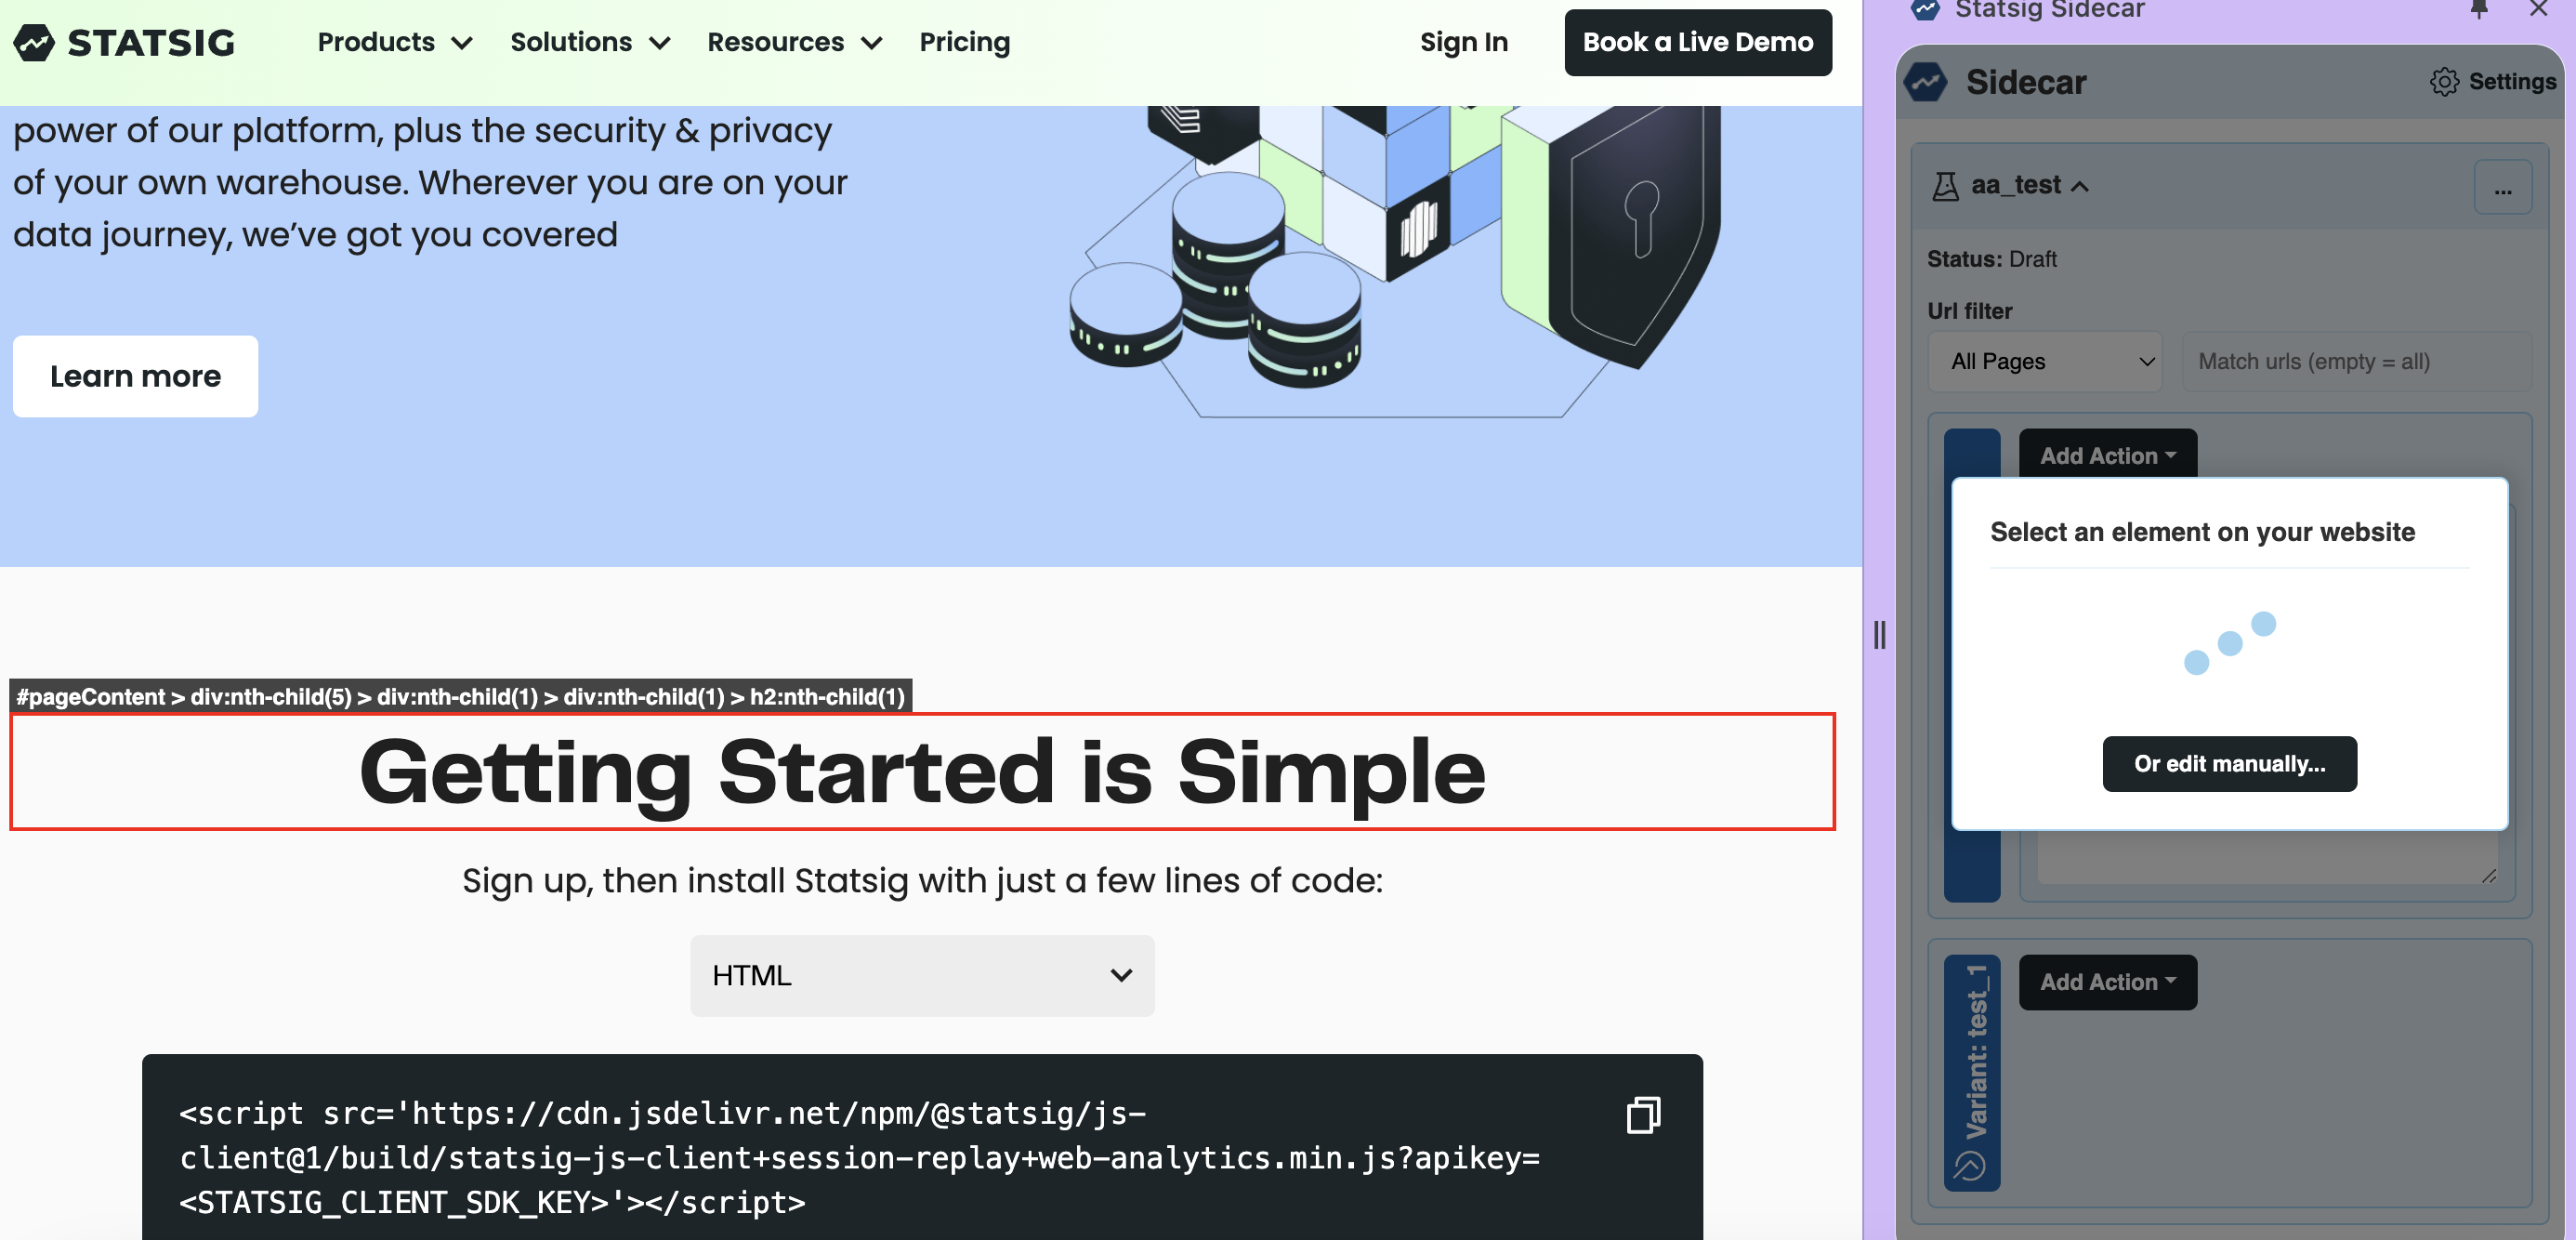
Then, determine the URI filter (for example, All Pages, contains). After you configure the URI, set up the variants.
For the variant 'Control', choose an action. In this example, the action changes the content of an element: specifically the title 'Getting Started is Simple'.
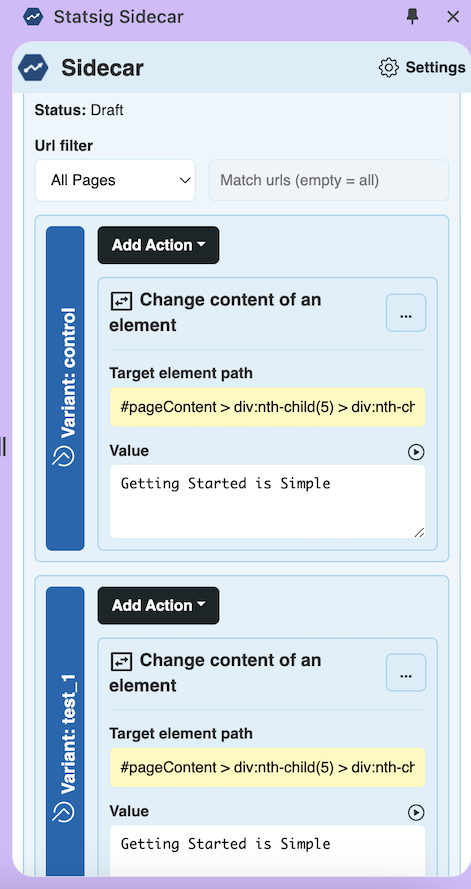
Repeat the Control configuration for the variant 'Test', using the exact same action. Your setup should match the following.
Select Publish to push the experiment to Statsig as a draft.
Step 2: Configure experiment scorecard in Statsig console
After Sidecar pushes the experiment to end users, edit the scorecard for your experiment in the console. Navigate to the console, select the Experiments tab, and open the experiment you just created.
In the Setup tab, fill out the scorecard with the experiment hypothesis and any primary metrics you want to monitor. Statsig shows results for all your metrics, but these key metrics represent your hypothesis. When you establish a hypothesis upfront, the experiment improves your understanding of users rather than providing data points to support a predetermined decision.
In the Allocation and Targeting section, for an A/A test, allocate 100% of users to the experiment while targeting everyone.
Save and push your experiment. Your test is now ready to start measuring metrics associated with the A/A test.
Step 3: Review A/A test results
Within 24 hours of starting your experiment, cumulative exposures appear in the Pulse Results tab of your experiment.
The Pulse Results tab shows a breakdown of your logged exposures and their distribution. If the distribution looks incorrect, check the Diagnostics tab for more granular, day-by-day exposure breakdowns at both the Checks and User level.
In the Scorecard panel, you can see the full picture of how all your tagged metrics perform.
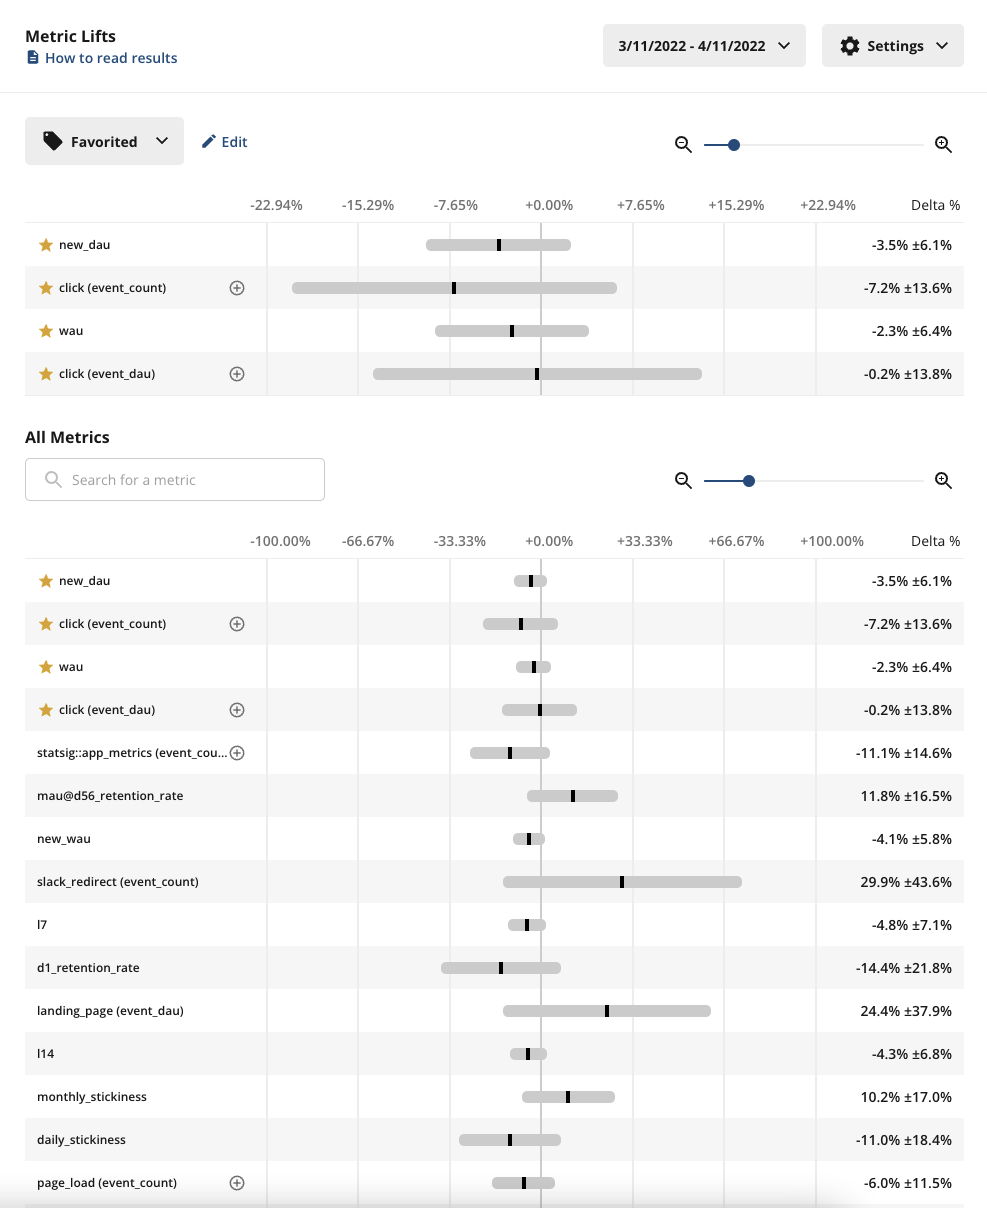
What to expect:
- Exposures: Confirm that exposures are flowing through as expected from your product. If exposures are missing, use the Diagnostics tab and the Exposure Stream to debug.
- Pulse results: About 5% of your metrics in Pulse should show a statistically significant change, because Statsig’s stats engine uses a 95% confidence interval.
Run your A/A test long enough to reach most of your weekly active users, or at least one week.
Was this helpful?