Power Analysis
Learn how to use Statsig's Power Analysis Calculator to determine experiment parameters needed for statistically significant results.
What is power analysis
The Statsig Power Analysis Calculator helps determine the experiment parameters needed to reach a statistically significant result before an experiment runs. The most common variable to optimize is duration (how long your experiment runs), but the power calculator supports other variables as well. Using the known mean and variance of a metric and the observed traffic volume, the Power Analysis Calculator estimates the relationship between three variables:
Minimum detectable effect (MDE): The smallest change in the metric that the experiment can reliably detect. For example, suppose you set an MDE of 1% with Power at 80%. If there's a true effect of 1% on the metric, the experiment has an 80% chance to produce a statistically significant result. If the magnitude of the true effect is smaller than 1%, the experiment is less likely to produce a statistically significant result (though it can still occur).
Number of days or exposures: How long the experiment is active and the number of users enrolled in it. Longer running experiments typically have more observations, leading to tighter confidence intervals and smaller MDE. Statsig uses historical data to estimate the number of new users eligible for the experiment each day.
Allocation: The percentage of traffic that participates in the experiment. Larger allocation leads to smaller MDE, so allocating as many users as possible is often preferable for faster or more sensitive results. When there's a risk of negative impact or a need for mutually exclusive experiments, it's useful to know the smallest allocation that can achieve your target MDE.
Many experimentation practitioners use the Power Analysis Calculator during setup of every experiment.
Using the power analysis calculator
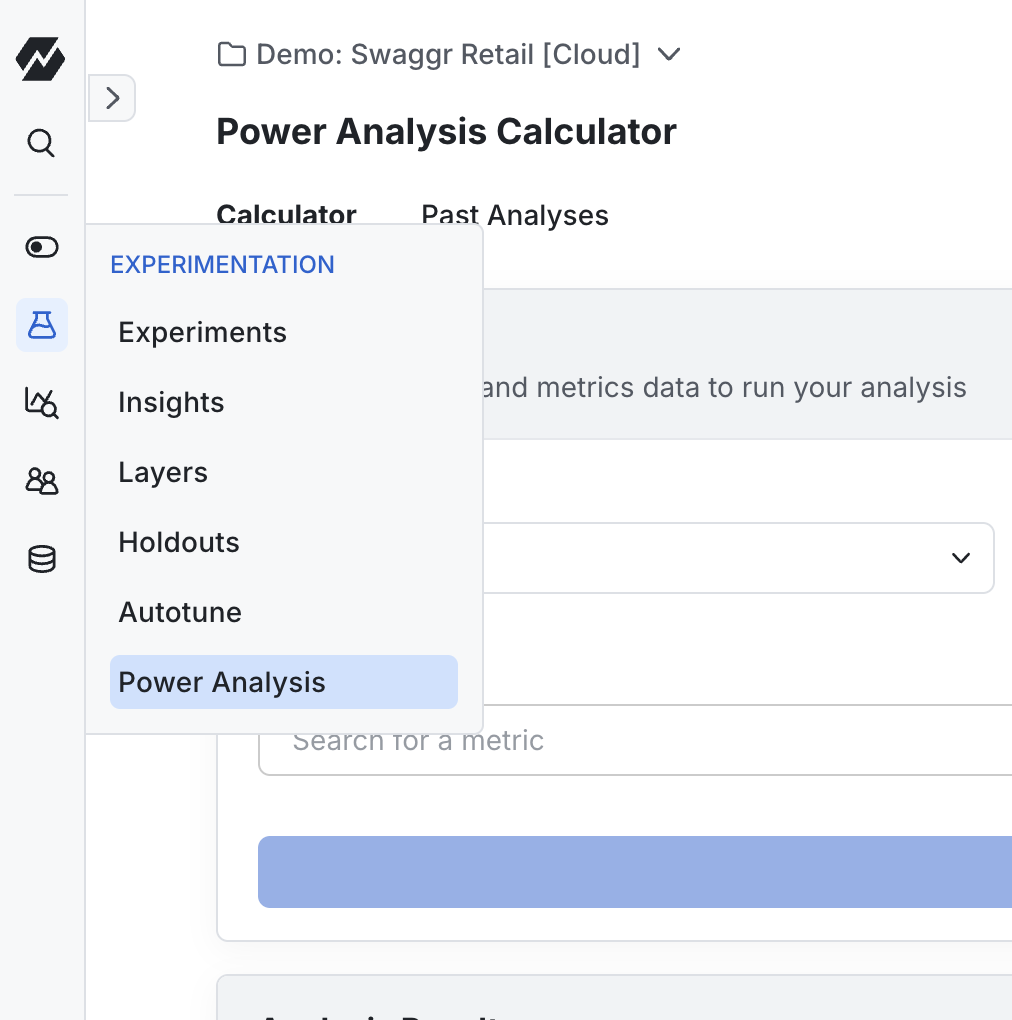
You can open the Power Analysis Calculator from the tools menu. Statsig also links it on the experiment setup page, below the Experiment Duration field.
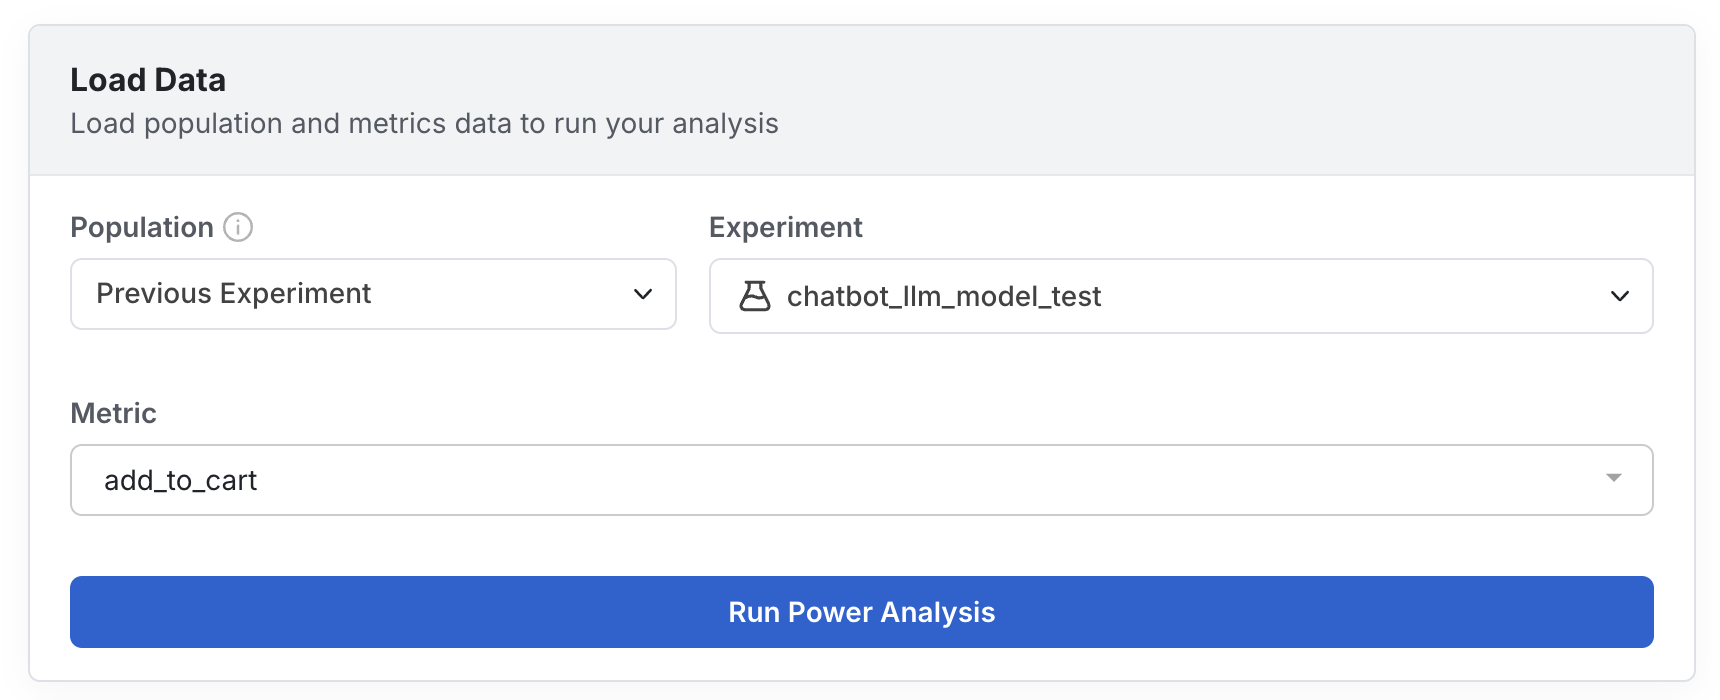
Select the population used to determine the metric mean and variance and to estimate the number of exposures over time.
- Everyone: Analysis uses the entire user base.
- Targeting gate: Analysis covers only users who pass the selected feature gate, which must have been active for at least 7 days. Choose this option when you plan to use a targeting gate for the experiment.
- Past experiment: Analysis uses data collected from a previous experiment. Use this option when the new experiment impacts a similar user base or part of the product as the previous one.
- Qualifying event: Analysis covers only users who logged the specified event.
Select a metric of interest (or multiple metrics for a targeting gate analysis).
Click on Run Power Analysis to calculate results.
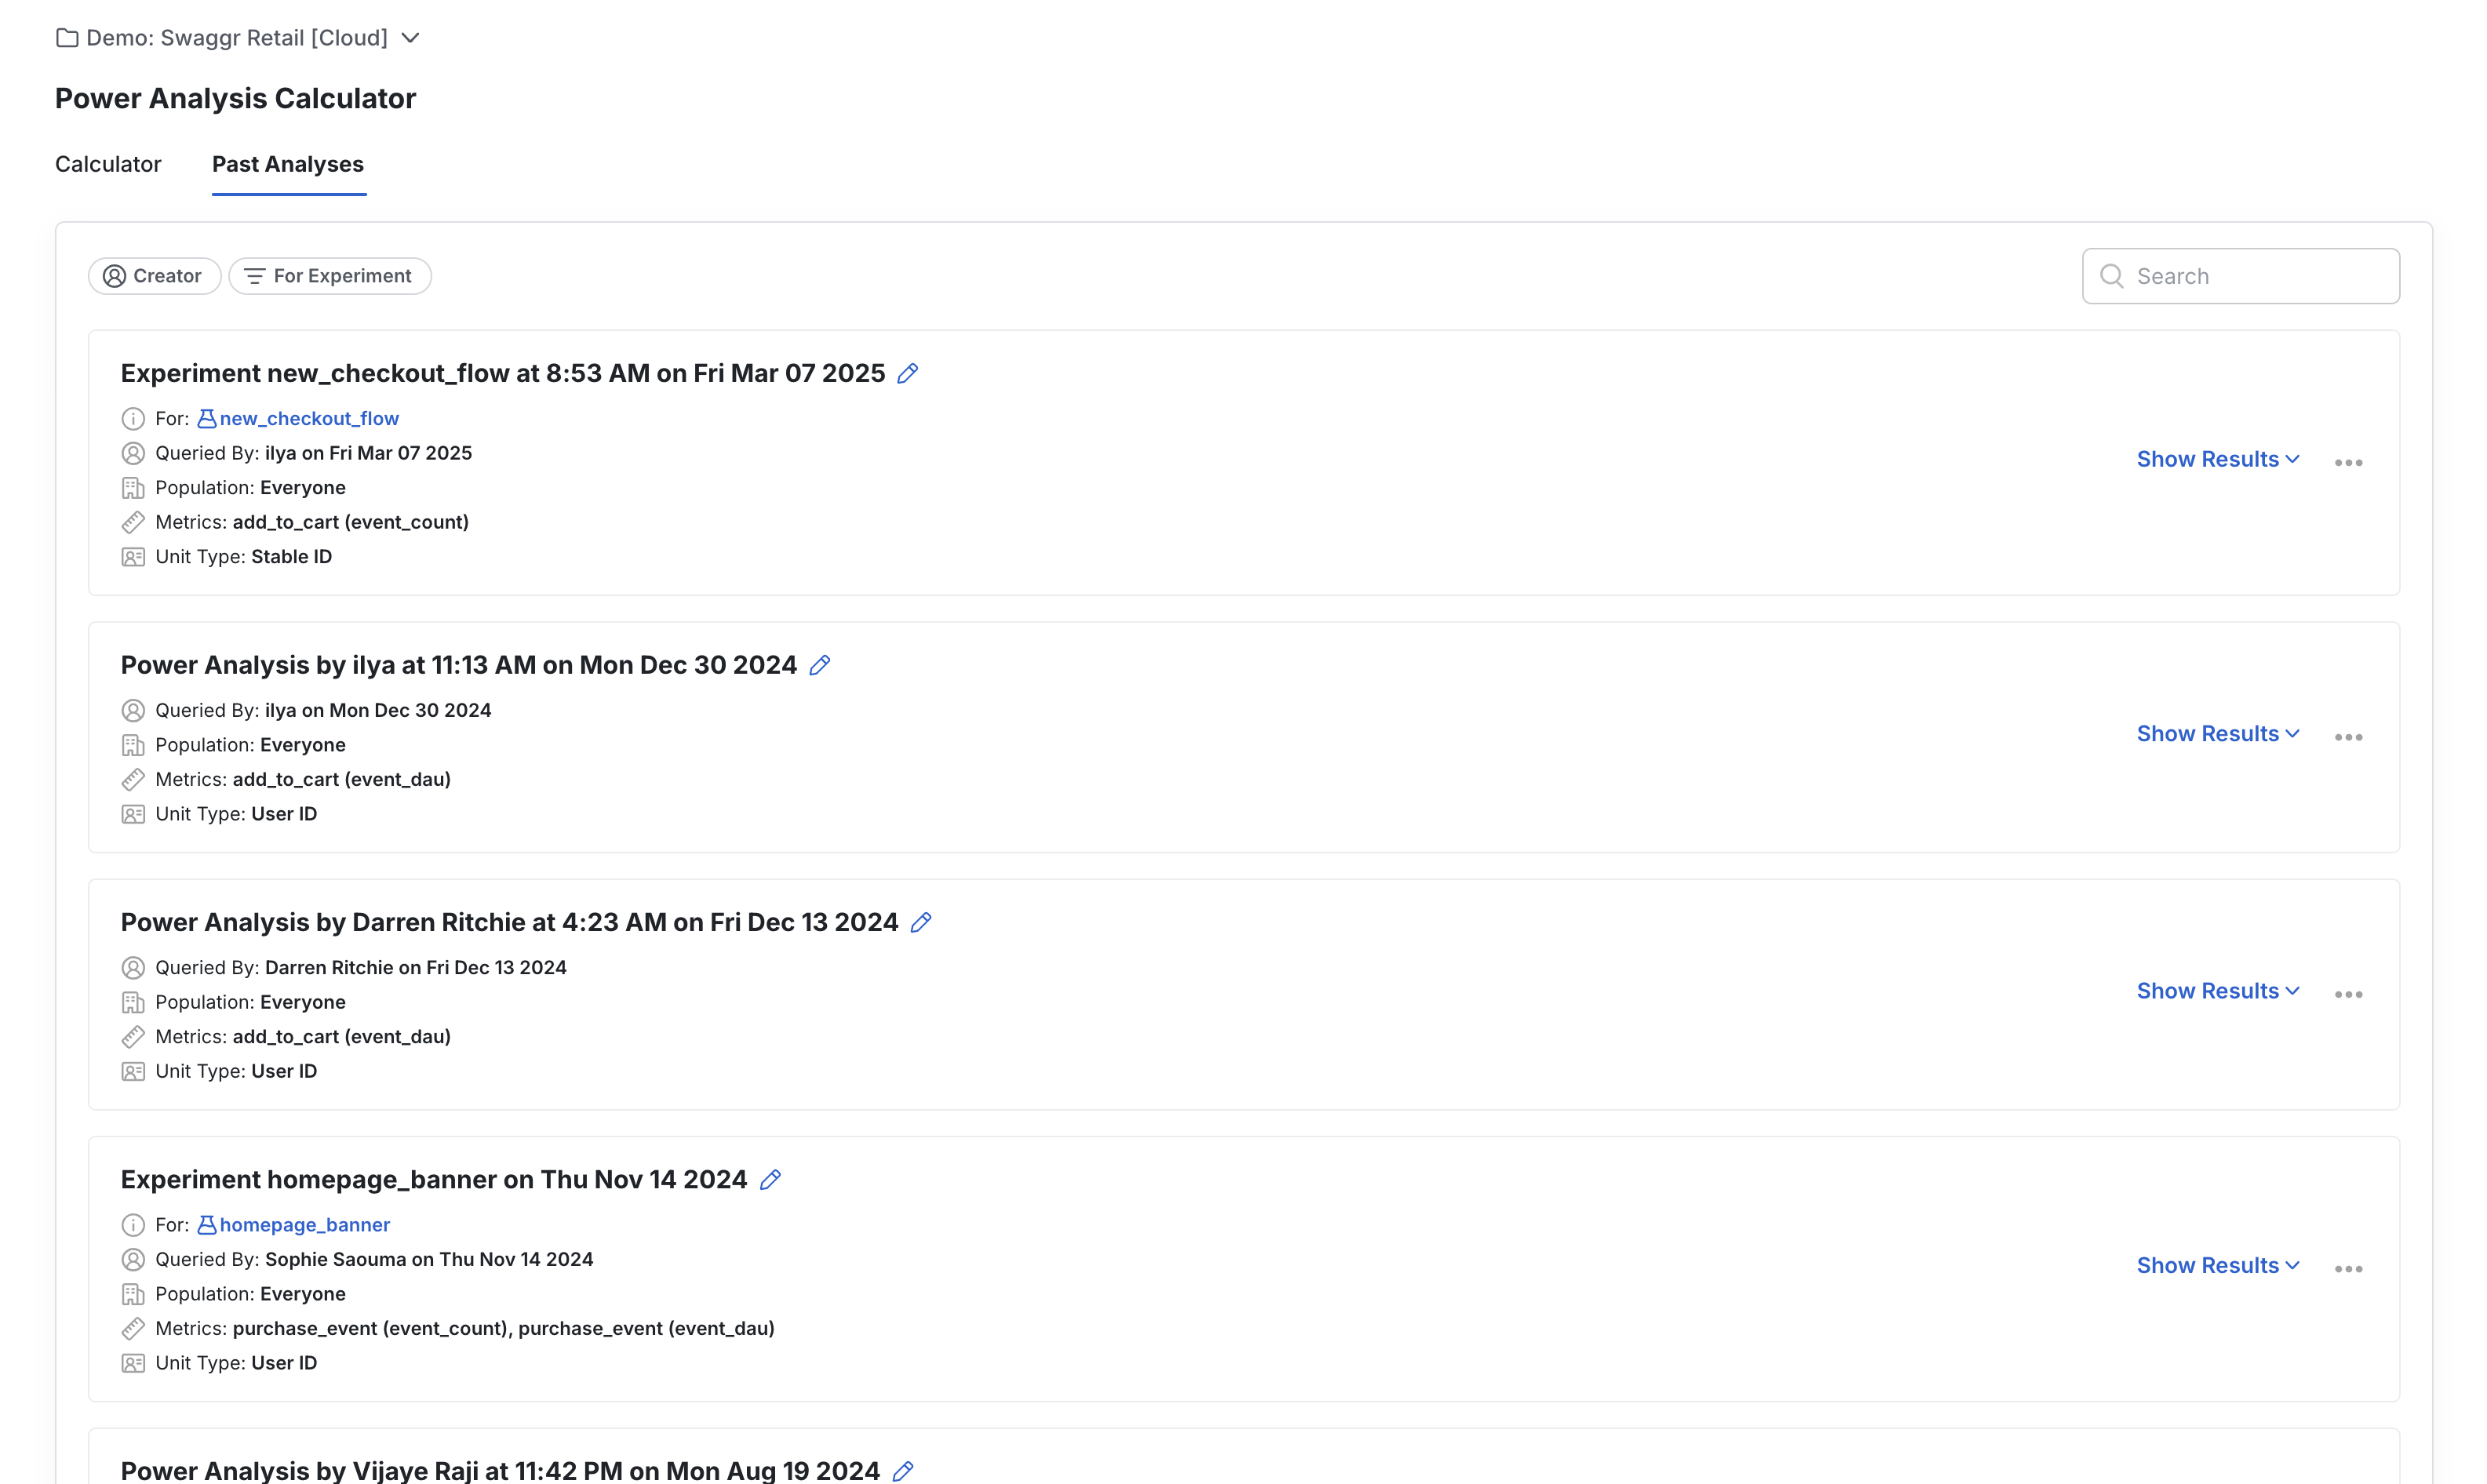
Your past power analysis calculations are available in the "Past Analyses" tab.
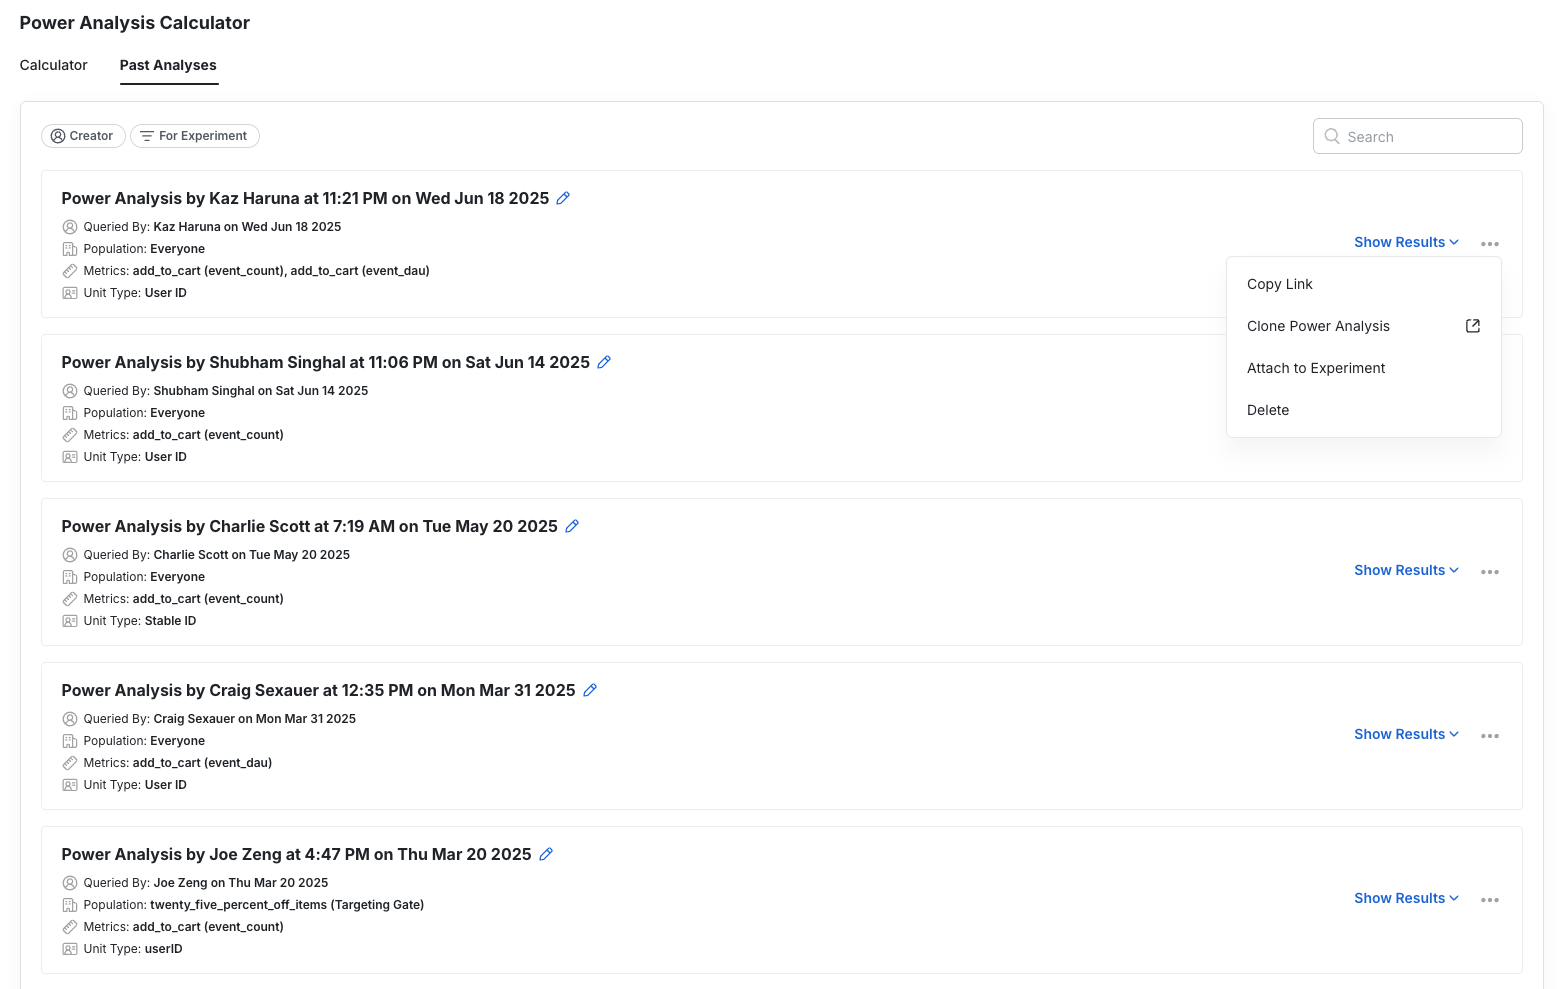
To attach an existing power analysis to an experiment, use the dropdown menu on an existing power analysis.
Population types
The population selected directly determines the inputs of the analysis (mean, variance, number of users). To obtain reliable power analysis estimates, the metric values of the selected population should roughly match those of the users you plan to target in the experiment.
Example
Suppose you want to test a change in the checkout flow and determine your expected MDE for total_purchases. If only approximately 10% of your daily users reach the checkout page and you use the Everyone population for your analysis, you're likely to:
- Overestimate the number of users the experiment gets.
- Underestimate the mean value of the total_purchases metric. The 90% of users that don't reach the checkout page have a value of zero, but in practice they aren't in the experiment and don't contribute to the metric.
- Incorrectly estimate the variance in the total_purchases metric. The distribution of metric values changes when you include the 90% of users with zero purchases because they never reached the checkout page.
When an experiment includes only a biased subset of users, the MDE and duration from the power analysis may not be a reliable estimate.
One way to address this bias is to use data from a past experiment to estimate the power of a new, similar experiment. For example, if a prior experiment also targeted the checkout page, that data provides better estimates of traffic volumes and metrics for that part of the product.
Inputs by population type
The following table shows how Statsig obtains inputs for the power analysis from the different population types:
| Population | Mean and Variance Calculation | Total Exposures by Week Estimate |
|---|---|---|
| Everyone | Mean and variance across all users, estimated for 1, 2, 3, and 4 week rollups | Total count of users seen in the past 1, 2, 3, and 4 weeks |
| Targeting Gate | Mean and variance for users that pass the targeting gate, computed for 1, 2, 3, 4 week rollups | Total users that passed the targeting gate after 1, 2, 3, 4 weeks |
| Past Experiment | Cumulative mean and variance for the control group at 1, 2, 3, and 4 weeks | Total experiment exposures after 1, 2, 3, and 4 weeks, adjusted according to the past experiment's allocation and the target allocation for the new experiment. |
| Qualifying Event | Mean and variance for users who logged a specified event, computed for 1, 2, 3, 4 week rollups | Total users who logged a specified event after 1, 2, 3, 4 weeks |
Analysis types
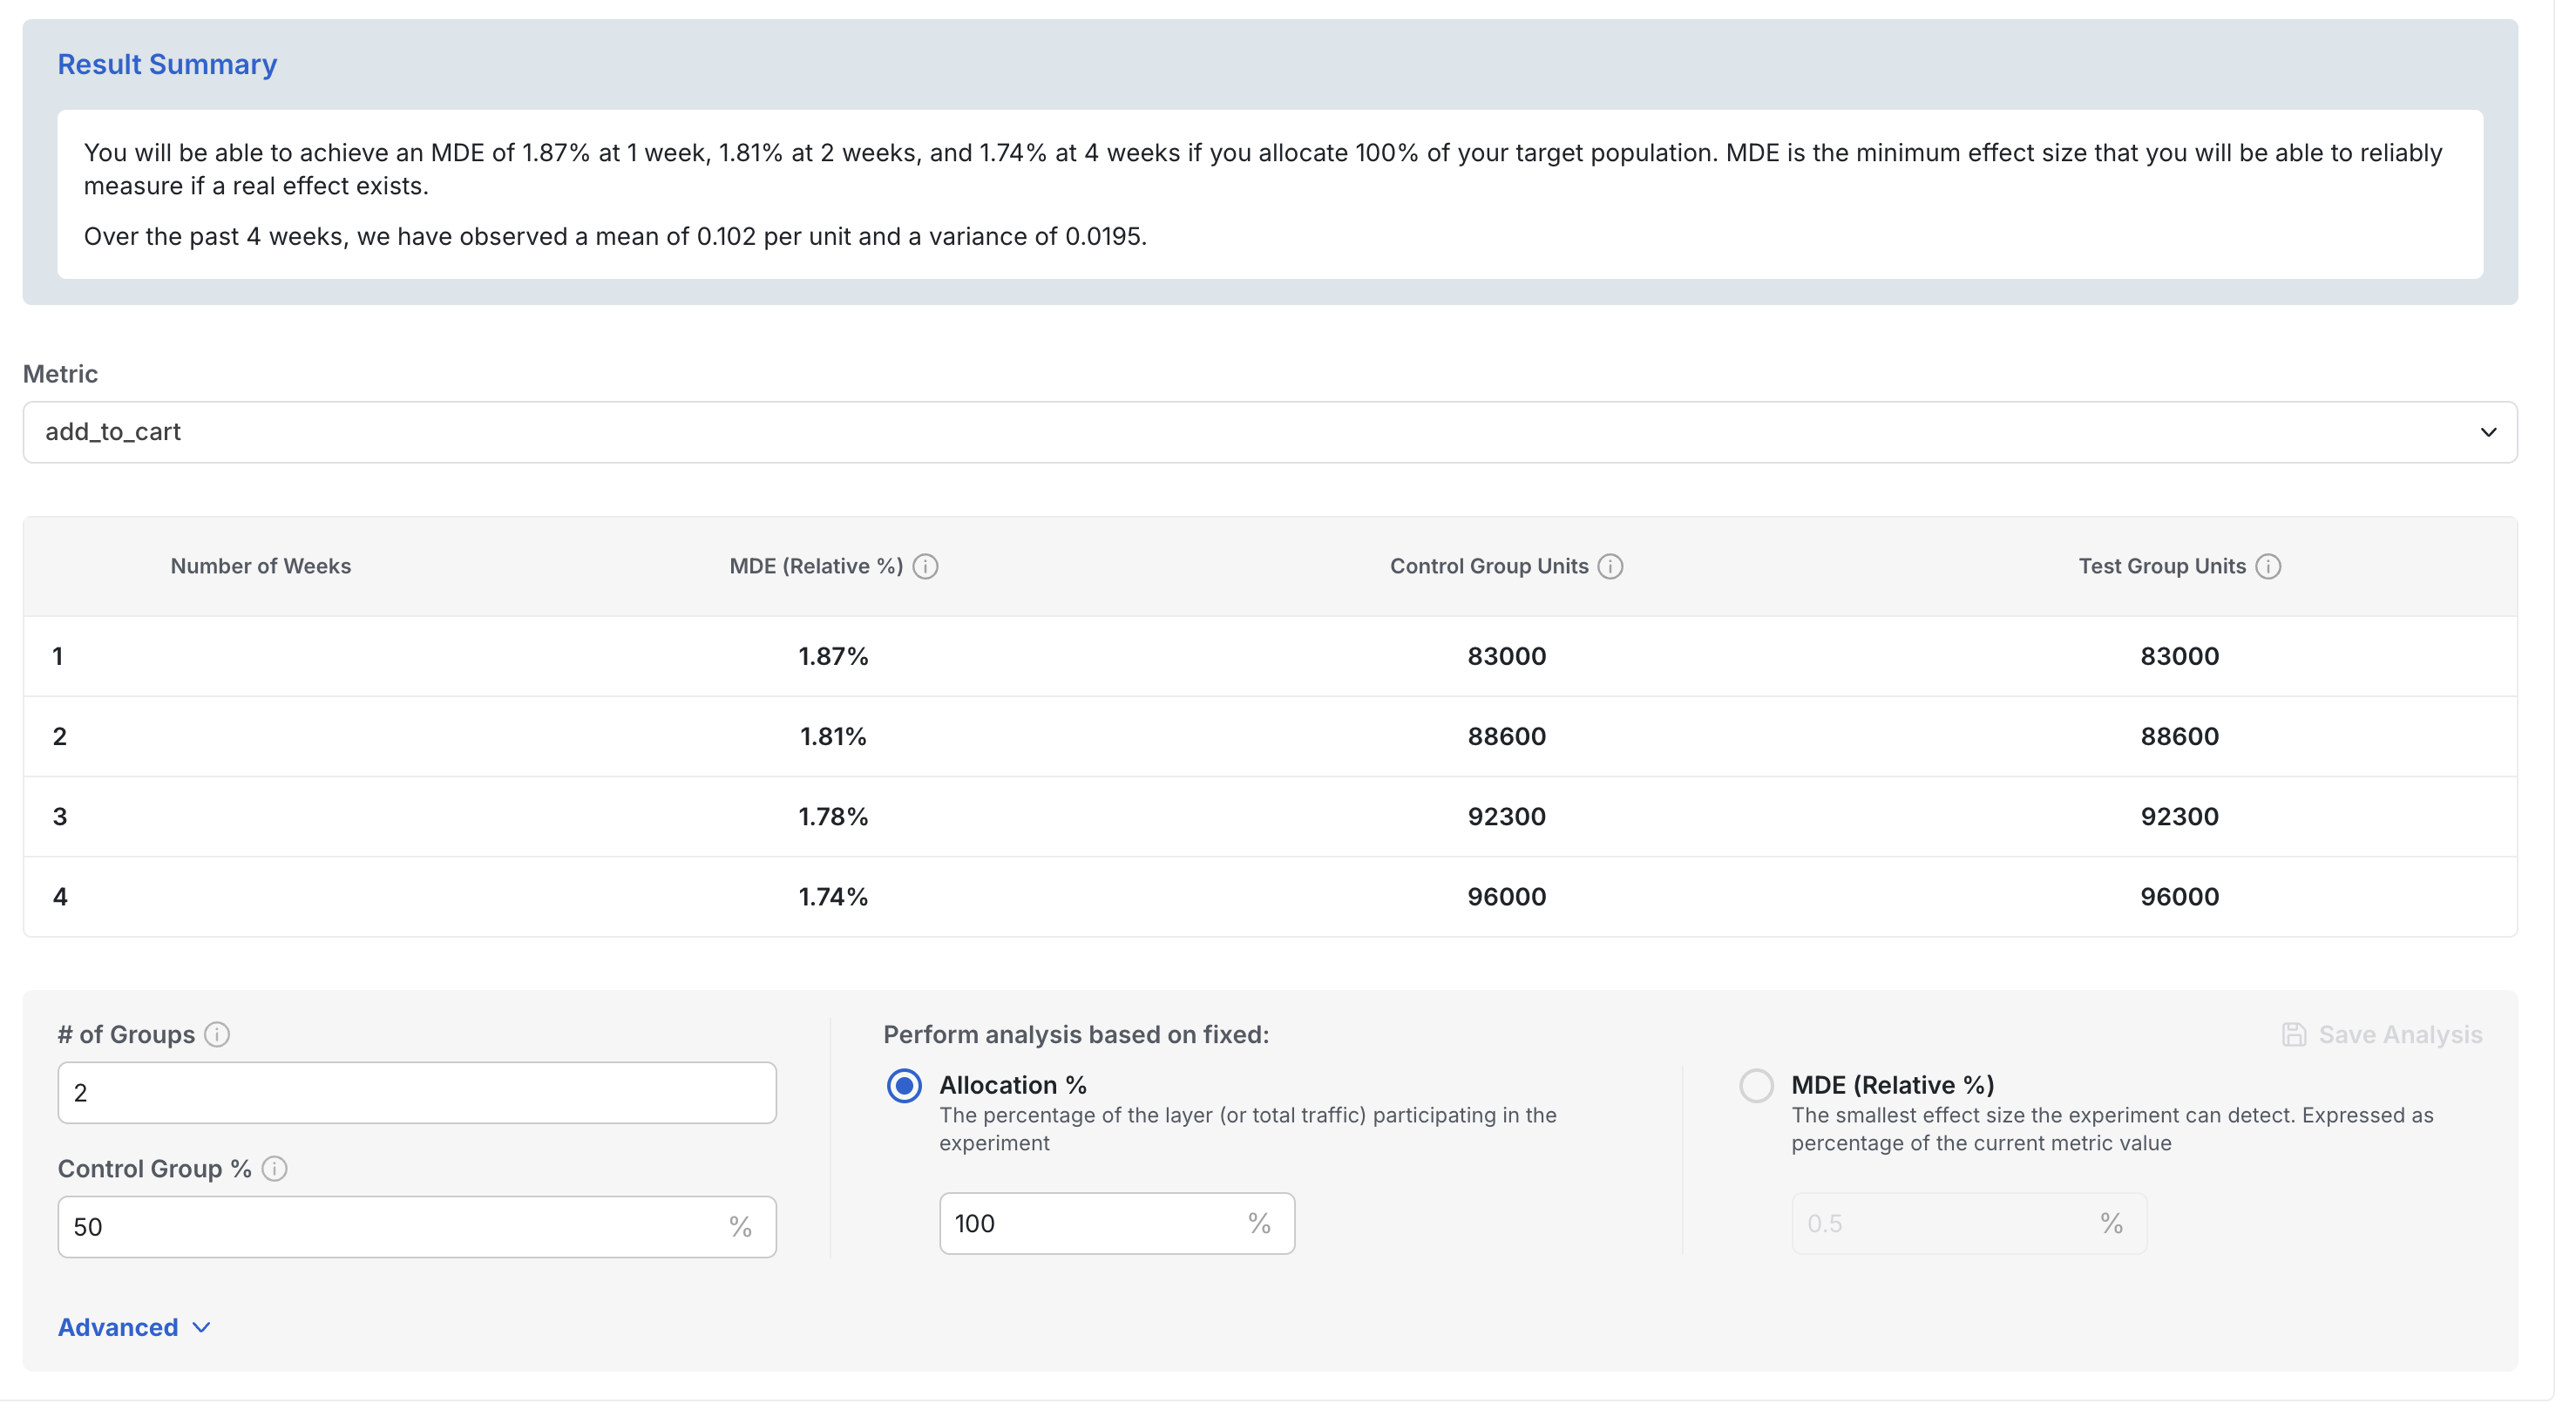
When viewing results, you can modify inputs such as "# of Groups", "Control Group %", and Analysis Types to update the power analysis results.
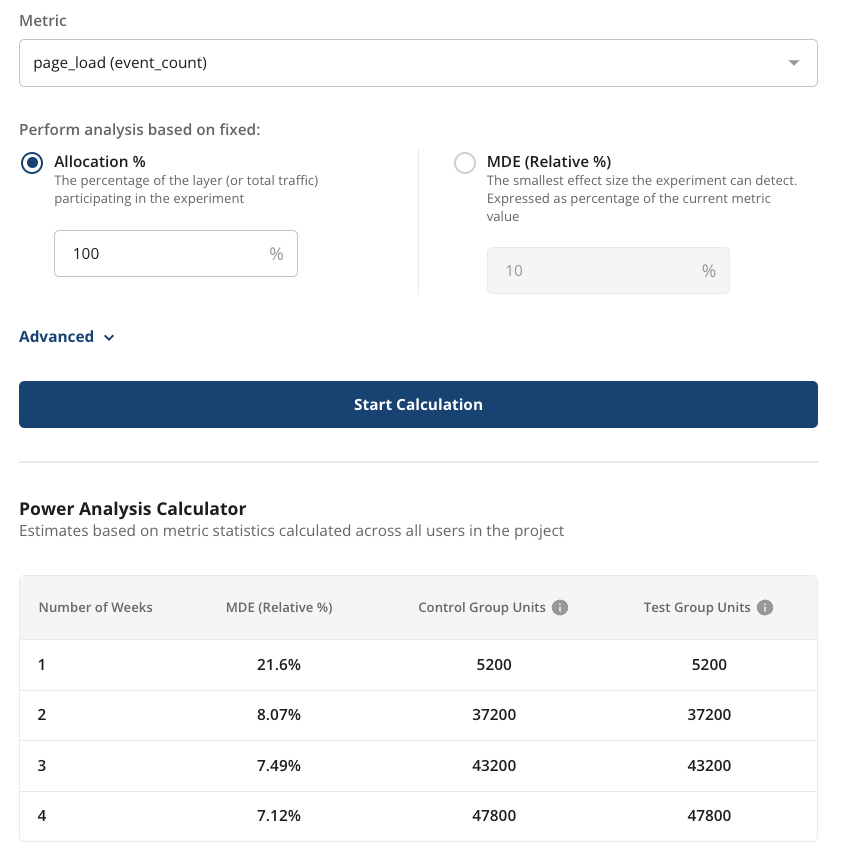
Fixed allocation analysis
If you already know the available allocation, fixed allocation analysis shows how the length of the experiment affects the MDE. The example below shows how the MDE for a page load metric shrinks over time in an experiment with 100% allocation. After 1 week, the expected user count per group is 5,200 with an MDE of 21.6%. By week 4, the user count per group increases to approximately 48,000 and the MDE drops to 7%.
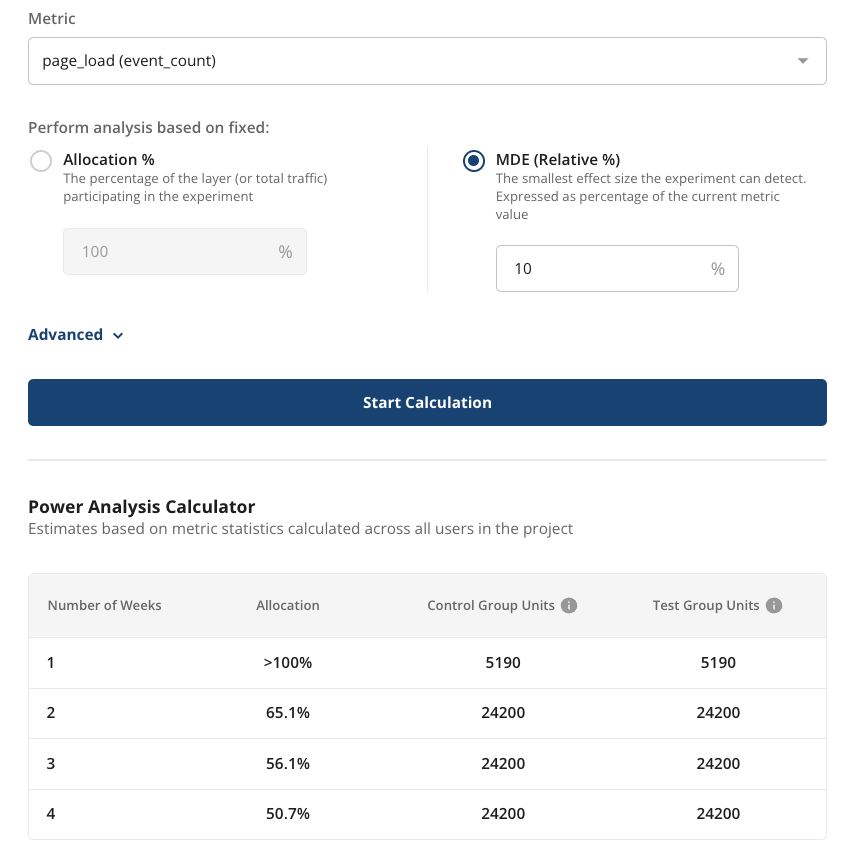
Fixed MDE analysis
If you already know the effect size you want to measure, fixed MDE analysis shows the allocation and duration needed to achieve that MDE. Enter your target MDE as a percentage of the current metric value. For example, if a website gets 1,000 page loads per day, an MDE of 10% means the experiment can detect a change of 100 or more page loads per day.
The results show the minimum number of weeks needed to reach this MDE for different allocation percentages. In the example below, the experiment must run for at least 2 weeks with 65% allocation or 4 weeks with 50% allocation. You can't achieve the target MDE in 1 week, because doing so would require more than 100% allocation.
Advanced options
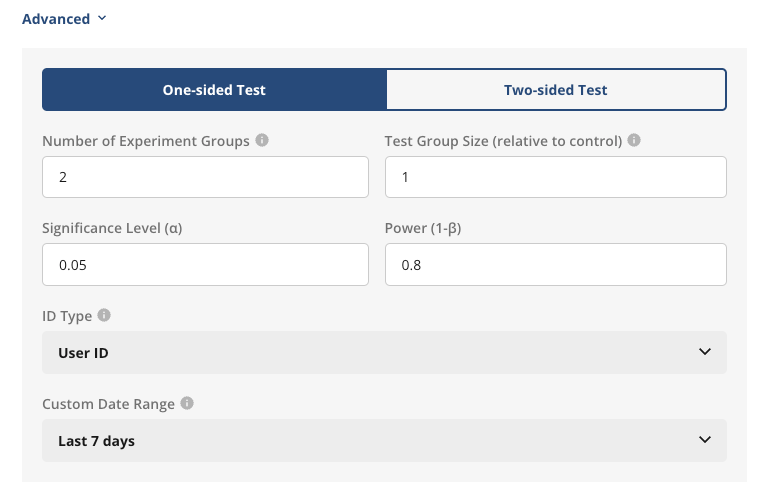
Advanced settings for customizing the analysis:
- Number of Experiment Groups: The total number of groups in the experiment, including control.
- Control Group %: What percent of users are in the control group, e.g. 50% if half of all users are control.
- Fixed Allocation or Fixed MDE Analysis: Different types of analyses you want to run. Refer to analysis types for more details.
- One-sided or Two-sided test: Toggle this setting to select the type of z-test to use for the analysis.
- Significant Level (α)
- Power (1-β)
- Bonferroni Correction Per Variant: Whether to include α correction for multiple tests in power analysis.
Calculation details
Statsig computes the relative percentage MDE for a given metric X using the following equation:
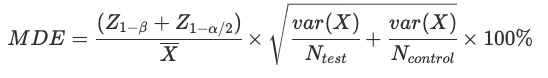
- X-bar is the mean metric value across all users
- var(X) is the population variance of the metric
- Ntest and Ncontrol are the estimated number of users in the test and control group. These come from historical active user data along with experiment allocation and group size.
- Z1-β is the standard Z-score for the selected power. Typically 1-β = 0.8 and Z1-β = 0.84
- Z1-α/2 is the standard Z-score for the selected significance level in a 2-sided test. Typically α = 0.05 and Z1-α/2 = 1.96
This calculation relies on statistics computed across the entire user base of the project. It doesn't account for experiments that target only a subset of users, which may have different summary statistics for their key metrics. For example, the metric mean and variance can differ in an experiment that targets only Android users or one that exposes users at the lower part of an acquisition funnel.
Was this helpful?