Run your first A/B test
Run A/B/n experiments in Statsig with three or more variants to compare multiple candidate designs against a single control group in one test.
An A/B test in Statsig compares two or more variants against a control to measure which performs best on your metrics. This tutorial walks through creating and implementing your first experiment end to end, from configuring it in the console to checking it in your application code. Set one up when you want to validate a change with real production traffic before rolling it out.
By the end of this tutorial, you have:
- Created a new user-level Experiment in the Statsig console, with parameters set for a Control and Test group
- Checked the experiment in your application code using the Statsig Client SDK
getExperimentfunction
Step 1: In the Statsig console
Create an experiment
- Log in to the Statsig console at https://console.statsig.com/ and navigate to Experiments in the left-hand navigation panel.
- Click on the Create button and enter the name
Quickstart Experimentand enter a brief hypothesis. For example, "A new homepage banner will improve engagement." - Click Create.
Set up scorecards
In the Experiment Setup tab, fill out scorecards for the metrics you want to track. For this SDK tutorial, leave most settings at their default values.
- In the Hypothesis card, enter a hypothesis for what you are testing: "Showing a homepage banner will increase user engagement, measured by daily_stickiness."
- In the Primary Metrics card, add a new metric called
daily_stickiness. - Leave the Secondary Metrics and Duration settings at their default values. For more details on experiment setup, refer to Creating an experiment.
Configure groups and parameters
By default, the experiment runs on 100% of users: Statsig assigns 50% to a Control group and 50% to a Test group.
- In the Groups and Parameters card, create a parameter called
enable_bannerand select the type asBoolean. - Set
enable_bannertofalsefor the Control group andtruefor the Test group. - Click Save.
- Select Save in the bottom right to finalize this experiment setup.
- The experiment isn't live yet. To launch it, select Start at the top of the page. This makes production traffic eligible for the experiment.
Step 2: In your application code
Check the experiment
Use a Statsig Client SDK to check a user's assigned experiment group and parameters in real time. The SDK changes the user's experience according to the assigned variant. In this case, fetch the value of the enable_banner parameter created in Step 1.
const quickstartExperiment = myStatsigClient.getExperiment(user, "quickstart_experiment");

// the second parameter is the default fallback value if the experiment is not found
if (quickstartExperiment.get("enable_banner", false)) {
  showBanner();
}
In this snippet, users assigned to the Test group see the banner. Users assigned to the Control group don't.
You don't need to hardcode the experiment group name ("Control" or "Test") in the code. The Statsig SDK automatically fetches the experiment configuration and returns the correct value based on the user's variant.Step 3: Monitor experiment diagnostics
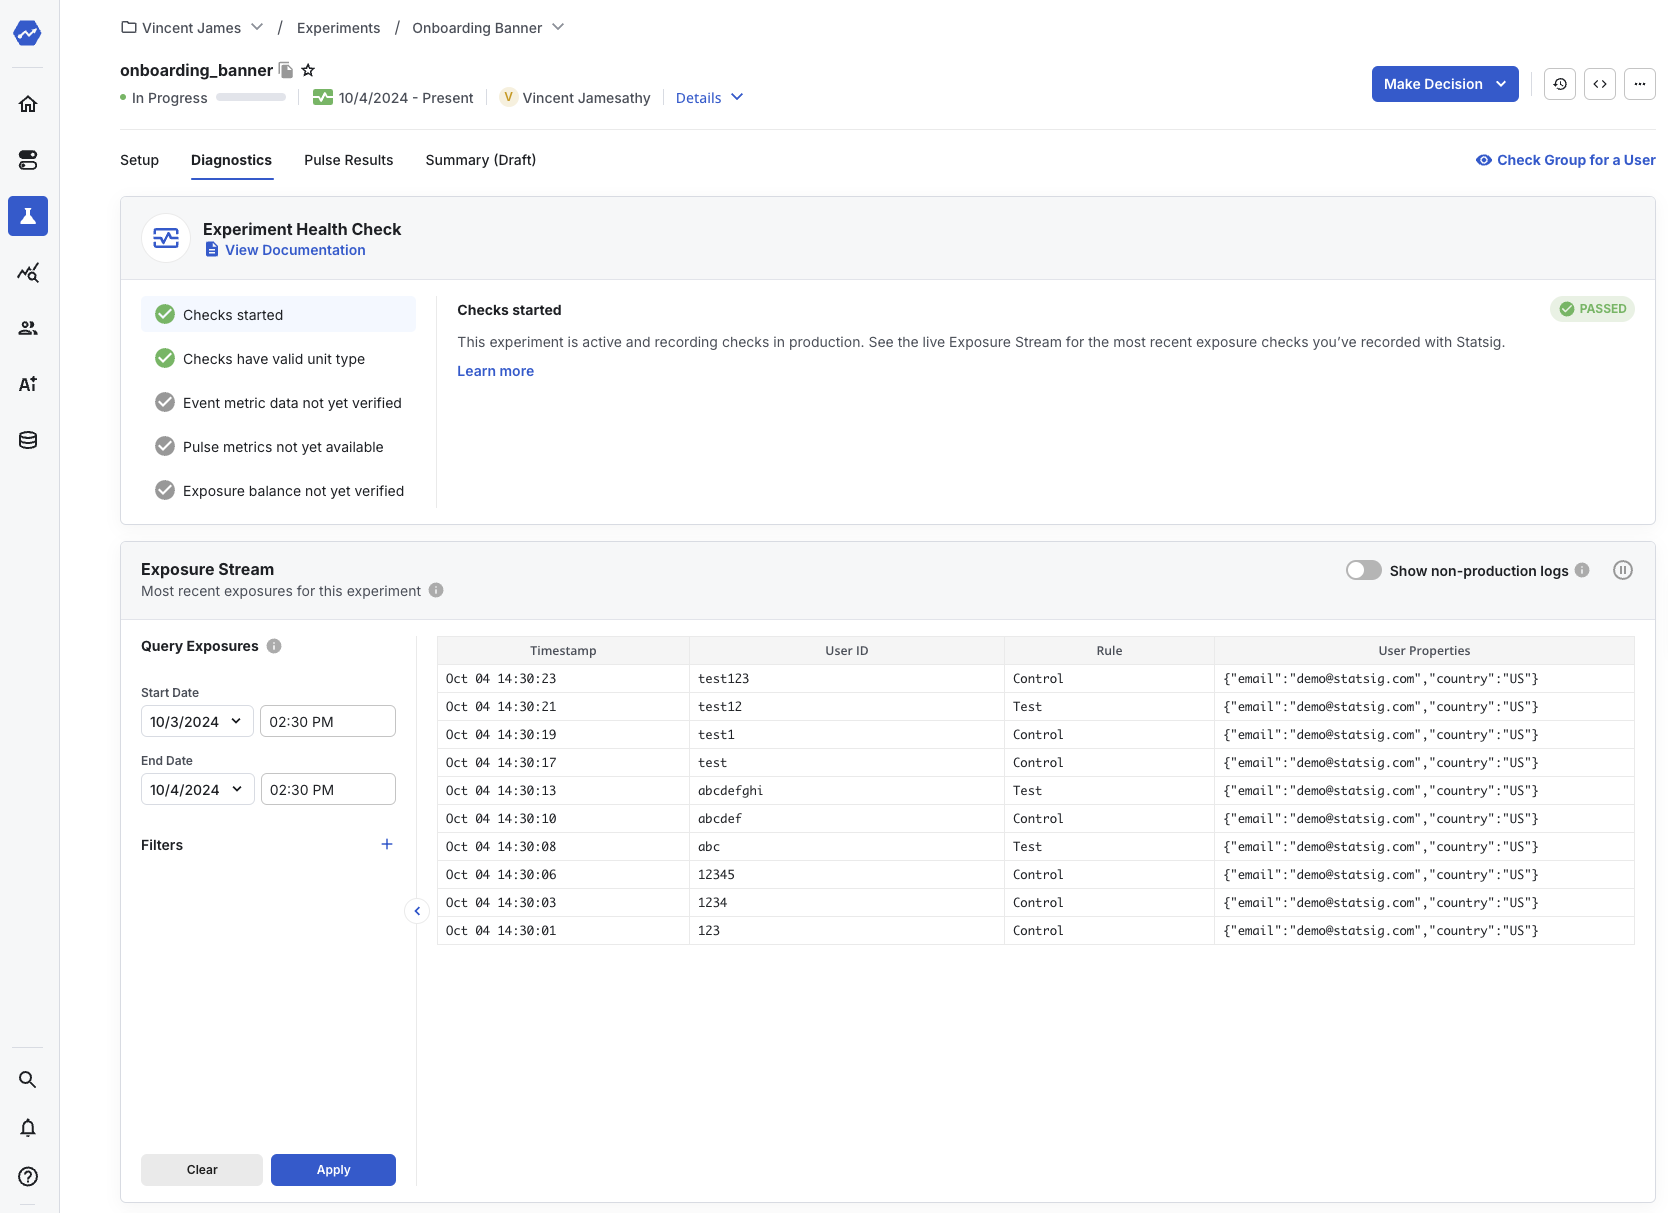
When you run your code, the SDK calls the showBanner() function for users in the Test group. Navigate to your experiment in the Statsig console and select the Diagnostics tab to see a live log stream of checks and events from your application.
Step 4: Read experiment results
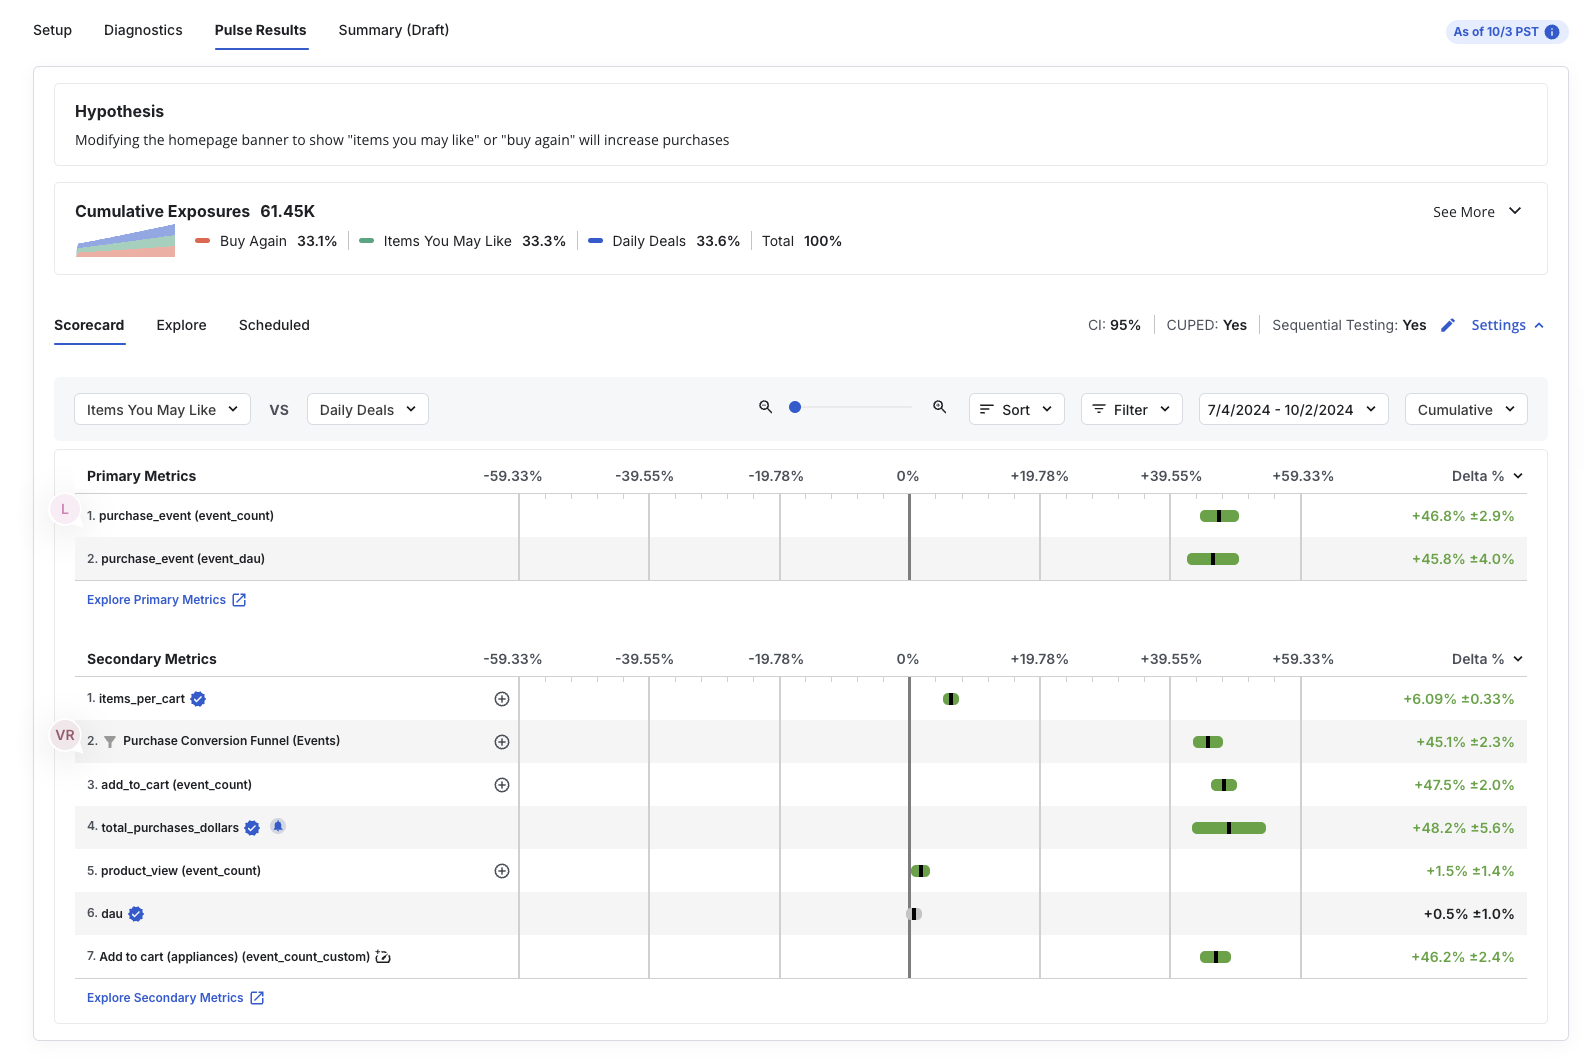
Within 24 hours of starting your experiment, the Results tab in the Statsig console shows cumulative exposures and their impact on the scorecard metrics configured in the Setup panel.
Here's a sample of what that looks like:
Log custom events and metrics
In this tutorial, you used daily_stickiness as the primary metric. Statsig logs this metric automatically, so you don't need to log it explicitly.
To measure other events or custom metrics that occur after the experiment check, log them to Statsig. Continue to the next tutorial to learn how to log custom events and metrics with the Statsig SDK.
Related guides
Was this helpful?