Logs Explorer Overview
Search and analyze all of your product’s logs in one place.
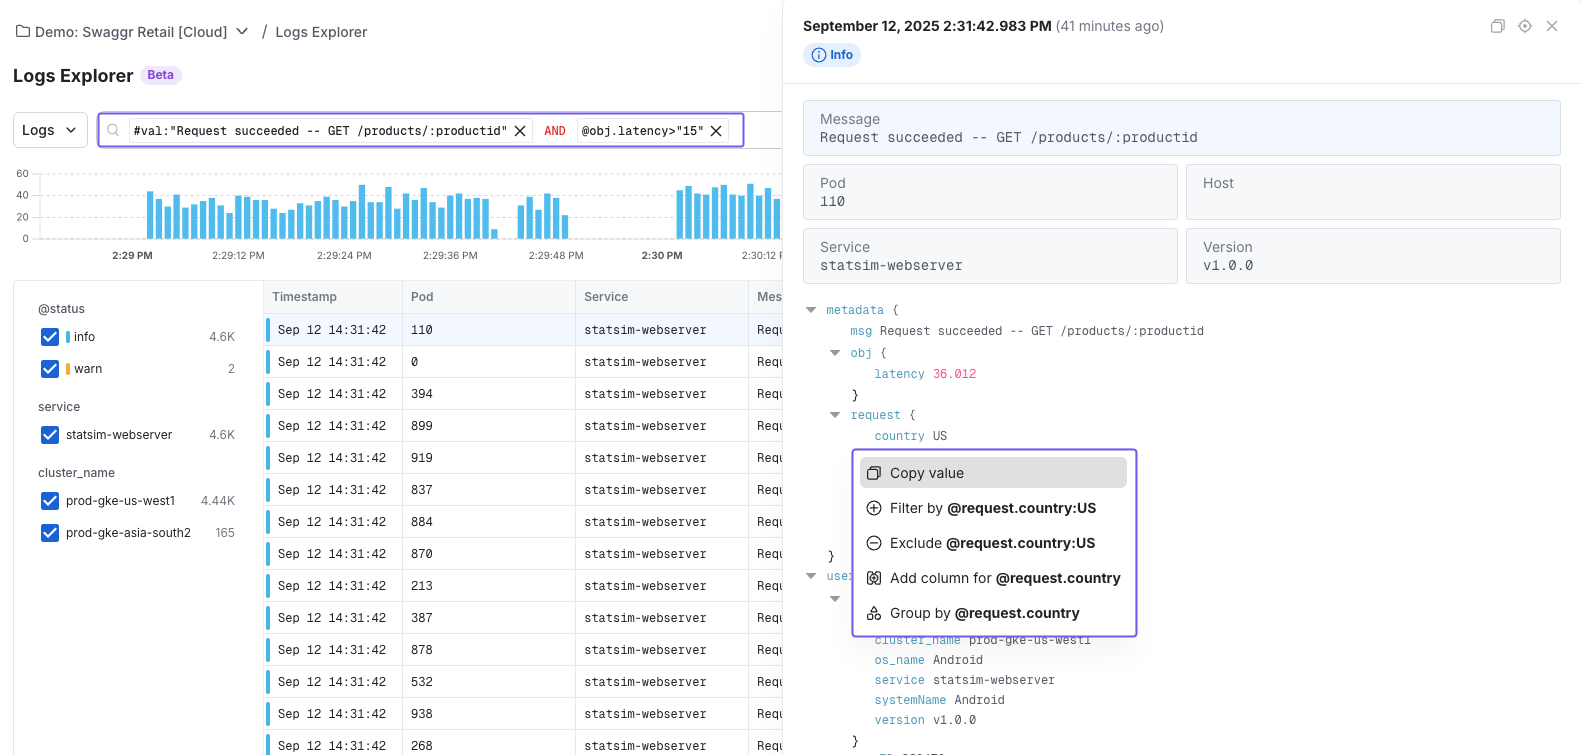
Logs Explorer lets you query logs, traces, and ingested events from a single interface. Use it the same way whether you’re debugging infrastructure issues or investigating product event streams.
- Search: Slice logs down to only what's relevant (by service, host, status code, etc.)
- Group: Aggregate logs by dimensions like region, status, or browser.
- Visualize: Plot log groupings over time to spot spikes, regressions, or anomalies instantly.
Getting started with Log Explorer
To get started with Log Explorer, follow the OTEL onboarding guide to set up log ingestion. After you configure log ingestion, navigate to Infra Analytics > Log Explorer from the Statsig left menu.You can also use Logs Explorer in Events Mode to search and analyze your existing Statsig Events, with no additional instrumentation needed. You can switch between Logs and Events mode using the dropdown left of the search bar.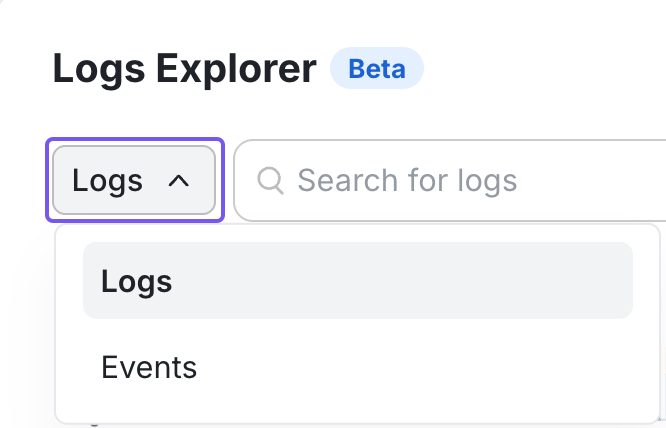
Searching in Logs Explorer
- Write custom queries: Refer to the syntax guide to craft your search.
- Using the query builder: Point-and-click to construct filters without syntax overhead.
Download log results
Export your query results to a file when you need to share findings or run them through a script. The Download button lives in the Logs Explorer toolbar, in the top-right corner next to the settings gear. Downloads work in both Logs and Events mode.
To download results:
- Run your query.
- Open the Download menu from the toolbar.
- Choose a format and row cap, then start the download.
A progress indicator shows the export as it runs, and you can cancel mid-download.
Formats
- CSV: Columns match the visible table. The download excludes hidden columns, so the file reflects what you see on screen.
- JSONL: Emits one full log object per line, which works well with tools like
grepandjq.
Row caps
Choose a cap of 100, 1,000, or 10,000 rows. The default is 1,000; select 10,000 for heavier pulls.
Was this helpful?