Fieller Intervals
How Statsig uses Fieller intervals to construct confidence intervals for ratio metrics in experiment analysis, with formulas and interpretation notes.
Fieller intervals
You can use Fieller Intervals as the methodology for calculating confidence intervals for the relative change between test and control groups.
Statsig recommends Fieller over the Delta Method because Fieller gives an exact confidence interval and stays reliable when sample sizes are small or denominators are noisy. The two methods agree in most other cases.The Delta Method is an approximation for the variance of a ratio between two variables, which Statsig then uses to establish a confidence interval. Fieller Intervals are an exact solution for the confidence interval.
Calculation
1: Determine if a Fieller interval is well-defined
Before applying Fieller’s Theorem, verify that the denominator of the relative lift metric is significantly distinct from 0.
Calculate the parameter :
Where:
- is the critical value associated with the confidence level you want
- is the variance of the control group metric values
- is the number of units in the control group
- is the mean of the control group metric values
When < 1, the control mean is significantly different from 0, and you can use Fieller intervals.
2A: Apply Fieller interval formula
Since the control and test group results are independent of each other, you can drop the covariance terms in Fieller's Theorem.
2B: Edge case: control mean not statistically distinct from zero
In rare cases (less than 5% of observed metric comparisons on Statsig), g 1, which means the control group’s mean isn’t statistically distinguishable from 0.
When isn't statistically different from zero, the denominator of the relative lift calculation is unstable. This means that the confidence interval for the percent difference between test and control is unbounded.
When the confidence interval is unbounded, Statsig surfaces the relative lift observed during the experiment.
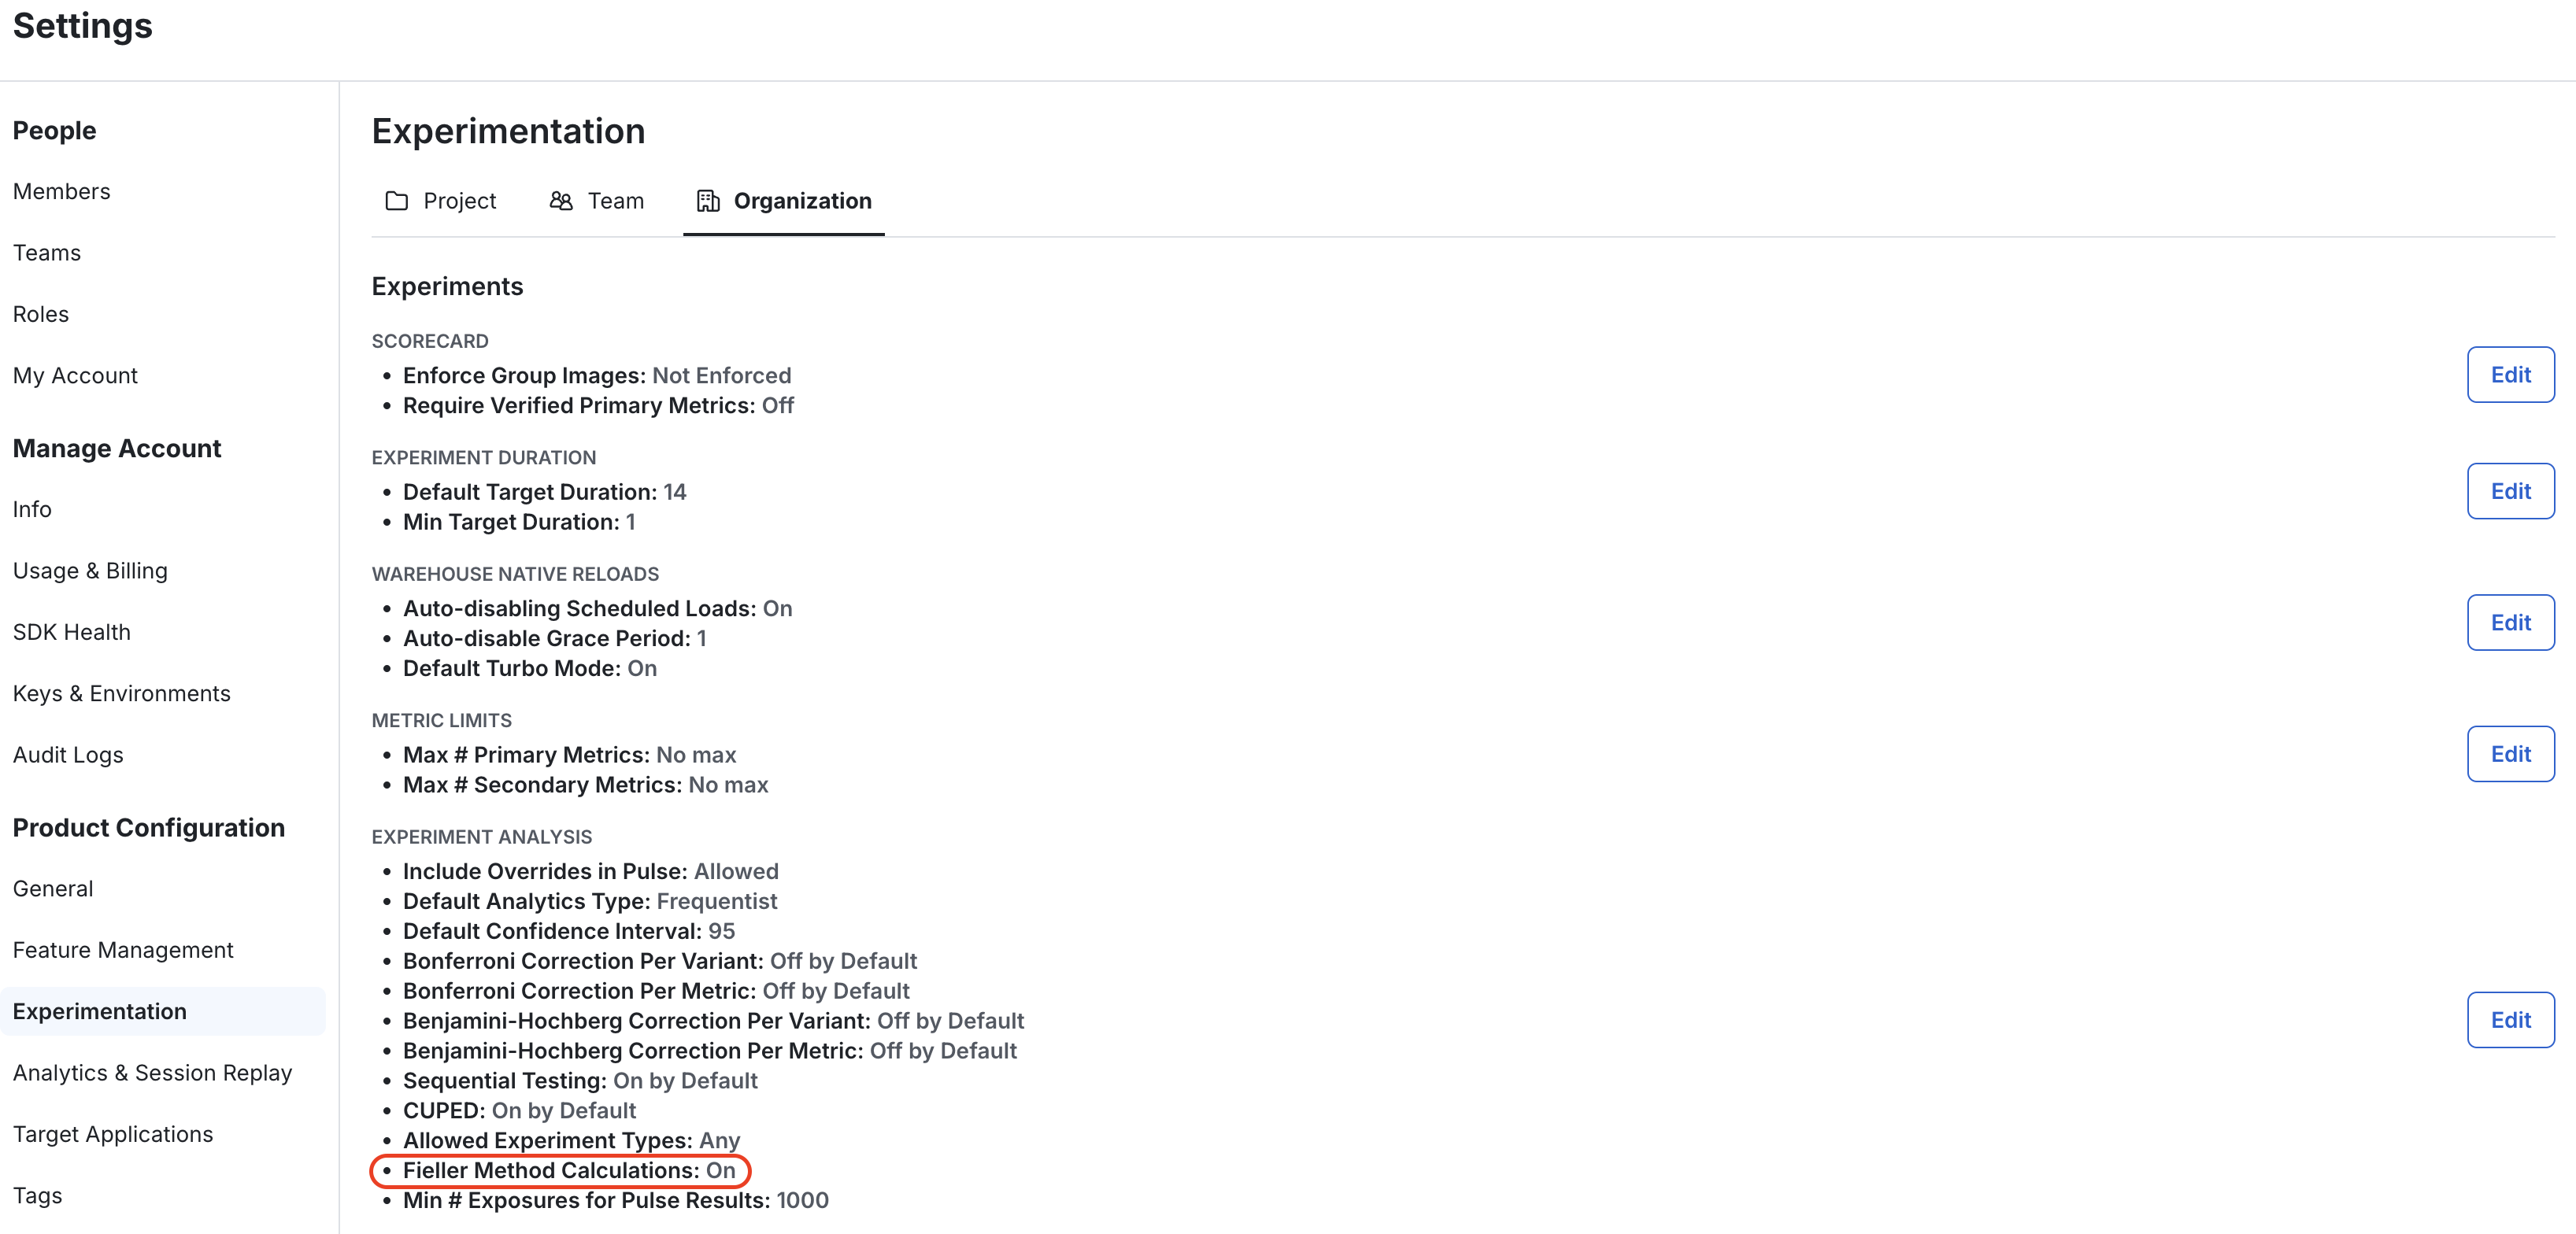
Enable Fieller intervals in Statsig
Configure the relative confidence interval methodology in your Experimentation Settings at the organization level. Changing this setting only affects experiments created after the change.
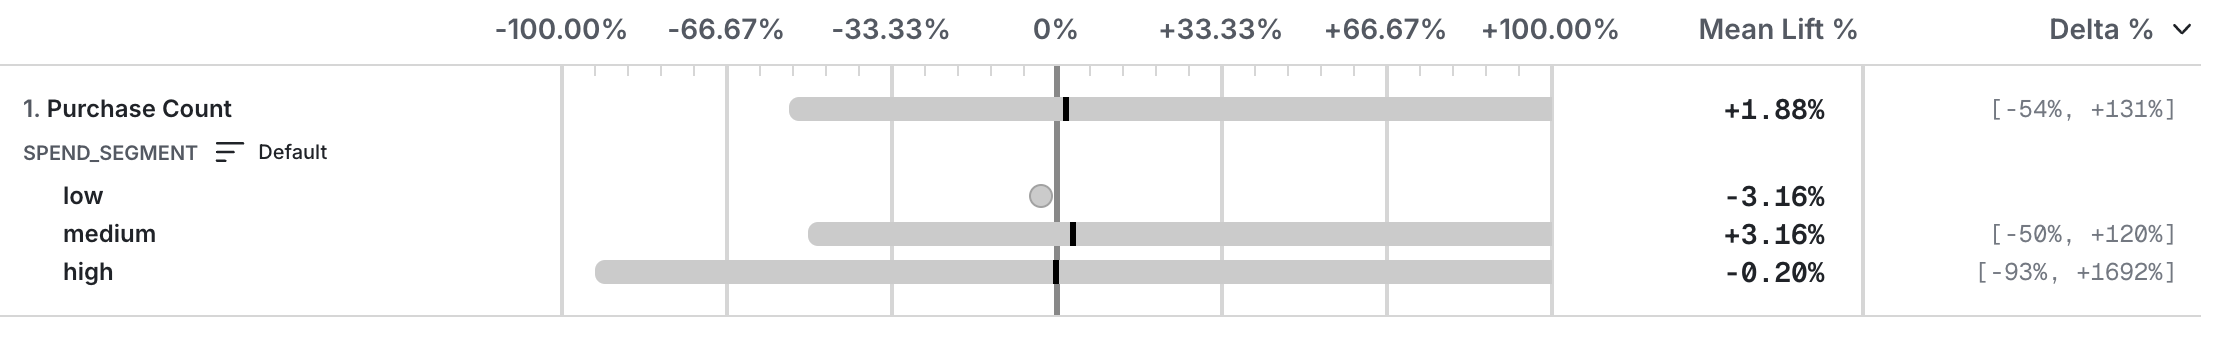
In the experiment scorecard, Fieller Intervals appear as shown:
Was this helpful?