Confidence Intervals
How Statsig calculates confidence intervals for experiment metrics, including the formulas, assumptions, and how to interpret intervals in scorecards.
Confidence intervals quantify the uncertainty in observed metric deltas. A 95% confidence interval contains the true effect 95% of the time. If an experiment ran 100 times, the true value of the metric delta would fall inside the confidence intervals 95 times.
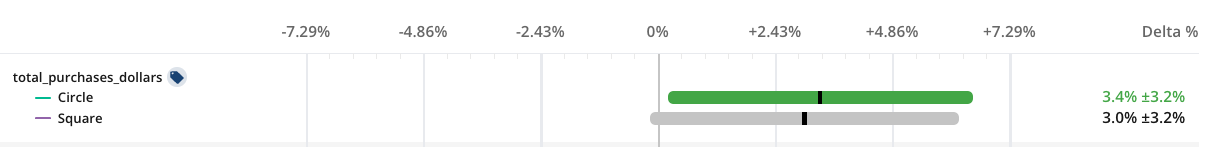
Only 5% of the time would you expect to see the confidence interval exclude zero if the true effect was zero (a false positive). Larger confidence intervals imply less certainty in the exact size of the effect with a larger range of likely values.
Computing confidence intervals
Statsig calculates confidence intervals using a two-sample z-test. This test requires the variance of the metric delta you're measuring, which Statsig derives differently depending on the metric type (details at Variance).After establishing the variance of the delta, you can compute the confidence intervals.
Two-sided tests
For the absolute metric delta, Statsig computes the confidence interval as:
where:
- is the z-critical value for the significance level you want (1.96 for the standard and 95% confidence interval) for a two-sided test
- is the variance of the absolute delta (details here)
When using Fieller Intervals, compute the relative metric delta CI using:
When using the Delta Method, the confidence interval is:
If using the Delta Method and the control mean isn't significantly away from zero, then it simplifies to:
One-sided tests
When running one-sided tests, the confidence interval calculation changes to account for a redistribution of the false positive rate you want when looking for increases or decreases in the metric:
where:
- is the z-critical value for the significance level you want (1.645 for the standard and 95% confidence interval) for a one-sided test
- is the same as for two-sided tests
- the choice of confidence interval depends on if the one-sided test is looking for increases or decreases in the metric
Welch's t-test for small sample sizes
For small sample sizes, Statsig uses Welch's t-test instead of a standard z-test. Welch's t-test handles samples of unequal size or variance without increasing the false positive rate. The confidence interval calculation follows the same structure as the two-sample z-test, depending on whether the test is one- or two-sided. This calculation replaces the z-critical value with the t-critical value with degrees of freedom .
For a two-sided test, the confidence interval is therefore:
Where and are the number of users in the test and control groups, respectively. For a large number of degrees of freedom, the t-statistic converges with the z-statistic. Therefore, Statsig uses Welch's t-test only when .
Comparing experiment data to a fixed baseline: one-sample t-test
To answer questions such as "Does my test variant lead to a click-through rate higher than 0.5?", define a fixed-baseline comparison when adding metrics to the experiment.
Statsig calculates the confidence interval as:
Was this helpful?