Alerts
Statsig offers two types of alerts on the platform today:
- Rollout Alerts- These are alerts on a metric's value in the context of a gate or experiment rollout.
- Topline Metric Alerts- These are alerts on a metric's topline value, independent of any experiment or gate.
Topline Alerts are useful for keeping tabs on topline trends and ensuring you know if key product and business metrics are trending in a concerning direction. Rollout Alerts are helpful to confirm no key metrics are regressing when you start rolling out a new feature or experiment.
NOTE- Topline Alerts are in beta and are currently only available on Statsig Cloud. Support for Warehouse Native is coming soon.
Rollout Alerts
On Statsig Cloud, Rollout Alerts are hourly for the first 24 hours post experiment/gate rollout (this includes new gate rules/rollouts), and then daily thereafter. This is to help provide more real-time visibility during the most critical phase of a rollout; in those first 24 hours post-going live. Alerts only trigger if the metric delta is statistically significant lower/higher than your threshold, which helps reduce alert noisiness.
On Statsig Warehouse Native, Rollout Alerts are evaluated every time Pulse is loaded. Loading Pulse on the first day of a rollout will help provide more real-time visibility during this window. Alerts only trigger if the metric delta is statistically significant lower/higher than your threshold, which helps reduce alert noisiness.
Finally, all stats methodologies you've enabled for your experiment/gate rollout (CUPED, Sequential Testing, etc.) will be applied to alert calculations post-the first 24 hours (once the alert becomes daily).
NOTE: Rollout Alerts do not alert at the topline metric value level, but rather at the experiment/feature gate level. This means that even if you have an experiment allocated to 10% of your users, but the metric change within that 10% allocation breaches the set threshold, you will be alerted. All alerts you receive will be in the context of a specific experiment or feature gate and to debug/resolve the alert you will be directed to the offending experiment or gate in question.
Configuring a Rollout Alert
To set up a Rollout Alert, go to the Metrics tab —> Metrics Catalog and search for the desired metric.

Once in the Metric Detail View, go to the Alerts tab, and tap + Create Alert. As part of Rollout Alert configuration, you will be asked to configure the following inputs-
- % Change- The metric delta threshold after which you want to trigger an automated alert. As noted above, this delta is in the context of the feature gate rollout or experiment the metric is being measured in and is not a top-line metric value change across your whole user-base.
- Minimum Participating Units- You can set a minimum threshold of exposures you want to log before triggering an alert. We surface the 25/ 50/ 75th percentiles of exposure volume across your gates/experiments to help you choose a reasonable threshold.
- Direction- Positive or negative, depending on whether you want to be alerted based on your metric exceeding vs. dropping below a target threshold.
- Subscribers- By default, all creators of a feature gate/experiment with a metric that has an alert configured will be notified if an alert is fired. You can also add additional, global subscribers to a Rollout Alert, who will be notified if any feature gate or experiment regresses the metric beyond the target threshold. Note that in a large project adding yourself as a global subscriber of a metric risks being noisy.

Once a Rollout Alert has been configured for a given metric, you will see an “alert” alarm bell icon next to the metric inline in the Metrics Catalog. You can also filter for metrics with alerts set on them via the standard metrics filtering affordance next to the search bar.
Determining the Right Threshold
To help you configure the right threshold for your Rollout Alert, there is a preview of how much the metric has moved in the context of any feature gates or experiments containing that metric in the Scorecard.
To see how a given metric has trended over a longer period of time, hover over the metric delta for a given feature gate/experiment, and tap on a data point to view more details. This will open the time-series for the metric, with a configurable date range picker.
Alert UX
If a Rollout Alert is triggered, all subscribers and the relevant gate/experiment creator(s) will receive a notification via email, in the Statsig Console, and via Slack for users who have configured Slack notifications for their Statsig accounts.


Tapping on View Alert will take you into the Diagnostics page of the offending feature gate or experiment that triggered the Rollout Alert.

Once in the Diagnostics section, scroll to the Rollout Alerts section and select the active alert. You will see the metric delta trend with the threshold overlayed. To resolve the alert, tap Resolve inline, which will give you the option to either resolve the alert (+ provide an explanation), or snooze the alert for a specified period of time. The alert will show as resolved both inline in the Rollout Alerts section, as well as on the top of the Pulse page for the given gate/experiment.

Viewing Alert History
To view alert history, go to Metrics tab —> Metrics Catalog and select the metric you want to view alert history for. Then go to Alerts —> … menu in the Experiment and Gate Alerts section, and select View Alert History. You will be able to see all instances of the alert firing, being resolved, or being snoozed, as well as reason provided for resolution, who resolved the alert, and at what time.


Topline Metric Alerts
Available on Statsig Cloud, Topline Metric Alerts are currently in Beta as part of Statsig's Product Analytics suite. Topline Alerts are threshold based (anomaly detection coming soon) and are evaluated every 5 minutes.
Configuring a Topline Alert
To configure a Topline Alert, head to Analytics -> Topline Alerts tab where you can find all your Topline Alerts and configure new ones. Tap +Create and name your new alert.
Under alert configuration, there are a few settings-
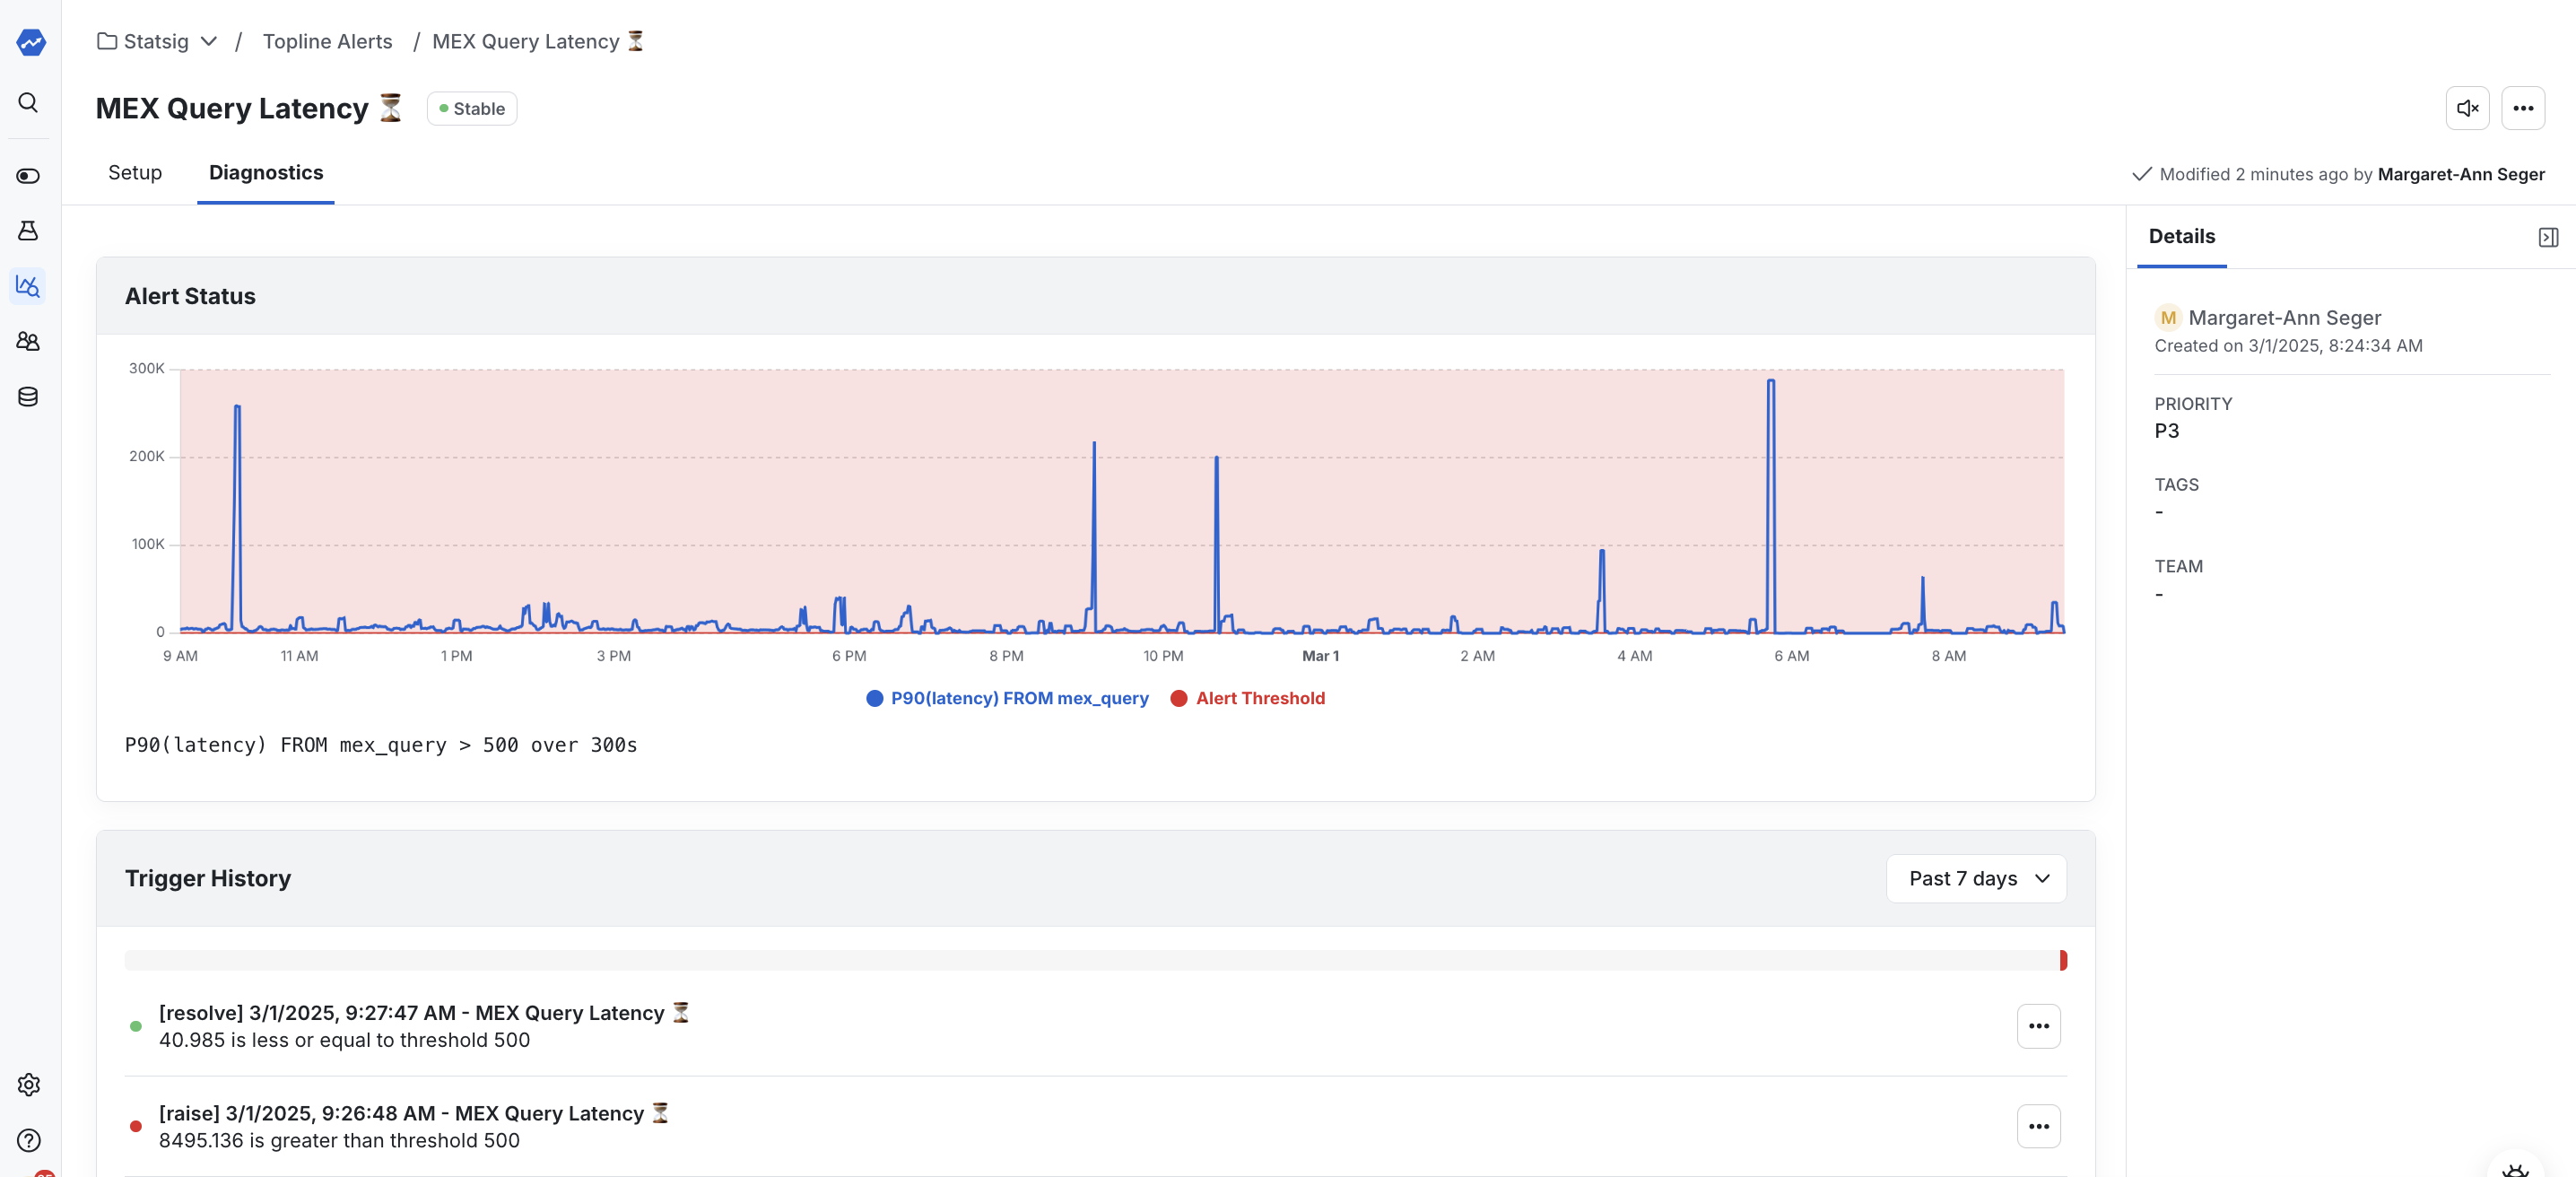
Event Configuration Set the event you want to alert on, then choose the aggregation for this event. In this example, we're going to set an alert on P90 latency of a Metrics Explorer (MEX query).
Our event name is "mex_query" and we log latency as a dimension of this event, so we will select the event, choose "P90" aggregation of the "latency" event dimension. You can also apply a filter to the event, for example I could filter out any Statsig internal employee queries.
We'll see a preview of the event values in the Alert Preview section above event configuration.
Alert Conditions The next step in configuring your alert is setting your alert conditions. Set the alert threshold, directionality, and an "Alert" and "Warning" value. Finally, choose the time window over which you want to evaluate the alert.
In my example, I'm setting a 500ms (5 second) alert threshold. And because I want to be evaluated quickly if anyone on the platform is having a poor query performance experience, I'll set the notification to evaluate and notify on all queries in the last 5 minutes.
Notification The final step in alert configuration is to configure your alert message and set the list of who should be notified when the alert fires. All alert subscribers will receive a notification via email, in the Statsig Console, and via Slack for users who have configured Slack notifications for their Statsig accounts.
When crafting your alert message, if you want to include dynamic content from the event itself, leverage the Code feature. In my example below, I'm including the impacted company name so I can quickly hop in and diagnose their slow query.
Viewing Alert History
To view alert history, head to the Diagnostics tab of the alert page, where you can see a history of the alert.
Alert Resolution
When an alert fires, it will show up as active at the top of the alert page. At this point, you can explore Samples of the event or explore the topline trend via Metrics Explorer.