For AI agents: a documentation index is available at /llms.txt. Append .md to any page URL for markdown, or send Accept: text/markdown.
Rollout Alerts
Get notified when experiments or feature rollouts cause metric regressions beyond preset thresholds.
How rollout alerts work
Rollout Alerts notify you when an experiment or feature gate moves a metric beyond a threshold you set, so you can catch regressions during a rollout. On Statsig Cloud, Statsig evaluates Rollout Alerts every 24 hours. Alerts trigger only if the cumulative metric delta is statistically significantly lower or higher than your threshold, which reduces alert noise.
On Statsig Warehouse Native, Statsig evaluates Rollout Alerts every time you load Metric Results in a feature gate or experiment. Loading Results on the first day provides more real-time visibility during this window. Alerts only trigger if the metric delta is statistically significantly lower or higher than your threshold, which reduces alert noise.
Statsig applies all stats methodologies you have enabled for your experiment or gate rollout (CUPED, Sequential Testing, and so on) to alert calculations.
Rollout Alerts don't alert at the topline metric value level, but rather at the experiment or feature gate level. For example, if you allocate an experiment to 10% of your users and the metric change within that 10% breaches the threshold, Statsig alerts you. All alerts you receive are in the context of a specific experiment or feature gate. To debug or resolve the alert, Statsig directs you to the relevant experiment or gate.
Setting up a rollout alert
To set up a metric alert, go to the Metrics tab, then Metrics Catalog, and search for the metric you want.
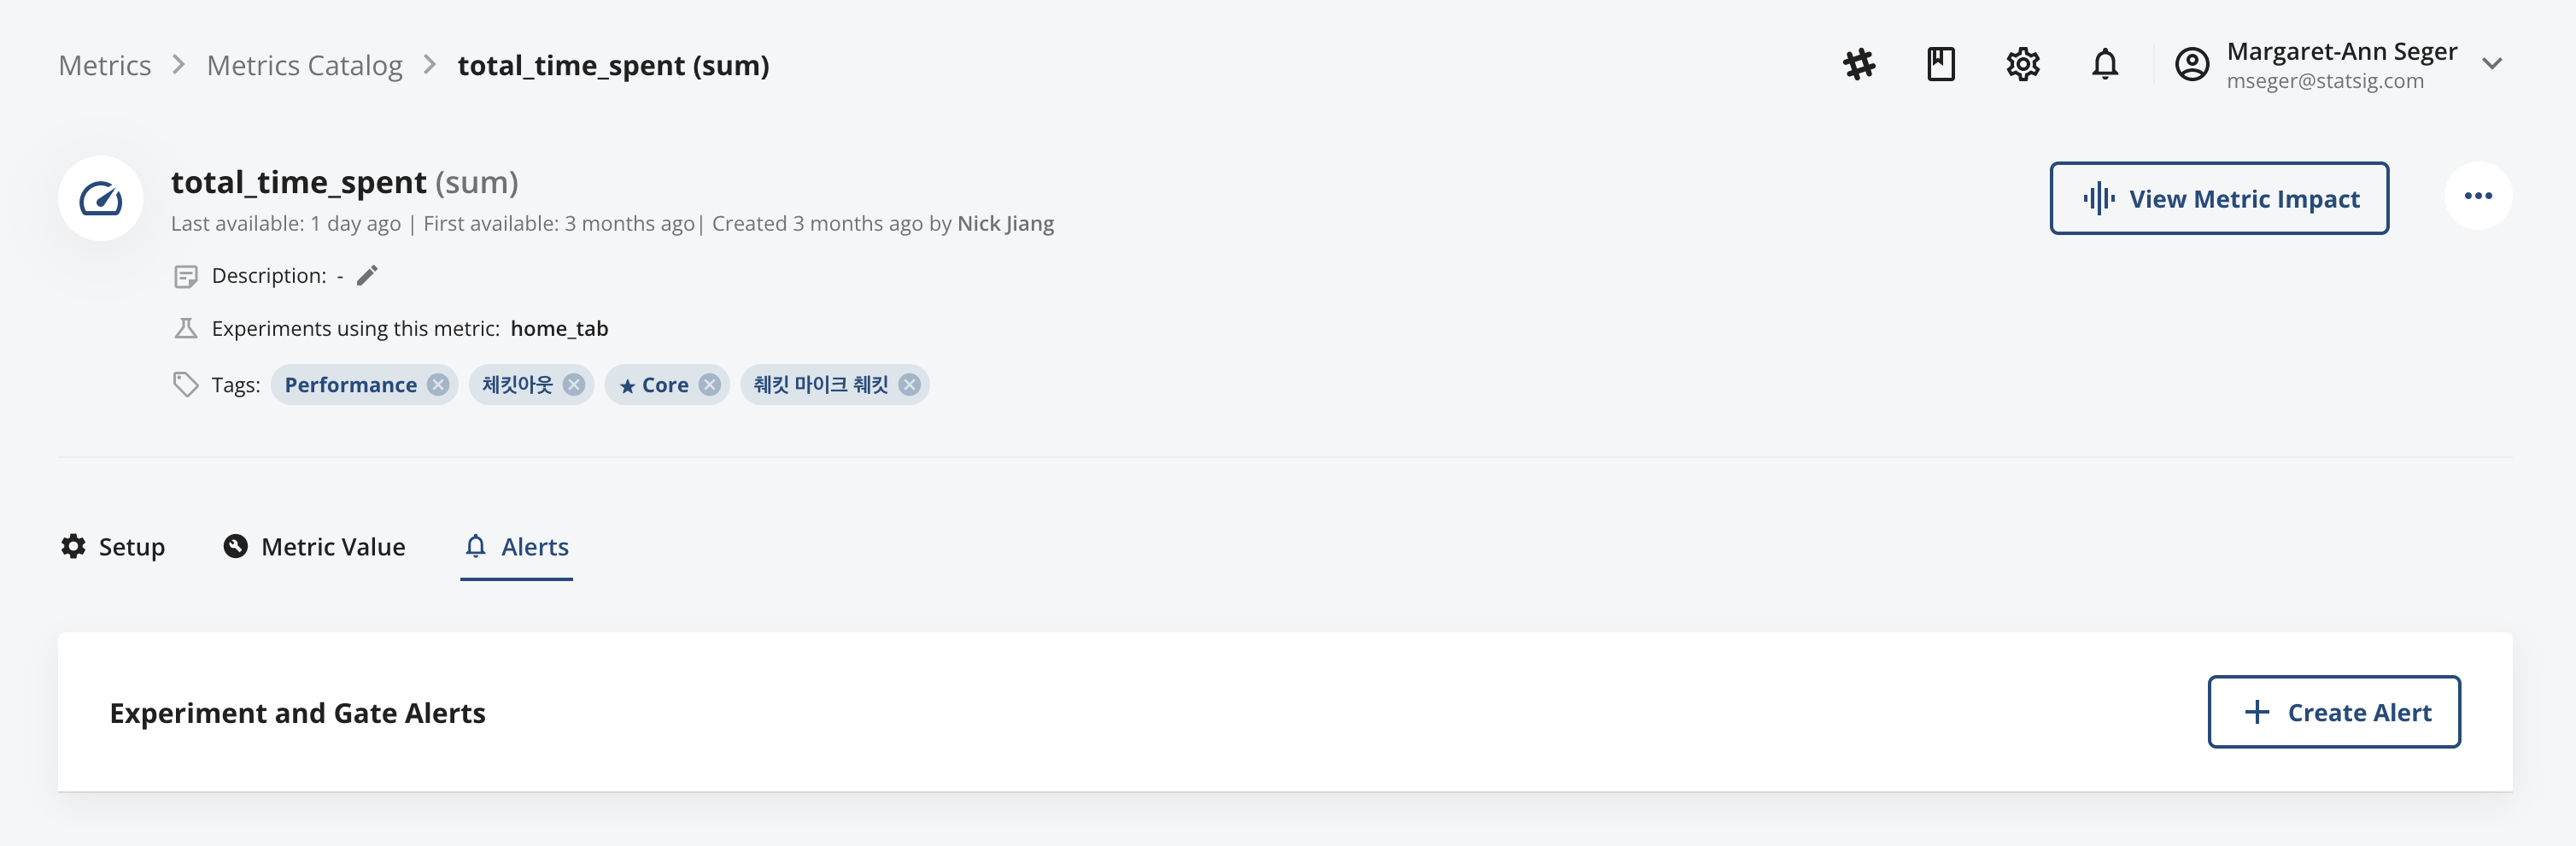
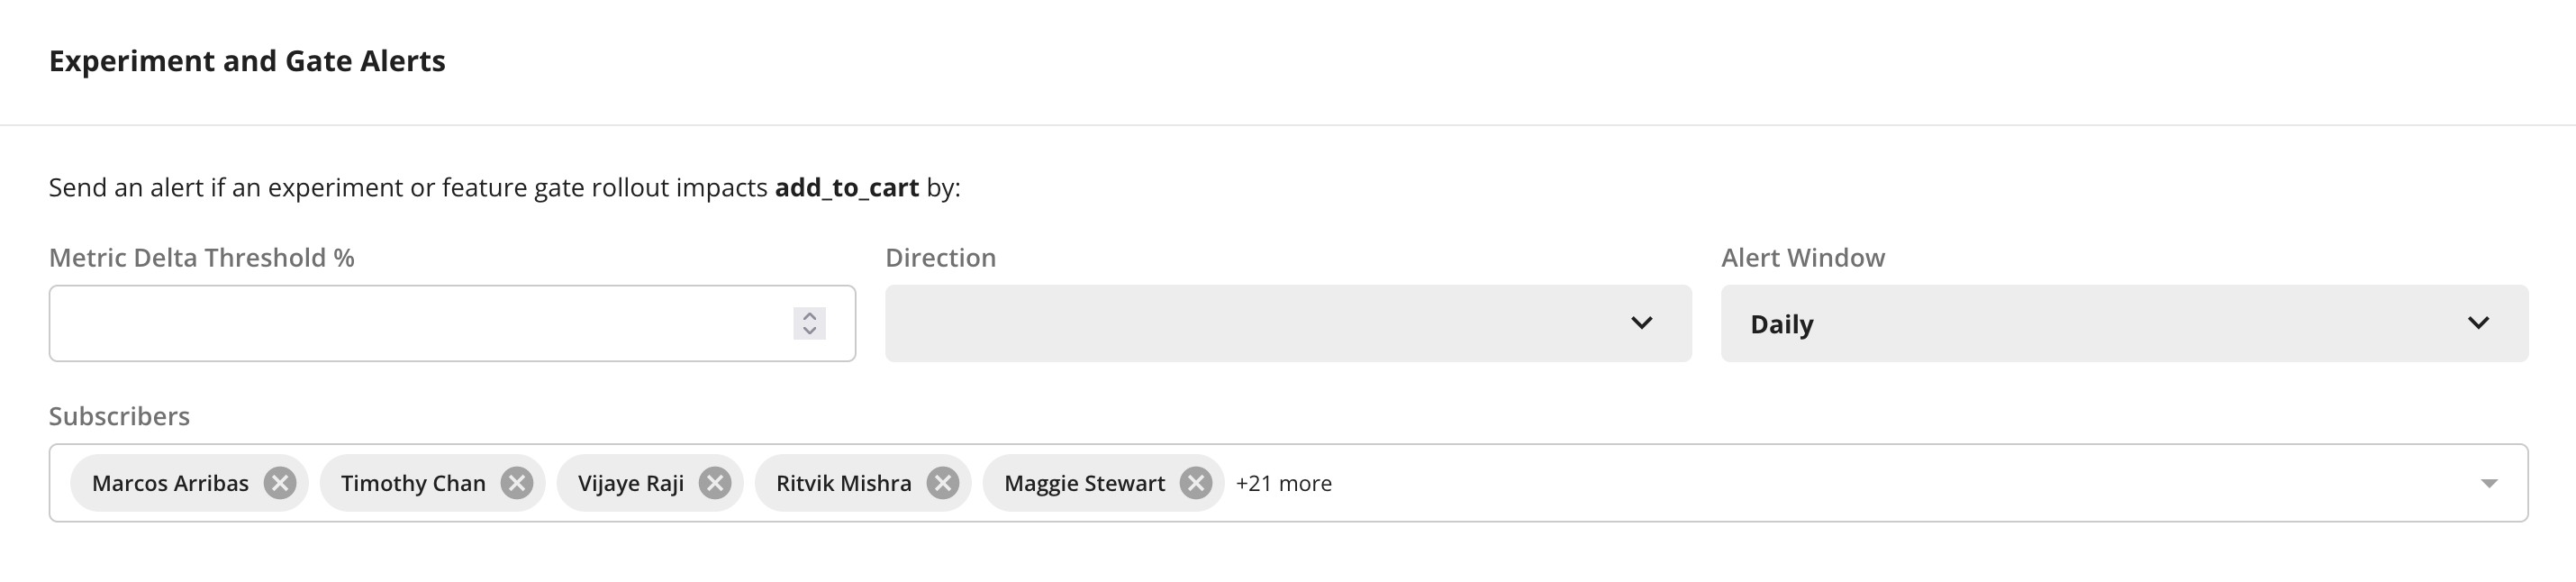
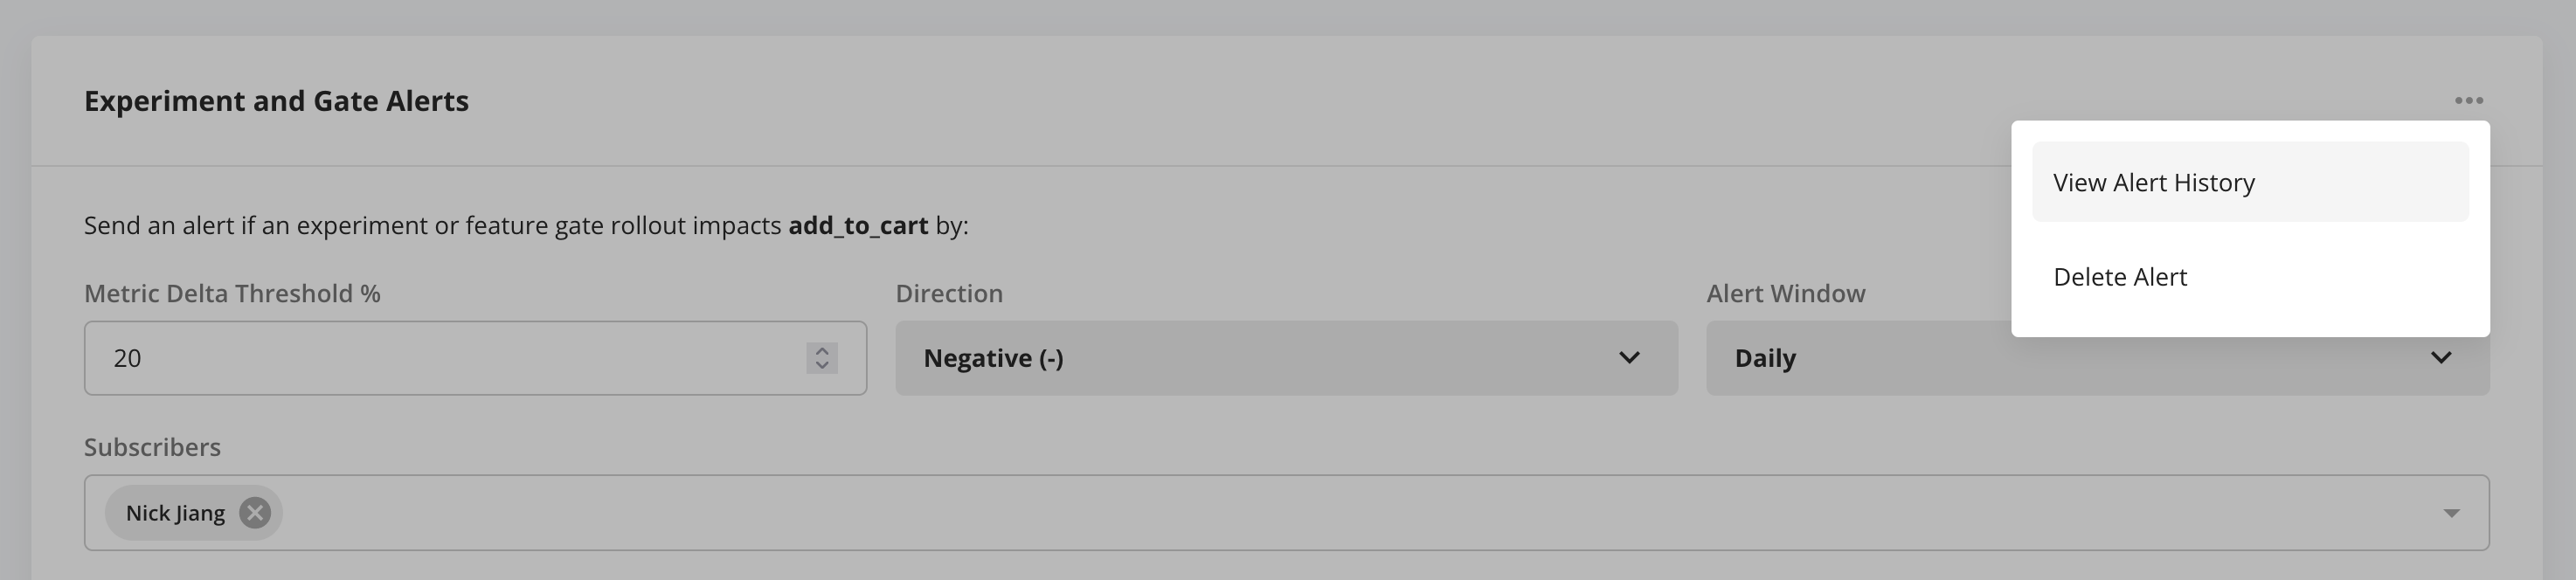
After you open the Metric Detail View, go to the Alerts tab and tap + Create Alert. Configure the following inputs:
- % Change: The metric delta threshold that triggers an automated alert. This delta is measured in the context of the feature gate rollout or experiment, not as a top-line metric change across your entire user base.
- Minimum Participating Units: The minimum number of unique units emitting the metric in each test group before triggering an alert. Statsig displays the 25th, 50th, and 75th percentiles of metric-emitting unit counts per group across your gates and experiments to help you choose a reasonable threshold.
- Direction: Positive or negative, depending on whether you want an alert when the metric exceeds or drops below a target threshold.
- Subscribers: By default, Statsig notifies all creators of a feature gate or experiment with a configured alert when the alert fires. You can also add global subscribers, whom Statsig notifies when any feature gate or experiment regresses the metric beyond the threshold. In a large project, adding yourself as a global subscriber of a metric can generate high alert volume.
After you configure a Rollout Alert for a metric, an alarm bell icon appears next to the metric in the Metrics Catalog. You can also filter for metrics with alerts using the standard metrics filter next to the search bar.
Determining the right threshold
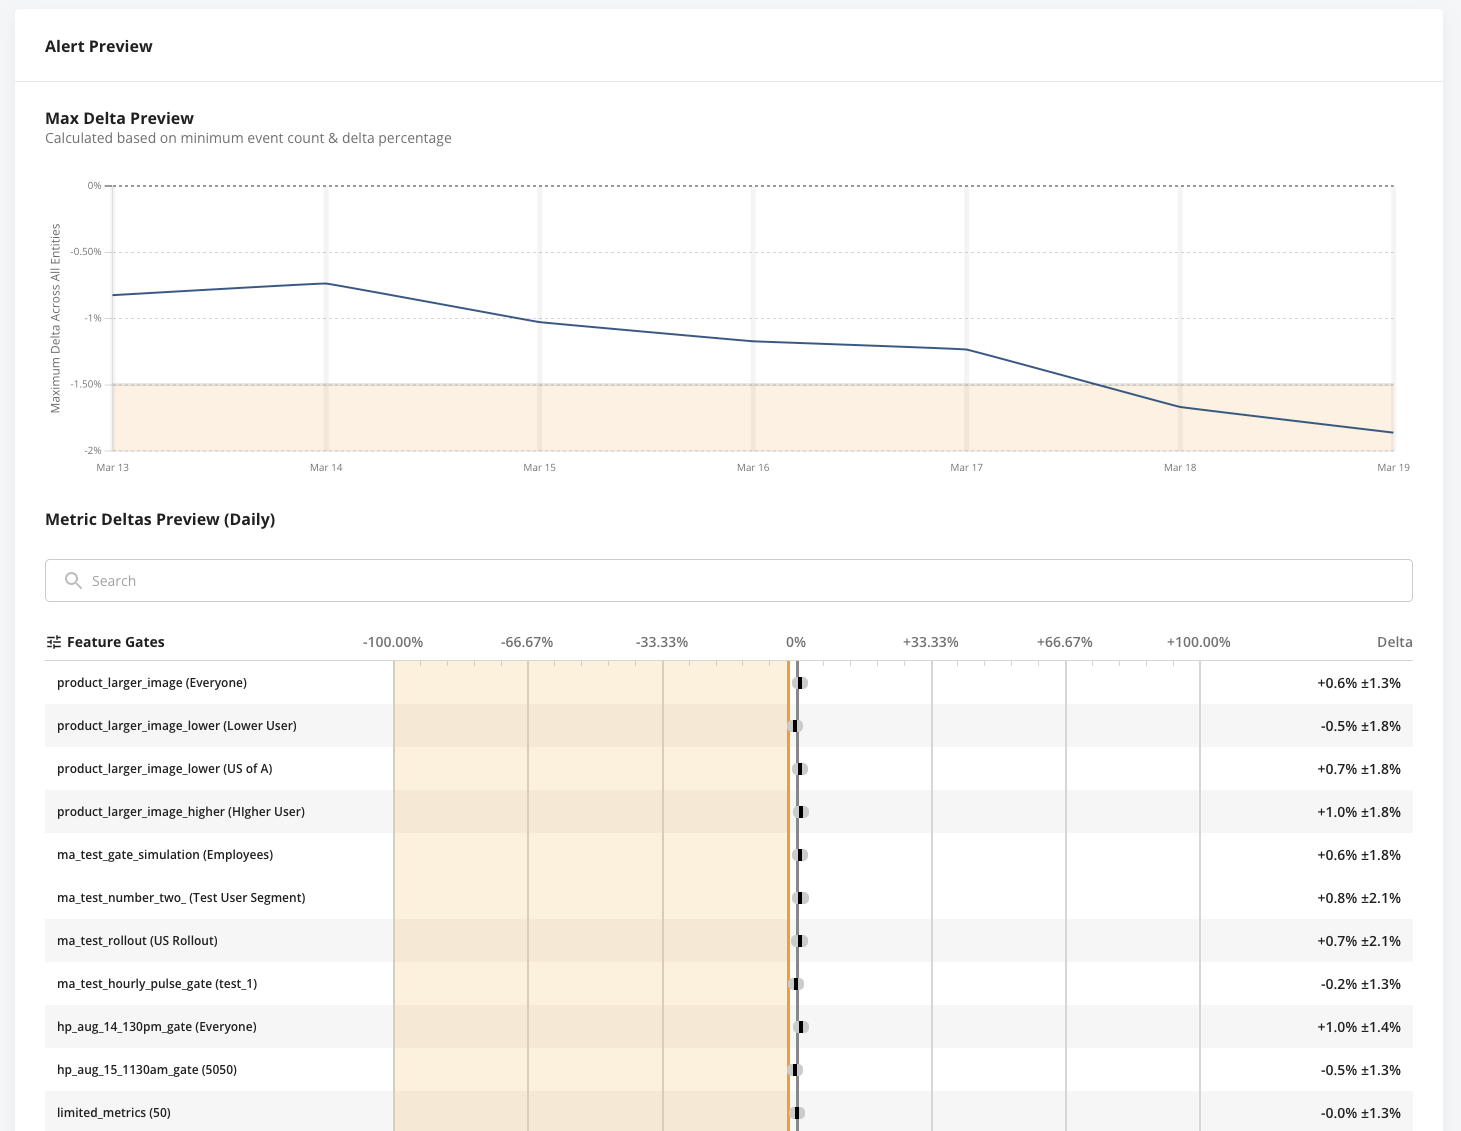
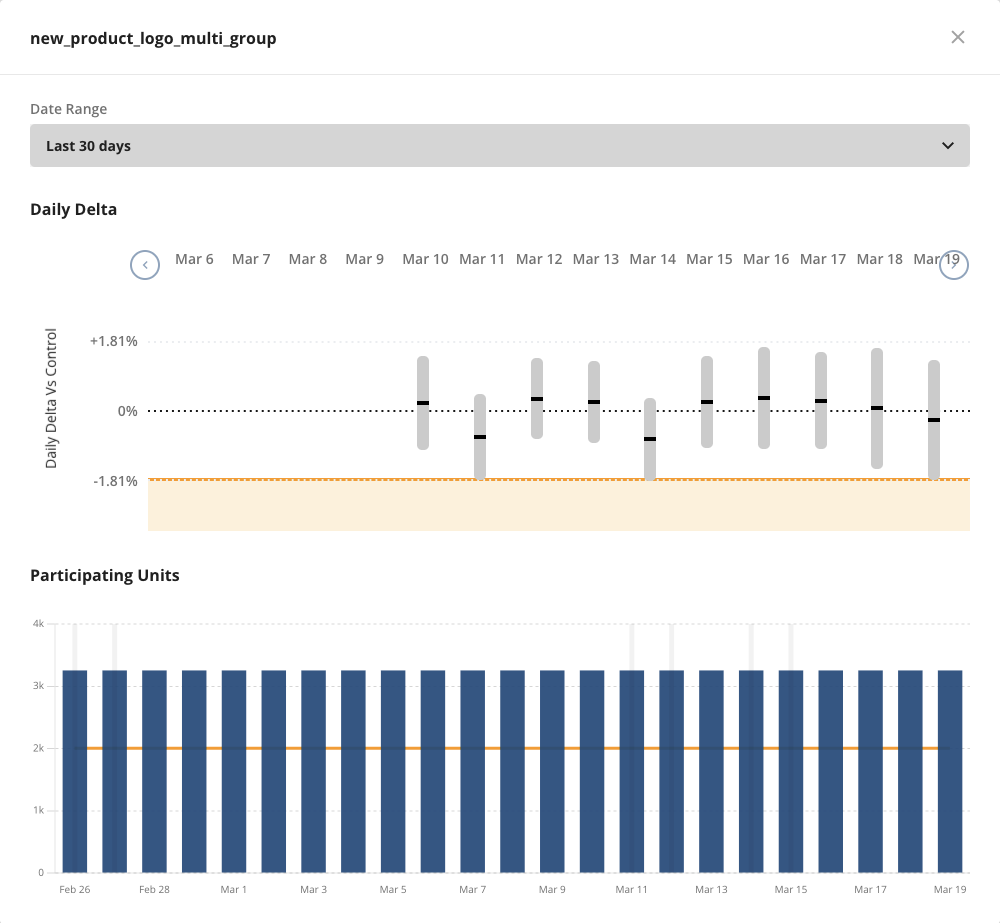
To help you configure the right threshold, the Scorecard shows a preview of how much the metric has moved in the context of any feature gates or experiments containing that metric.
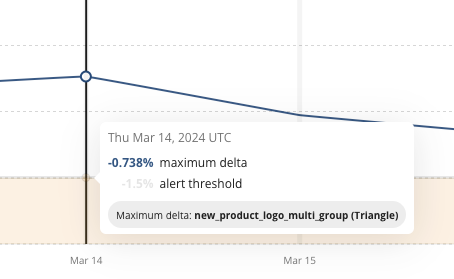
To see how a metric has trended over a longer period, hover over the metric delta for a feature gate or experiment. Then tap a data point to view more details. Tapping the data point opens the time-series for the metric, with a configurable date range picker.
Alert notifications and resolution
When a Rollout Alert triggers, all subscribers and the relevant gate or experiment creators receive a notification by email and in the Statsig Console. Users who have configured Slack notifications for their Statsig accounts also receive the notification through Slack.
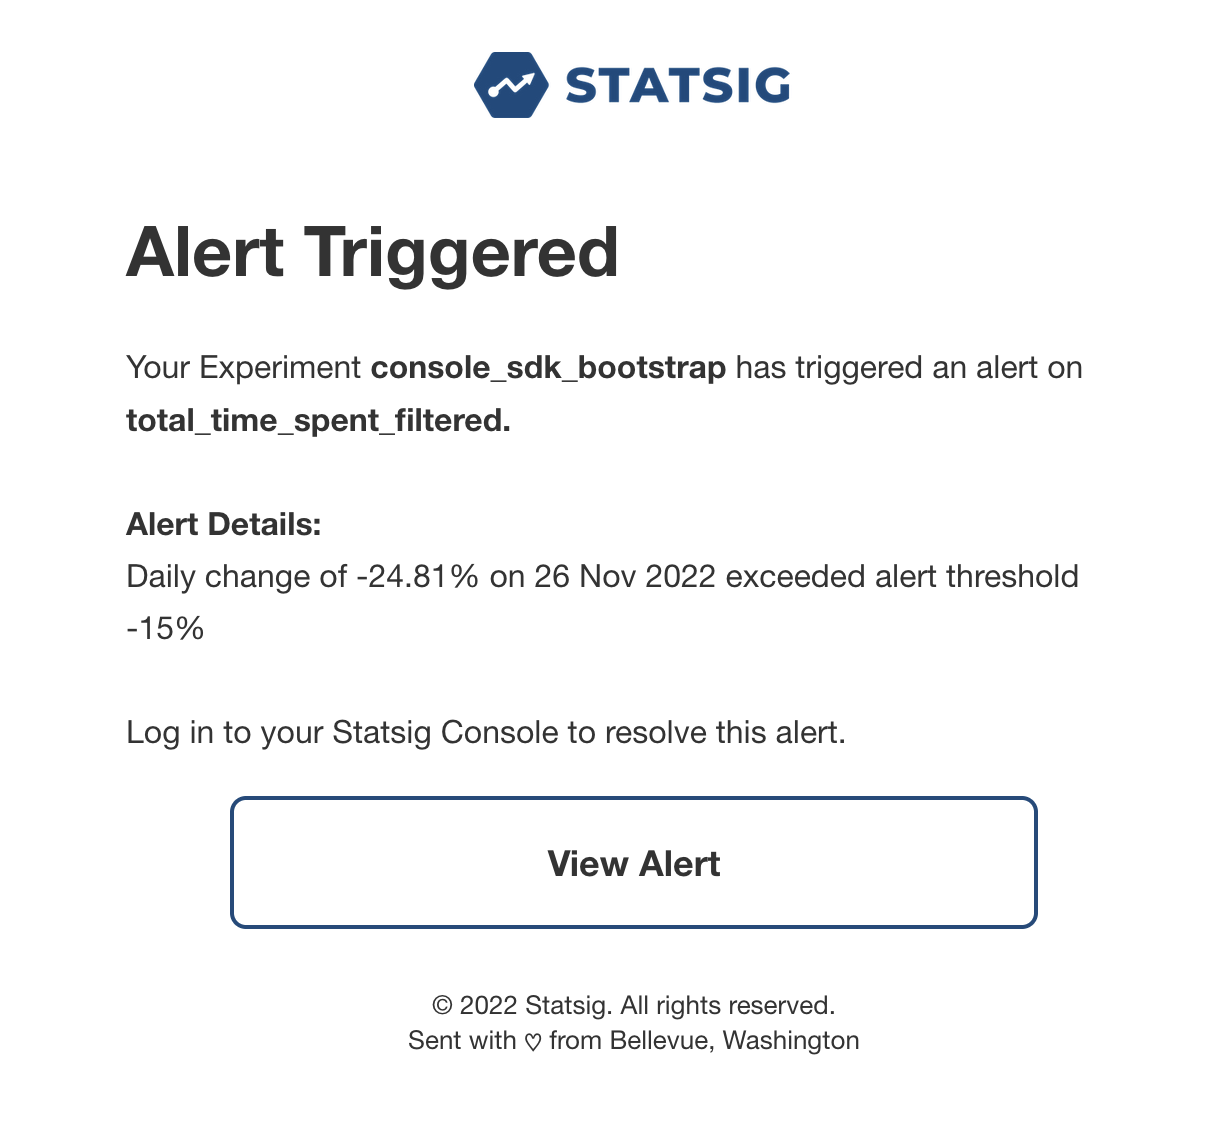

Tapping View Alert takes you to the Diagnostics page of the offending feature gate or experiment that triggered the rollout alert.
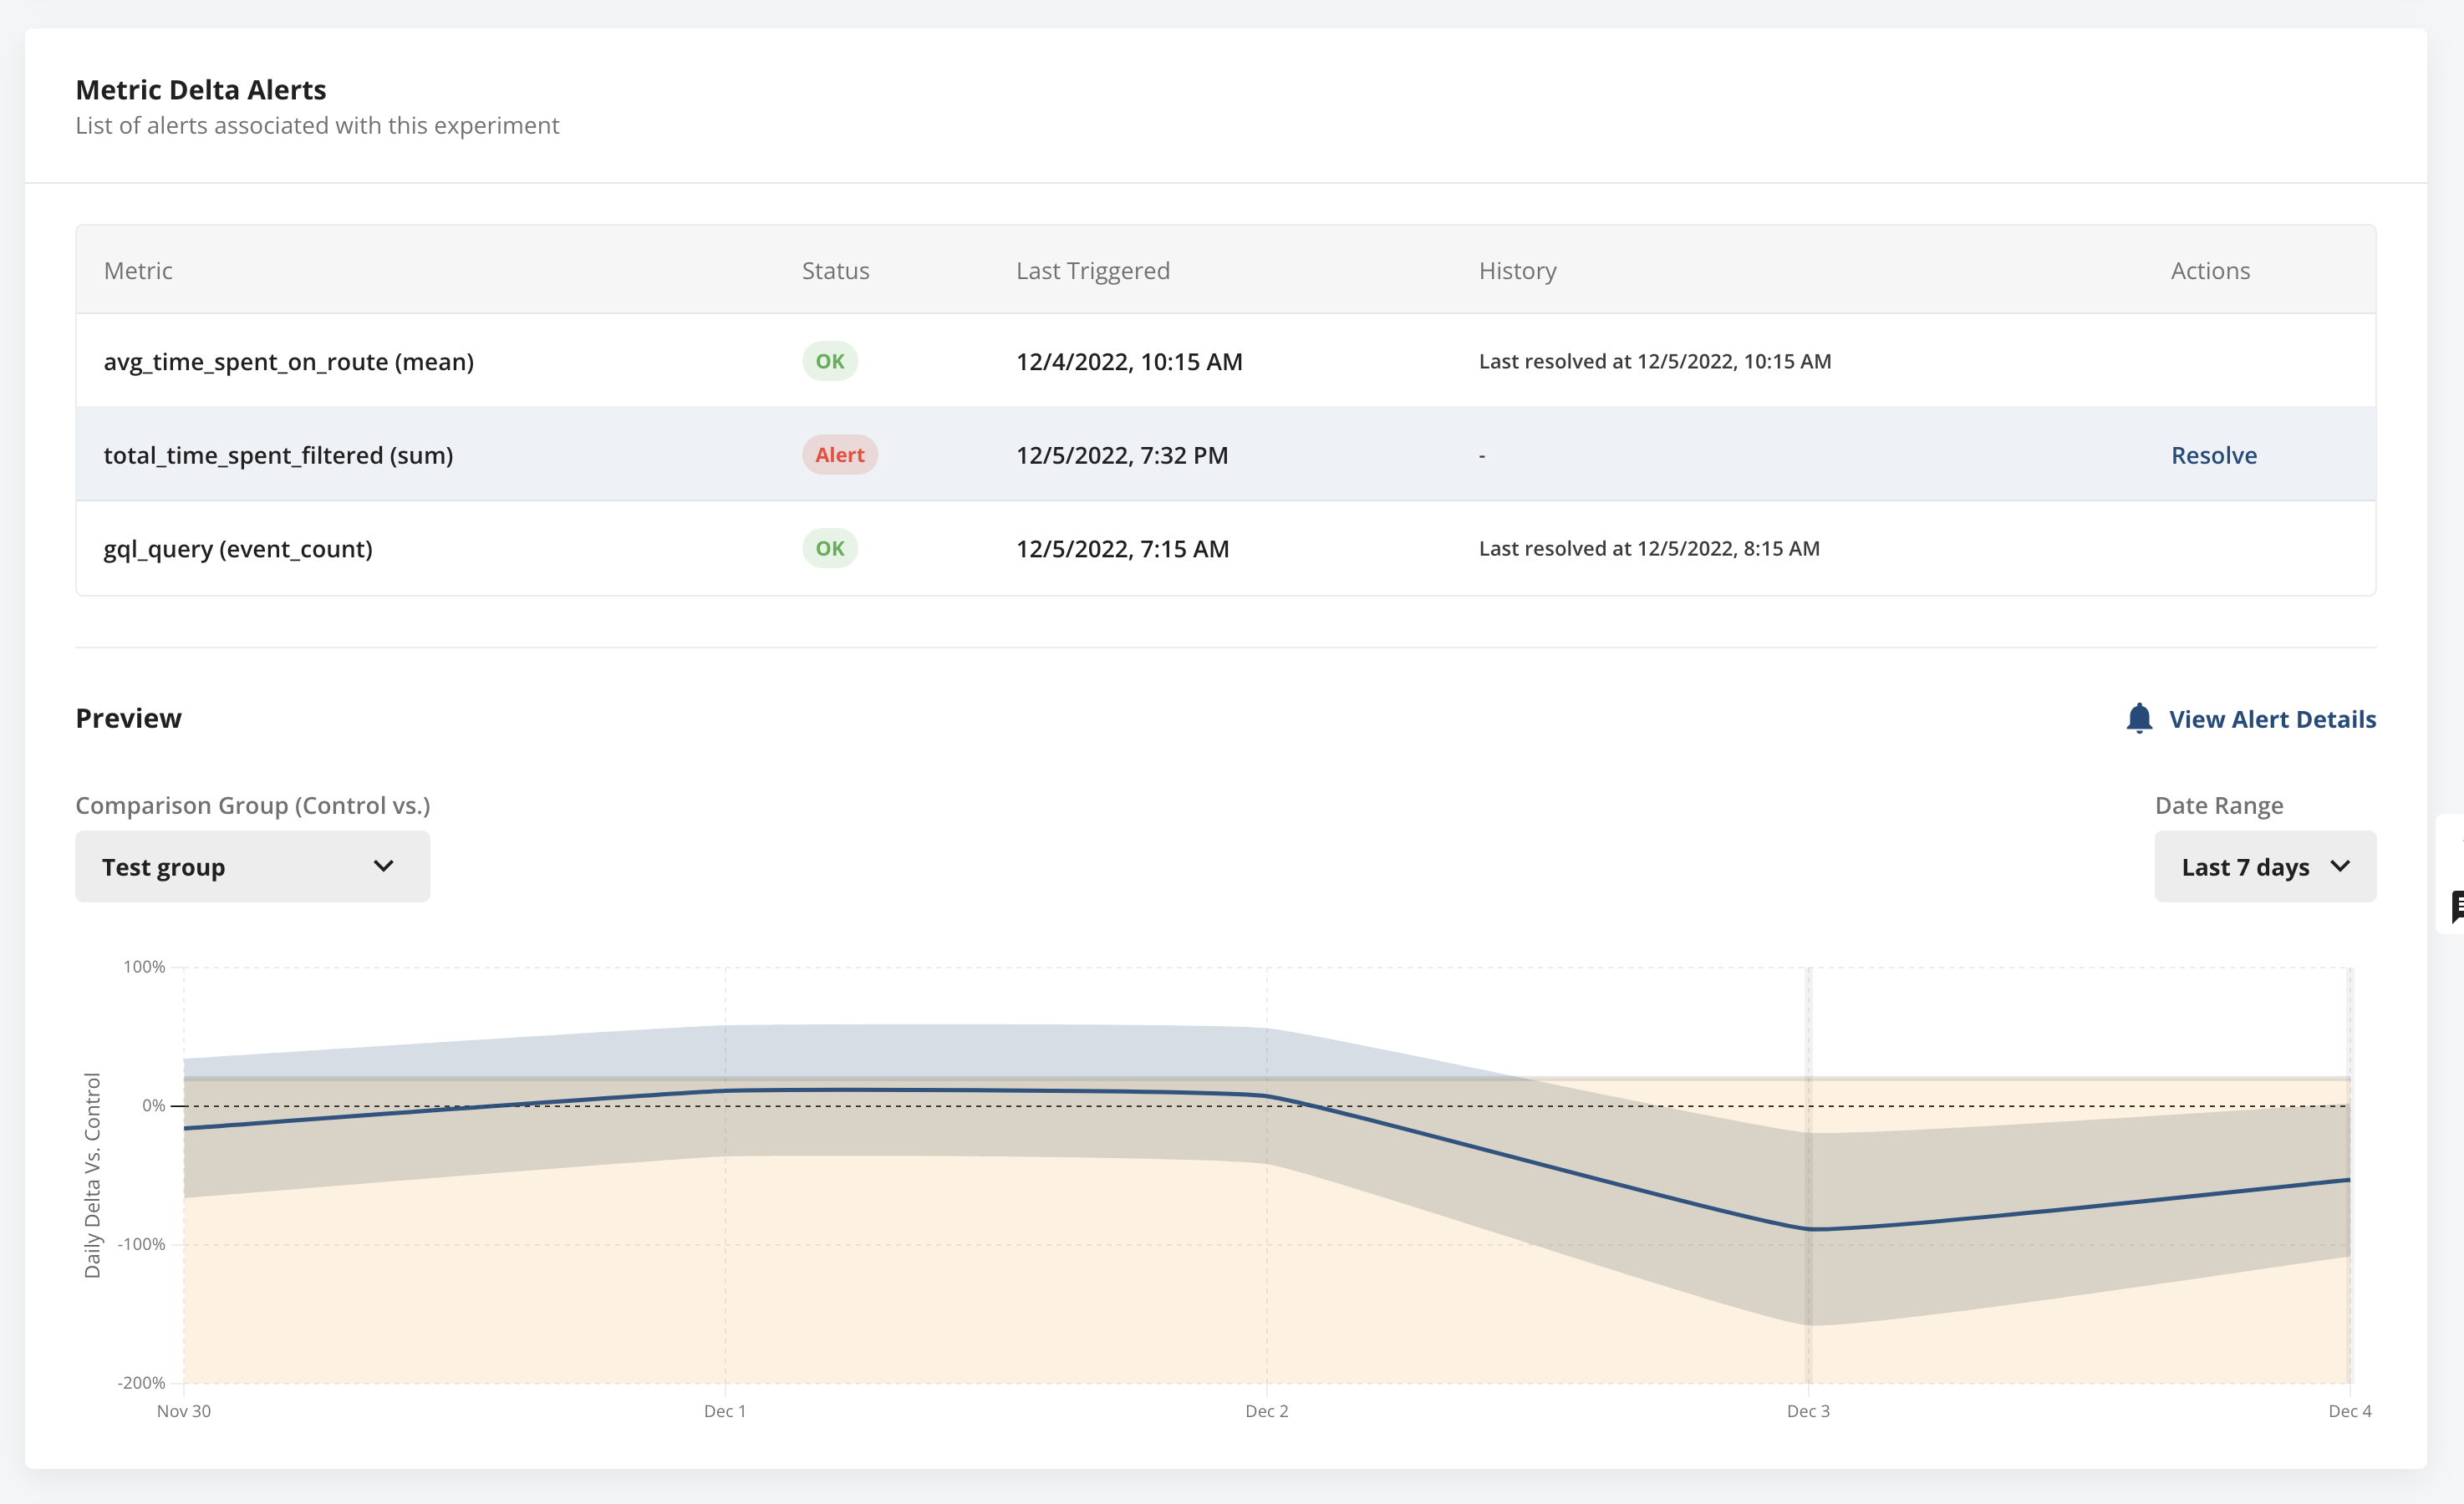
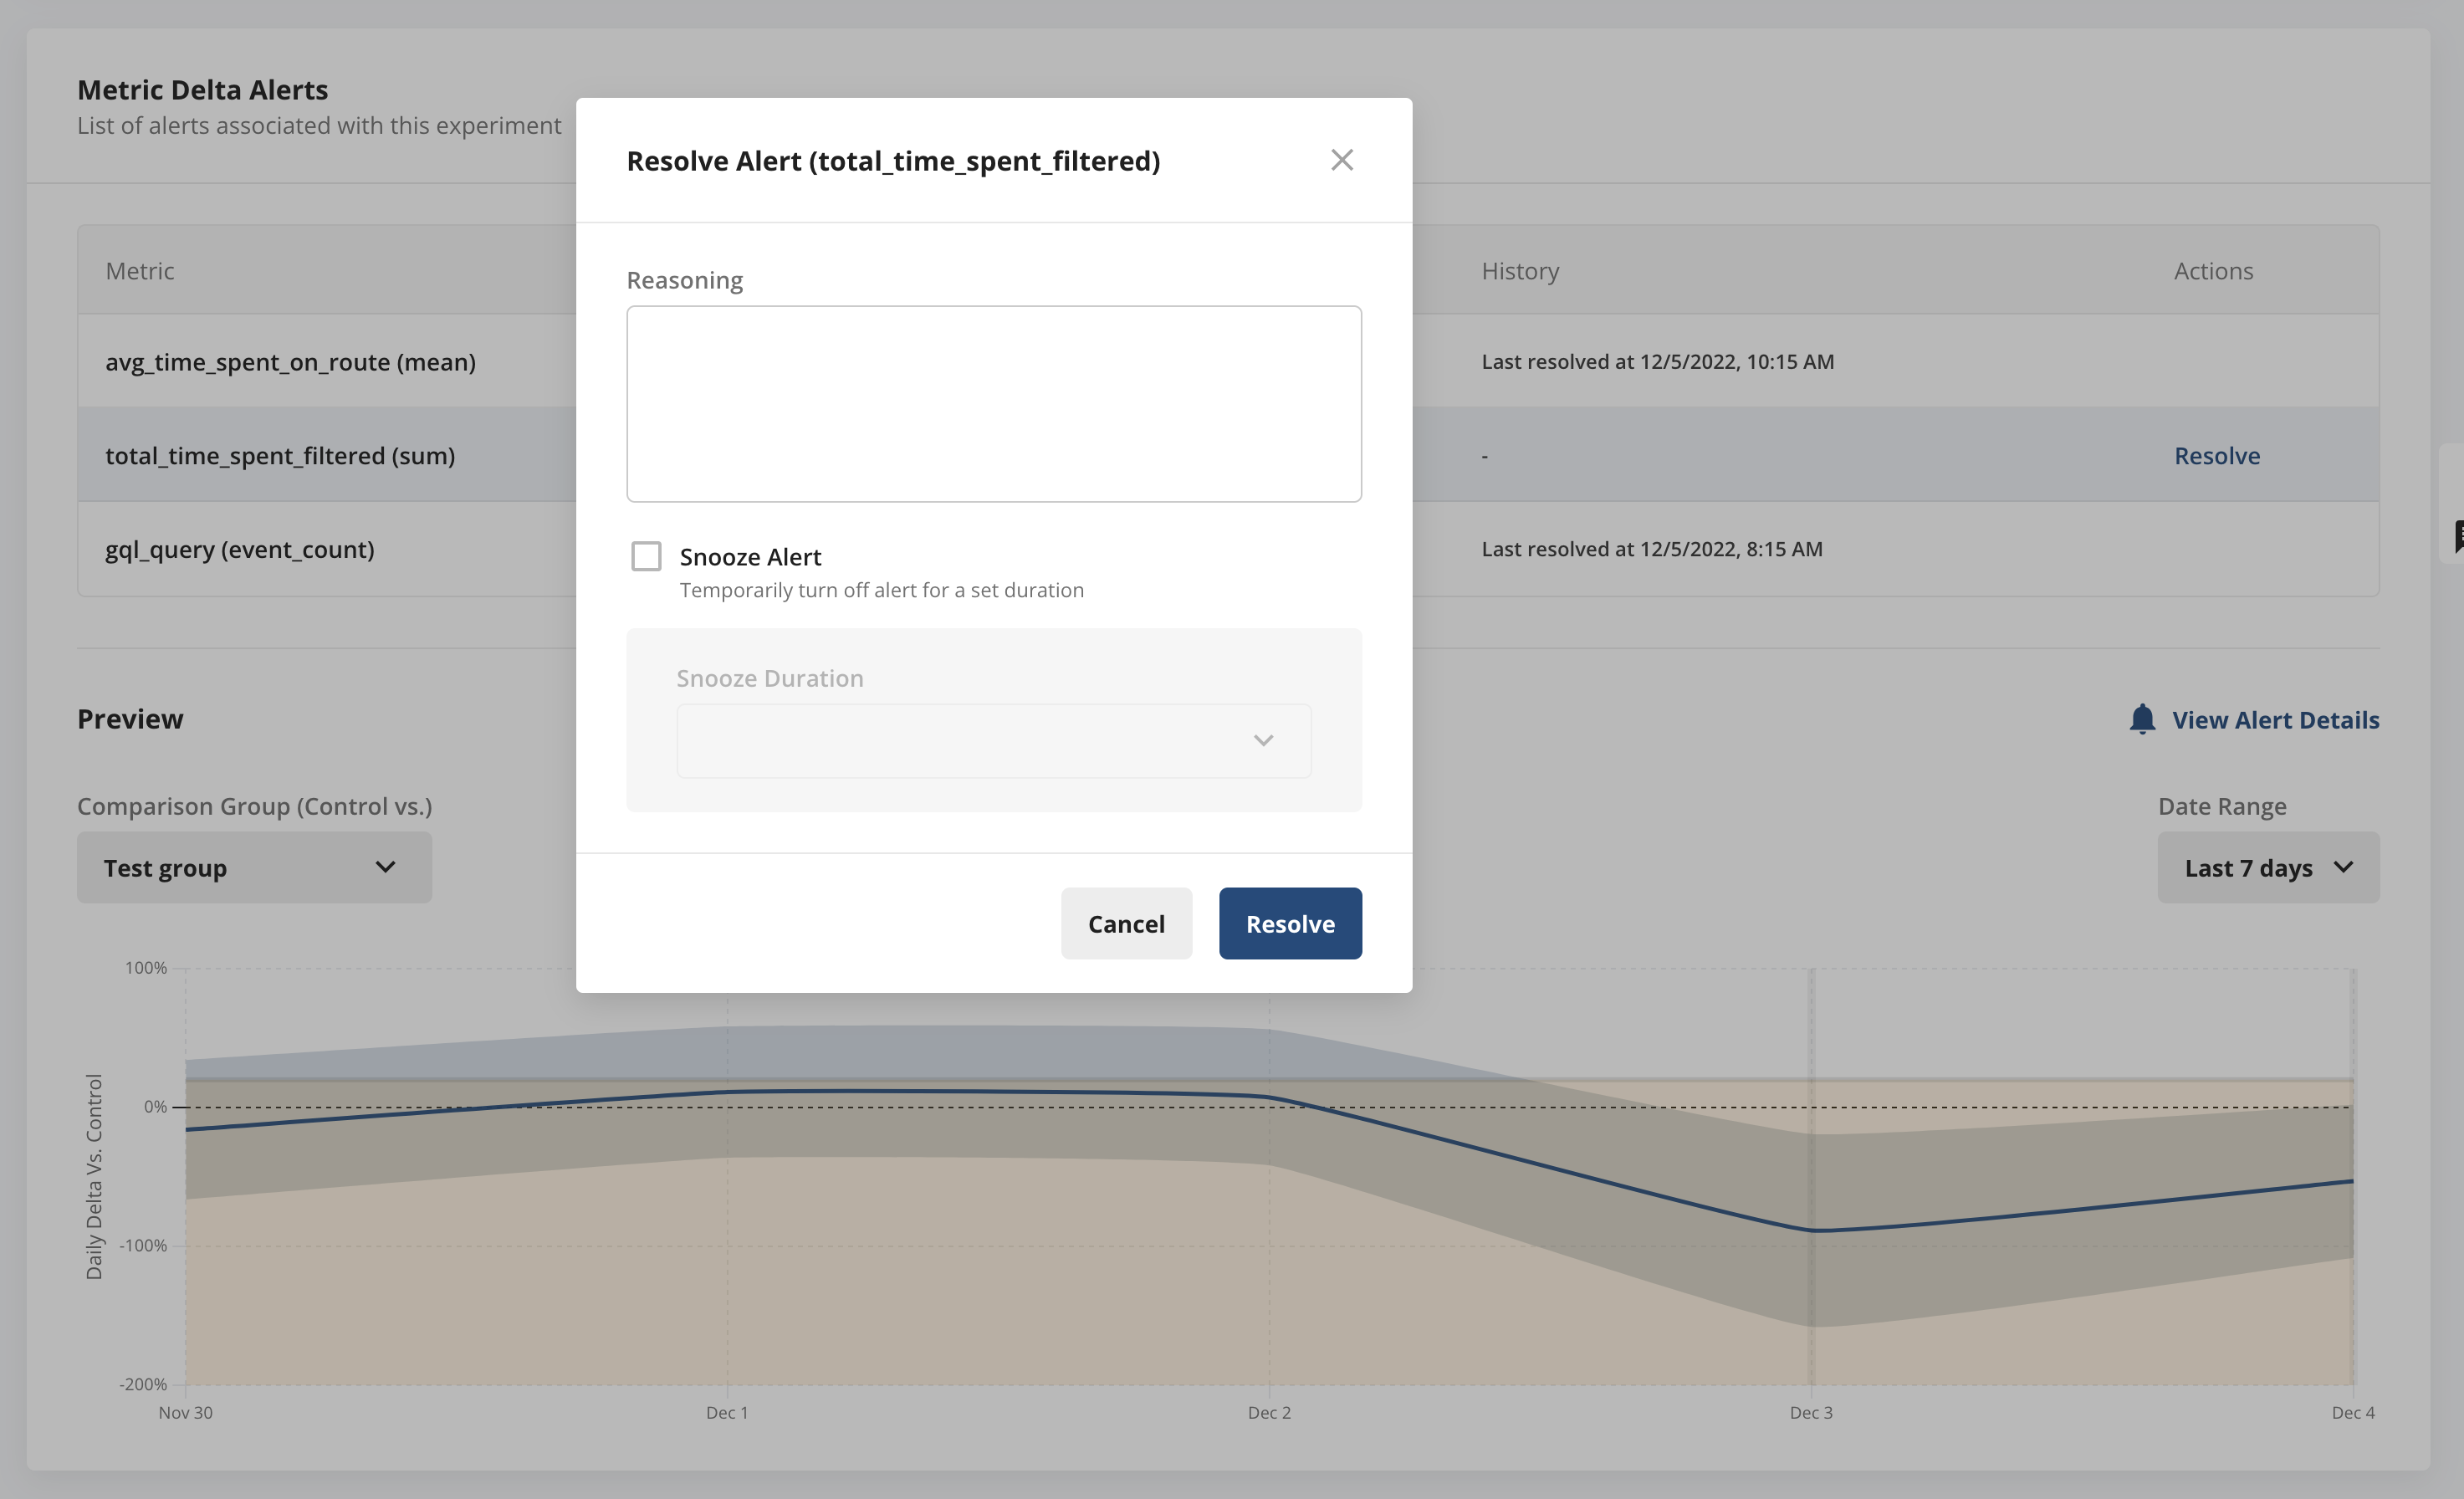
In the Diagnostics section, scroll to the Rollout Alerts section and select the active alert. The metric delta trend appears with the threshold overlaid. To resolve the alert, tap Resolve inline. You can either resolve the alert and provide an explanation, or snooze the alert for a specified period. The alert status updates both in the Rollout Alerts section and at the top of the Pulse page for the gate or experiment.
Viewing alert history
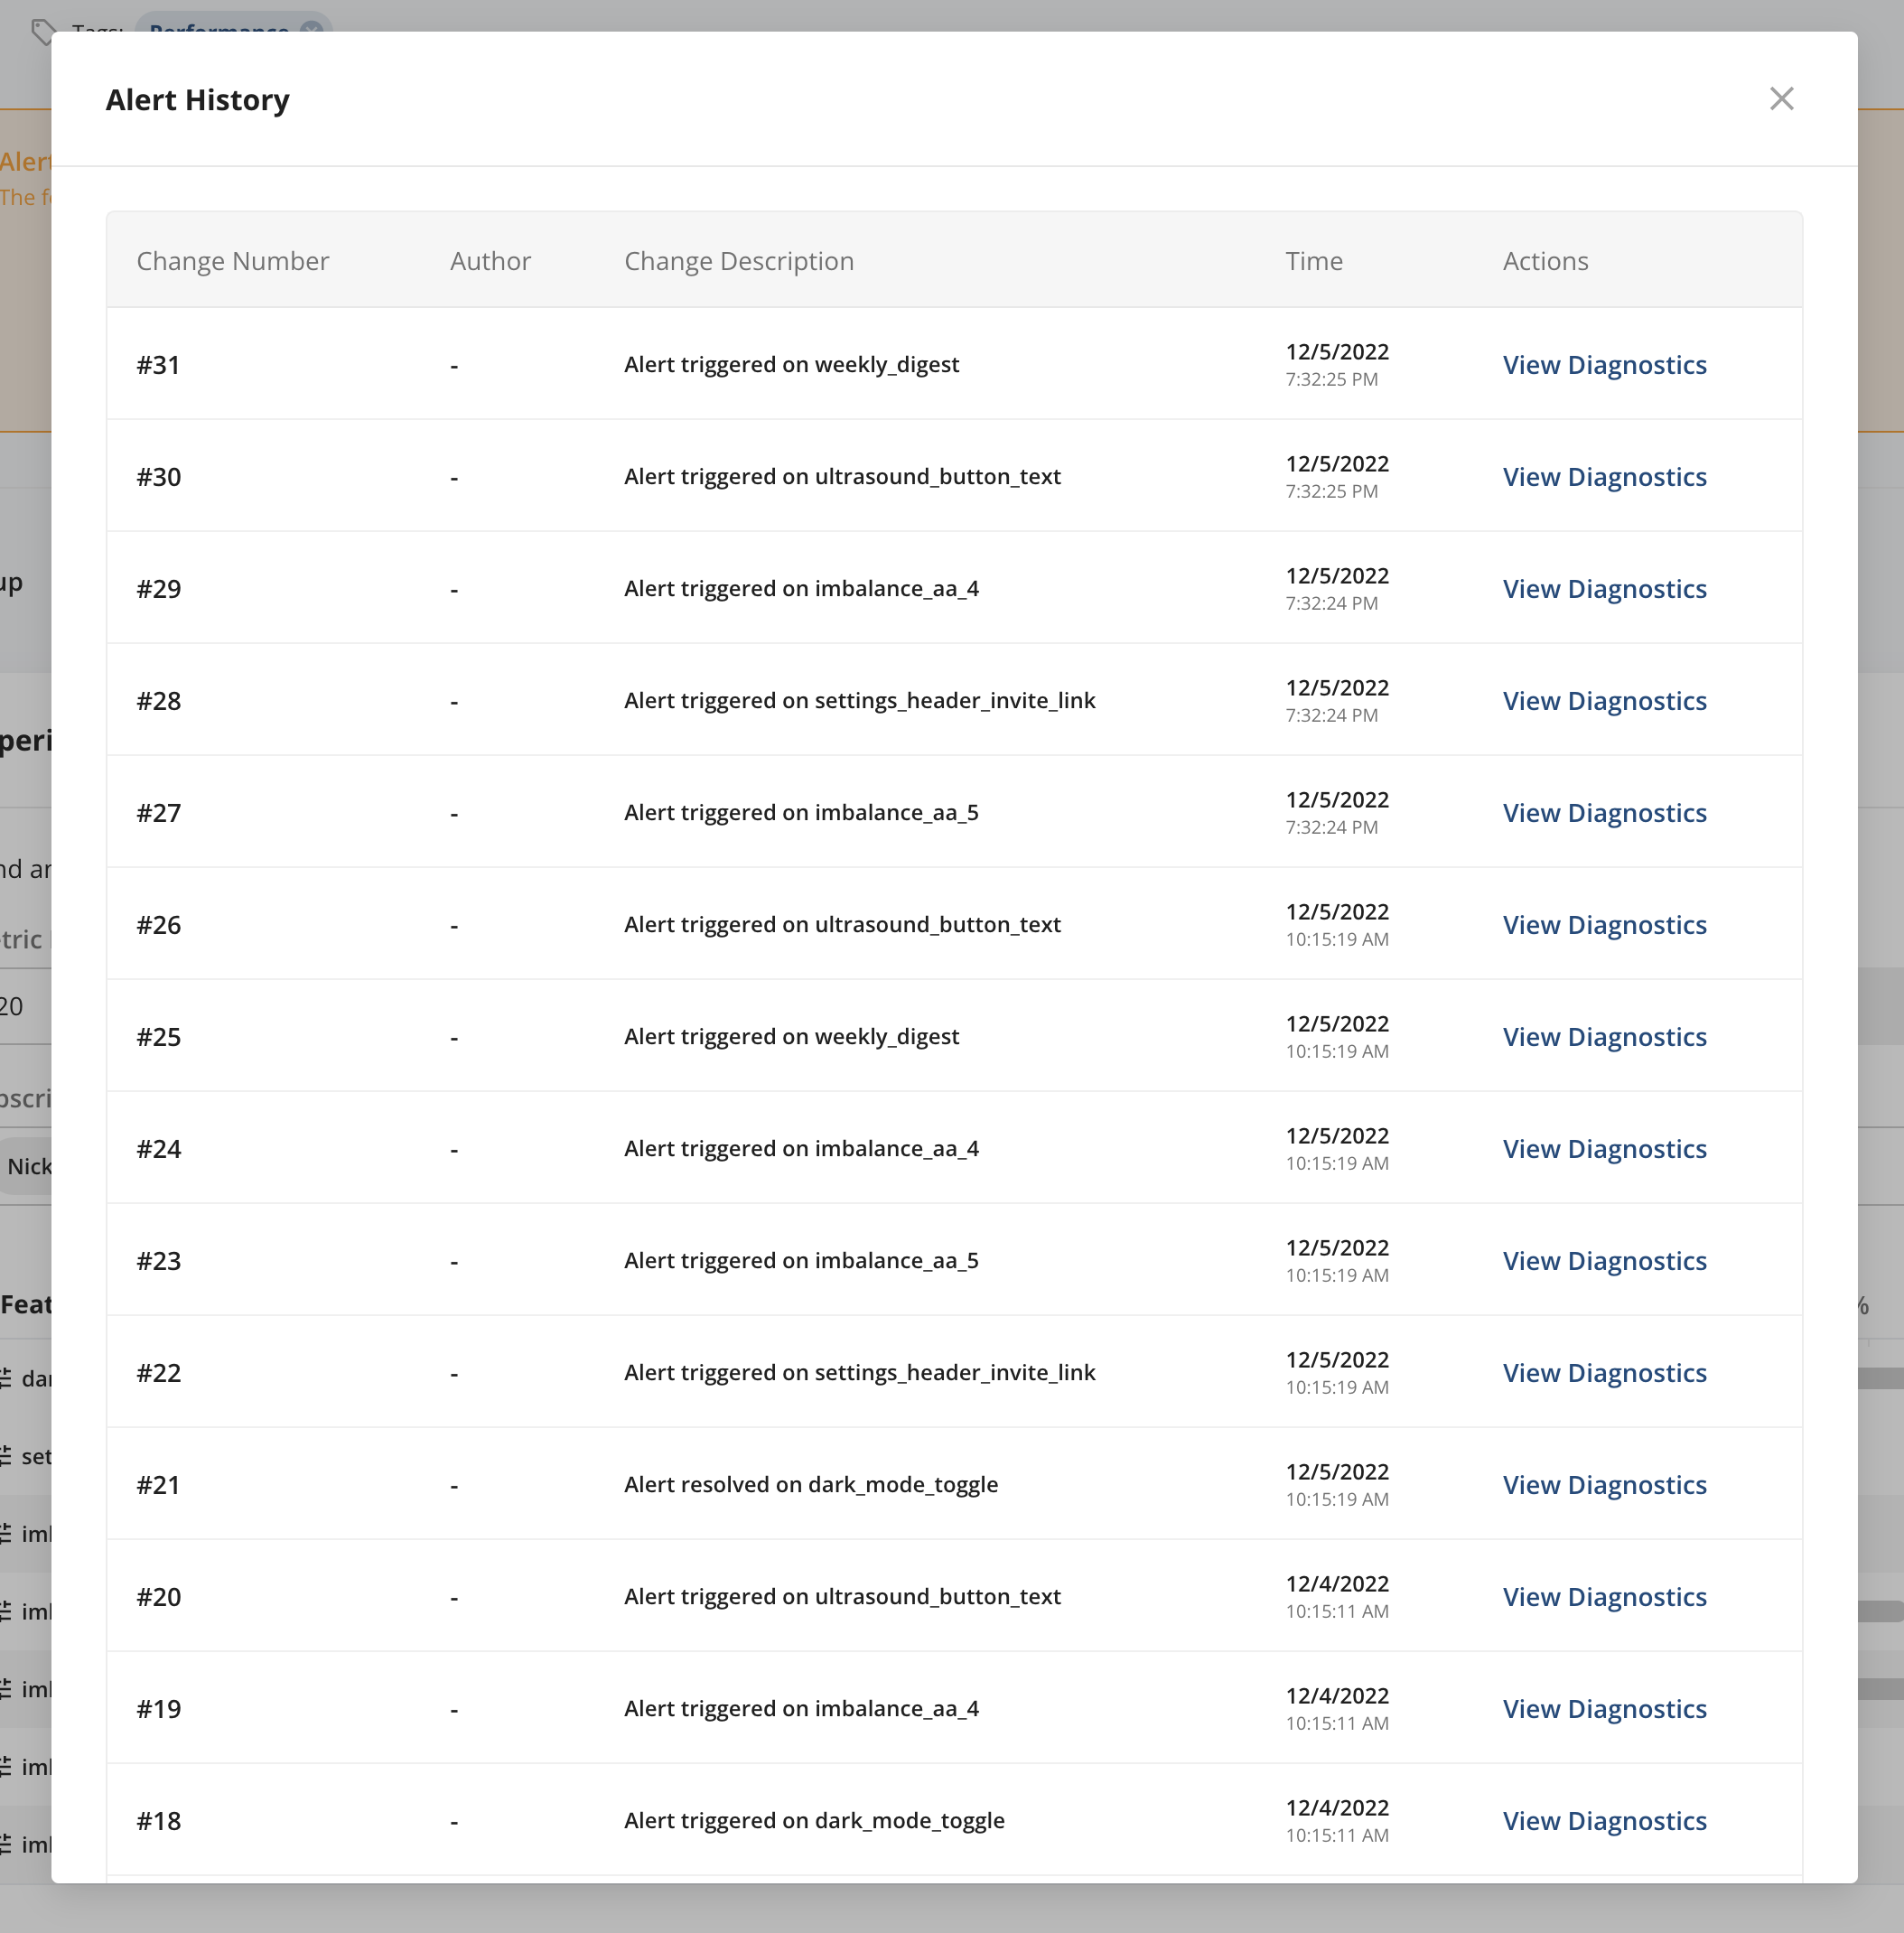
To view alert history, go to the Metrics tab, then Metrics Catalog, and select the metric. Then go to Alerts, open the … menu in the Experiment and Gate Alerts section, and select View Alert History. The history shows all instances of the alert firing, being resolved, or being snoozed, along with the resolution reason, who resolved the alert, and when.
Was this helpful?