Bootstrapping Your Experimentation Program
Best practices for running an experimentation program on Statsig Warehouse Native, including org design, metric hygiene, review processes, and tooling.
Building an experimentation program on Statsig takes five steps: generating product ideas, running your first A/B test, sharing results, accelerating your experiment velocity, and building a culture of learning. You can start on Statsig’s free tier, which includes up to 5M events per month and no limit on the number of team members.
1. Generate product ideas
Generating ideas for experimentation is essential to running a successful program. Common methods include dogfooding your product, studying competitors, analyzing existing metrics, and gathering UX research and user feedback.
Here are three common frameworks used at Statsig and among customers:
Generate ideas based on your business context
Turn every upcoming feature into an experiment:
- At Statsig, teams place new features behind feature flags. Statsig’s Feature Flags (also called "gates") automatically convert a feature rollout into an A/B test, measuring the impact on key metrics as the rollout progresses. If your engineering team already uses feature flags for releases, this approach is the most direct path to your first A/B test.
Work backwards from company goals:
- Many customers begin by aligning experiments with strategic company goals. For example, if the goal is to drive adoption growth, break down the goal into actionable metrics (e.g., total revenue, monthly active users). Then run experiments that can move those metrics incrementally. Instead of targeting broad goals like revenue, focus on specific, actionable metrics like checkout completions or user onboarding time.
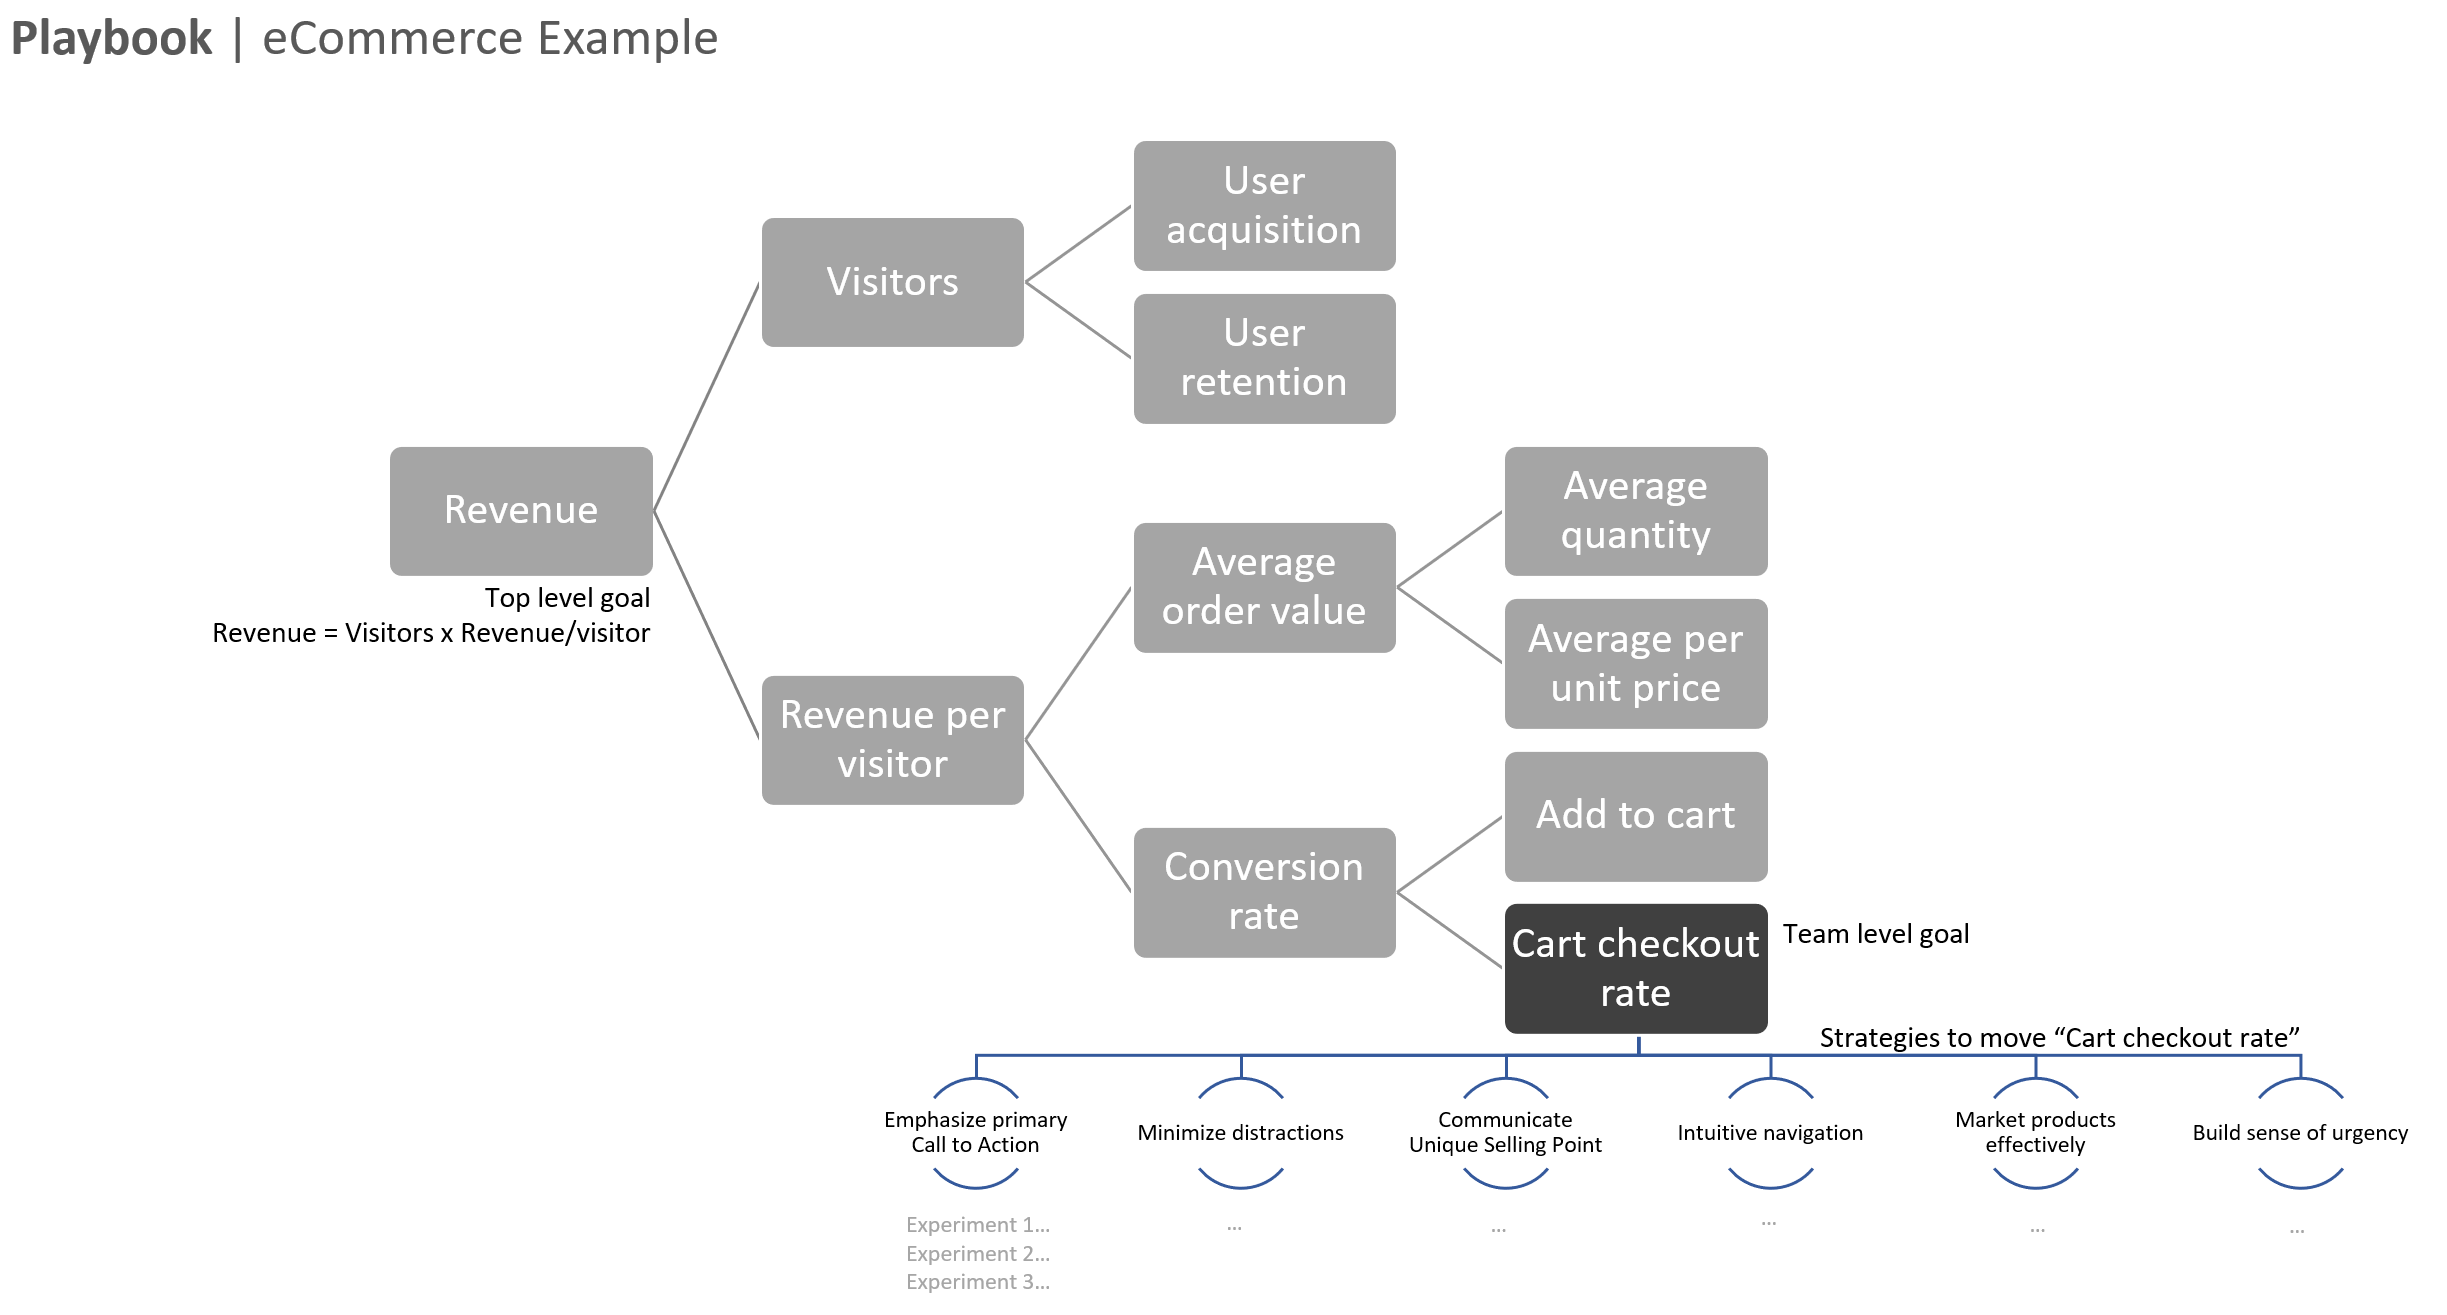
Break down your business levers:
- Decompose key drivers of your business to reveal more granular areas where you can experiment. For example, an e-commerce business might focus on increasing the checkout rate, which could lead to experiments on improving the CTA, reducing friction, or building urgency.
Prioritize your ideas
Use a simple return-on-investment (RoI) approach to prioritize your experimentation ideas:
- Choose ideas that are simple to execute, easy to measure, and high in potential.
- Start with ideas that are easy to implement. After running a few experiments, focus on higher-impact or more controversial ones.
A prioritized list of ideas accounts for more than half the work in running a successful experimentation program.
(Optional) Create a Backlog
You can create an experimentation backlog from your list of ideas. Because running experiments often generates more ideas, treat the backlog as optional and useful for future planning.
2. Run a simple A/B test
Clarify your hypothesis
Start by formulating a hypothesis for one of your high-priority ideas. A well-framed hypothesis defines the expected outcomes of your experiment, which makes it easier to align with stakeholders and evaluate results objectively.
A hypothesis consists of three key elements: Action, Predicted Outcome, and Rationale. Example:
| Element | Example |
|---|---|
| Action | If you reduce the number of fields on the sign-up page |
| Predicted Outcome | Then the percentage of users that complete sign-up will increase |
| Rationale | Because users will spend less time and effort, leading to higher completion rates |
Create your experiment
To create an A/B test, go to the Statsig Console:- Name your experiment.
- Define the variants you want to test.
- Set the percentage of users eligible to participate.
Set up your application for the experiment
To start the experiment:
- Use a Statsig SDK to assign users to experiment variants.
- Validate assignments through the Diagnostics tab in the Statsig console. Refer to the quick start guide to set this up.
To compute results, you can:
- Log events directly from your application.
- Pipe events to Statsig through a service like Segment.
- Configure Statsig to ingest data from your warehouse.
Validate your experiment configuration
After your application is set up:
- Validate the configuration through the Statsig console, which provides a live exposure stream as users encounter different variants.
- Statsig flags issues, such as missing identifiers or mismatches between exposure and application events, so you don’t miss results.
After validation, select Start to begin the experiment.
(Optional) Set a Target End Date
Set a target end date using Statsig's power calculator. A target end date ensures you make decisions only after the experiment has gathered enough data for reliable results.
Running Experiments in Registration Funnels
If you don't have user IDs for users who haven't signed up yet, create an experiment using a stableID, which Statsig SDKs auto-generate. The stableID acts as the unit of analysis.
Selecting Key Metrics
When setting up an experiment, configure the key metrics to evaluate your hypothesis. Statsig computes results for all your metrics, but focusing on key metrics helps avoid cherry-picking.
Organize regular experiment reviews
Experiment reviews provide a structured environment to discuss results, share insights, and align on decisions. Run weekly or bi-weekly reviews to reinforce a culture of data-driven decision-making and experimentation rigor.
3. Share your results
Sharing your results widely is key to building momentum for experimentation. Here are a few ways to share insights across your organization:
- Monthly Experimentation Update: Summarize the number of experiments run, their business impact, and key learnings.
- Slack #experimentation Channel: Use a dedicated channel to post real-time experiment learnings and foster discussion.
- Weekly Experiment Review: Open these reviews to a broader audience to increase visibility and foster engagement.
4. Accelerate your speed of experimentation
Cement the value of experimentation
As you gain confidence, try balancing ideas with more uncertain outcomes. Counterintuitive results can solidify the value of experimentation and lead to new discoveries.
Increase experimentation with self-serve experiments
Statsig’s results are trustworthy and easy to interpret, making it possible for any team to run experiments. Reduce the barrier to entry for experimentation by educating team members on how to create and run their own experiments.
Build incentives to run more experiments
Encourage engineers and teams to prioritize impact over shipping new features. Reward them for experimentation outcomes rather than the volume of shipped features, ensuring a focus on end-user value.
5. Build a culture of learning
Accelerate learning
“If you double the number of experiments you do per year, you're going to double your inventiveness.” Jeff Bezos, Founder of Amazon
Frequent experimentation leads to faster learning, helping teams discover user preferences and make data-driven product decisions. Even inconclusive results can prompt deeper analysis and more informed hypotheses.
Measure the impact of your experimentation program
Evaluate your program’s success using key criteria such as:
| Success Criteria | Score | Weight |
|---|---|---|
| Time spent to set up an experiment | ||
| Time spent to prepare experiment results | ||
| Percentage of decisions made using trustworthy data | ||
| Number of experiments run per week | ||
| Quality of experiments run | ||
| Time spent indexing/searching past results and discussions |
Use these criteria to score your team's progress, set goals, and demonstrate the productivity boost from a well-implemented experimentation program.
Was this helpful?